Your browser does not fully support modern features. Please upgrade for a smoother experience.
Please note this is an old version of this entry, which may differ significantly from the current revision.
The prevalence of multiple sclerosis (MS) has been increasing among young people in developing countries over the last years. With the continuous development of new technology, the diagnosis and follow-up of these patients has received new parameters that physicians may use in their practice.
- optical coherence tomography
- optical coherence tomography angiography
- OCT
- OCT-A
1. Introduction
1.1. Background
Multiple sclerosis (MS) is an autoimmune disease of the central nervous system (CNS) characterized by inflammation, demyelination and neuronal loss. It has a high prevalence amongst young people in developed and developing countries [1]. Recent studies found that the disease is more commonly found in the female population, a 3:1 female to male ratio, and has the highest prevalence amongst white, closely followed by black, individuals, with members of Hispanic and Asian descendance having a lower disease incidence [2][3]. Although the underlying cause is not well established, a series of genetic and environmental factors have been defined as increasing disease susceptibility.
1.2. Epidemiology
Visual symptoms tend to appear in ~70% of the MS population, with optic neuritis being the onset symptom in ~20% of MS cases [4]. Optic neuritis (ON) is an acute disorder of the optic nerve characterized by inflammation and demyelination. The patient suffers from vision loss, periocular pain that is triggered by eye movement, contrast and color vision deficits. Visual field defects are present, central-cecal scotomas being the most common defect. The patients may also present with relative afferent pupillary deficit that should be easily diagnosed in cases without prior episodes of optic neuritis (NON) [5]. Posterior segment examination could be normal in retrobulbar neuritis, or there could be signs of papillary edema (in papillitis).
1.3. Anatomy
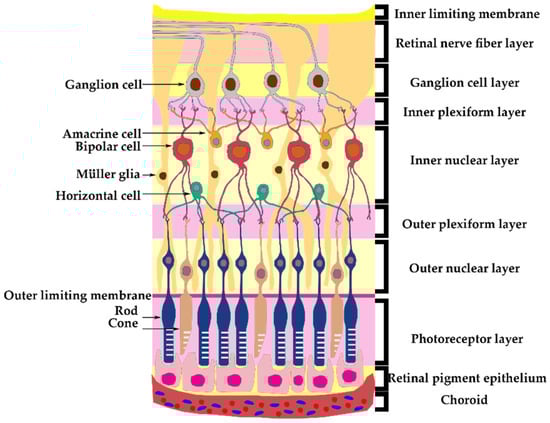
The retina consists of different structural layers (Figure 1). The retinal ganglion cell has the soma in the ganglion cell layer (GCL) and their axons form the retinal nerve fiber layer (RNFL), which will form the optic nerve, exit the eye and travel into the optic canal towards the optic chiasm, where the nasal part of the optic nerves will decussate and with the opposite temporal part will continue towards the lateral geniculate nuclei [6]. Lamina cribrosa (LC) is a fibrous structure that creates a barrier between the axons that form the optic nerve from the retina and the sclera in the intraocular portion.
1.4. Pathophysiology
The pathophysiology of MS consists of damage to the myelin and nerve fibers in the CNS. The oligodendrocytes are responsible for myelination and maintaining the saltatory function when transmitting a nerve impulse. When cells of the immune system react against the myelinated axons of the CNS, different cytokines and chemokines will be released which will infiltrate and interact with elements of the CNS causing oligodendroglial cell-mediated death, demyelination and axonal degeneration. The damage sustained by the optic pathway is a product of both acute CNS damage (ON) and trans-synaptic neurodegeneration [9]. This reaction is located posterior to the lamina cribrosa which explains the inflammatory status of the optic nerve during ON [10].
A number of studies have shown that the thickness of the RNFL and the GCL in MS eyes has the most significant difference compared to healthy eyes [11]. Even though these microstructures used to be hard to evaluate, OCT is now able to provide a thorough examination of these layers in regards to thickness and anatomical structure.
1.5. Optical Coherence Tomography
Optical Coherence Tomography (OCT) is a noninvasive examination of the posterior segment’s structures. It relies on low frequency interferometry to obtain high quality images of the posterior segment elements such as vitreous, retina and choroid. Due to advances in technology, these scanning methods have become higher in quality, have a faster capture rate and a deeper tissue penetration capacity.
OCT biomarkers represent imaging parameters obtained by analyzing various structures of the posterior segment such as RNFL, GCL and vascular parameters that can act as indicators of normal or pathogenic processes. They can be used to assess biological status, disease progression or to monitor treatment efficiency.
2. Optical Coherence Tomography Structural Parameters
2.1. Retinal Layers
Studies published in the last ten years have focused on thickness modifications of the peripapillary RNFL (pRNFL) and the thickness of the GCL in the macular area. Sometimes, the GCL is hard to separate from the inner plexiform layer (IPL) which is underneath, so most machines include both the GCL and the ganglion cell inner plexiform layer (GCIPL) in the report [12].
Saidha et al. investigated 107 patients biannually for 46 months measuring GCIPL using OCT and total brain volume using MRI. The study compared the relation between GCIPL and brain atrophy and how it differs depending on prior episodes of ON. They concluded that a thinning of 1 µm/year in eyes with prior ON results in a 0.06% rate of brain atrophy. In patients without prior ON, the thinning of 1 µm/year led to a 0.46% rate of brain atrophy. The rate of GCIPL thinning also depends on baseline values and disease relapses. They also observed that in patients with recurrent remissive multiple sclerosis (RRMS), the inner nuclear layer (INL) is thicker and microcysts were found in six patients, five of which had prior ON. Therefore, INL analysis could be used to assess the activity of inflammation in the CNS. They concluded that measuring the GCIPL using OCT could mirror the grade of brain atrophy registered by the MRI [13]. Cellerino et al. also analyzed the implications of INL thickness in MS patients establishing a correlation between younger patients, age < 51 and recent T2 lesions [14].
A large multicenter, prospective study conducted by Paul et al. followed 333 patients with RRMS over a 36-month period measuring the pRNFL and GCIPL. Their main results show that there is a faster thinning of the pRNFL in patients with <3 years disease activity compared to those with >5 years disease activity. MS patients without ON had a similar decrease in thickness as those with prior ON, suggesting that the pRNFL thinning is not necessarily a post-inflammatory consequence, but a marker of disease severity. They also suggest that there is not only axonal degeneration, but neuronal loss as well, due to GCIPL thinning. By comparing GCIPL degeneration using OCT and brain volume loss using MRI, they confirm the results of Saida et al., where the GCIPL thinning could be used to assess disease severity in the entire CNS [13][15].
The faster rate of axonal degeneration in RRMS patients in the first years of the disease was also noticed by Cilingir et al. in a study that compared 66 RRMS patients with <3 years of disease activity with a second group of 69 patients with >5 years of RRMS disease activity. They suggest that axonal degeneration is independent of inflammatory activity [16].
Cujba et al. analyzed the OCT structural parameters of RRMS, clinically isolated syndrome (CIS) and healthy eyes. They found that the neurodegenerative process affects the pRNFL and the macular structural layers in the MS ON eyes compared with CIS ON eyes. CIS ON eyes showed a significant decrease in the GCL compared with CIS NON eyes, but no difference regarding pRNFL was found between CIS and healthy patients [17].
Frau et al. conducted a study on 66 MS patients that focused on the relation between RNFL thinning, a decrease in cognitive function and brain atrophy, concluding that they are all consequences of neurodegeneration with no direct link between each other [18].
2.2. Lamina Cribrosa
There have been a number of studies that show the importance of LC measurements in patients with glaucoma. Such a feature has become more accessible because of the development of enhanced depth imaging OCT (EDI-OCT) [19]. In a study by Hamamci et al., patients with MS were divided in three groups. One group was known to have a history of modified visual evoked potentials (VEP), another had no history of modified VEP or ON and there was a third healthy control group. OCT disc analysis was performed for all patients measuring pRNFL thickness and lamina cribrosa thickness (LCT). The latter was measured using manual segmentation by two separate researchers. The results showed that LCT was lower in MS patients with a history of modified VEP compared to the healthy control group, and that pRNFL had the lowest thickness values in the same patient category. They concluded that the results were statistically significant regarding the two parameters; however, larger longitudinal studies should be performed in order to verify these results [20].
2.3. Vascular Changes
The vascular changes that appear in MS have been analyzed in different types of studies. Retinal perivenular abnormalities that appear in regions without oligodendrocytes in ON patients have been found to have a high incidence in developing MS. These vascular modifications appear to be a separate event, and suggest that the inflammatory episodes can occur independently from demyelination [21].
Moreover, different studies suggest that endothelin-1, a vasoconstrictor peptide produced intrathecally, could be responsible for the vascular abnormalities [22]. Endothelin-1 levels were measured in MS patients and results showed that the internal jugular vein blood had significantly higher levels in MS patients compared to a healthy control group. This implies the role that the vasoconstrictor peptide has in cerebral hypoperfusion which appears in MS patients [23]. Furthermore, MS patients with high levels of endothelin-1 receptor in their cerebrospinal fluid (CSF) had a lower visual recovery from ON compared with those without [24]. This comes to support some authors claims that MS is a CNS disease with a strong vascular component [25].
2.4. Choroidal Thickness
The vascular changes that affect MS patients will lead to modifications of the choroidal microarchitecture. By using EDI-OCT, measurement of the choroidal layer has become more accessible in recent years, with choroidal thickness (CT) becoming a new biomarker involved in the follow-up of MS patients [26]. Esen et al. measured the CT in 68 MS patients and compared it to healthy controls. They concluded that all MS patients present modifications of the choroidal architecture, with ON eyes having a thicker CT, whilst NON eyes have a thinner CT compared to healthy controls [27]. Masala et al. performed a similar study in which the results were not statistically significant when comparing CT in MS and healthy eyes. However, all patients with a history of ON presented a thicker CT [28]. In a study by Garcia-Martin et al., an automated method of measuring CT in MS patients had been used. The advantages of this method were the large area of analysis, other manual studies having only certain points of measurement, the automatic determination removing the human source of error and increasing the accuracy and reproducibility rates. They concluded that MS eyes have a thinner CT compared with healthy eyes, the values being of a higher difference as the measurements approach the peripapillary area [29].
3. Optical Coherence Tomography Angiography Vascular Density Parameters
Optical Coherence Tomography Angiography (OCT-A) is a method of visualizing in vivo the vascular architecture of the superficial and deep plexus of the retina and the choriocapillaris plexus. By realizing several sequential OCT scans, the method uses erythrocyte blood flow as a method of mapping the retinal vessels. It is a non-invasive technique that has become a subject of intense research in recent years [30][31].
The parameters gained from this investigation can quantify the vascular density (VD) in different areas such as the area surrounding the optic disc, the macular area and at different levels such as the retinal superficial vascular plexus (SVP), deep vascular plexus (DVP) and the choriocapillaris plexus. Studies using different machines were used to compare these values in healthy and MS eyes with or without prior ON. The SVP contains blood vessels that form the inner retina (from the RNFL to the INL), while the DVP is formed from vessels found in the outer retina. Many studies have recently tried to highlight the differences in OCT-A parameters between healthy and MS patients.
Farci et al. analyzed the capillary flow density (CFD) at different vascular levels in MS patients, both with a history of ON and without, and compared them to a healthy control group. The results showed an increase in the CFD in MS patients at all levels except for the SVP, regardless of their ON history. Therefore, vascular modifications that occur at these levels appear to be independent of the inflammatory status [32].
When correlating with retinal structural layers, the atrophy of the RNFL and GCIPL may lead to a loss of vascularization at this level which could explain the lower vascular density in MS patients in the SVP [32].
Montorio et al. conducted a study using a widefield imaging device which allowed measuring CFD, in MS patients, in the peripheral retina where the ganglion cell complex is normally reduced and showed that there is a decrease in VD even in the periphery. This suggests that vascular atrophy in the SVP may occur independently from GCIPL atrophy [33].
3.1. Optic Nerve Head Perfusion
Studies regarding optic nerve head (ONH) perfusion using OCT-A have been around since 2014. Wang et al. analyzed the ONH flow index (ONHFI) using a prototype scanning method and compared MS eyes with healthy ones. The results showed a significant decrease in ONHFI amongst the MS population especially in eyes with prior ON episodes. They also analyzed the parafoveal flow index with no significant differences between the groups [34].
ONHFI was also researched in a study by Spain et al. where they compared the ONHFI of MS eyes with healthy eyes. The results showed a decreased ONHFI in MS patients, especially when there was ON history. However, the results showed no correlations with structural OCT parameters or visual function. They concluded that combining ONHFI with OCT structural parameters provided a better accuracy in diagnosing nerve damage [35].
Smaller studies analyzed the perfusion surrounding the optic nerve head (ONH) and the findings suggested that there is a significant VD reduction in the SVP and DVP in MS eyes compared to healthy eyes, regardless of their ON history, which is correlated with a lower pRNFL thickness [36].
In glaucoma, the decrease in ONHFI has been proven to correlate with visual field defects [37], while in MS this correlation has not been found. Cennamo et al. analyzed the VD of the macular SVP, DVP, CC and the area surrounding the ONH of MS patients, patients with an isolated demyelinating episode (IDE) and healthy patients. They found no correlation between these parameters and neurological symptoms or visual field modifications. Regarding structural OCT values, they found that the GCL modifications correlate with VD in the SVP and around the ONH while RNFL modifications correlate with VD surrounding the ONH. The VD in patients with an isolated demyelinating episode was significantly lower when compared with MS eyes or healthy ones, while the VD in the SVP and surrounding the ONH was lower in MS eyes compared to healthy ones. The VD surrounding the ONH was lower in MS eyes compared with those with IDE. DVP and CC VD showed no significant differences between the investigated groups [38].
Ulusoy et al. measured the peripapillary VD noting that there is also a significant decrease in the inferior and temporal quadrants when compared to healthy eyes. While they found no significant VD differences in the DVP between ON and NON eyes, they did find a correlation between parameters and disease activity [39].
Bhaduri et al. studied the VD surrounding the ONH and compared it to disease activity and pRNFL in both MS patients and controls. Their study showed a decrease in VD regardless of the ON status of the patients which only correlated with disease severity. They propose that central changes in the vascular architecture are secondary to peripheral phlebitis-related modifications but were unable to correlate these findings due to limitations in OCT-A protocols [40].
3.2. Macular Area Perfusion
The macular area has been a major area of analysis. Lanzillo et al. compared the VD in the macula region between healthy and MS eyes and noted that there is a significant correlation between VD and OCT parameters except for the foveal area and that the VD from MS eyes was significantly lower than the VD from healthy eyes [41].
3.3. Superficial Vascular Plexus Vascular Density
In a study by Murphy et al., the VD from the SVP and DVP was compared between MS patients and healthy control groups, observing that there is a decrease in SVP VD in MS patients. These values appear to be even lower in MS patients with ON compared to those without. There were no significant changes found in the DVP; however, a correlation between DVP and INL thickness had been reported. While associations between lower SVP VD and disease duration and severity could be drawn, this was not the case for DVP [42].
3.4. Deep Vascular Plexus Vessel Density
Feucht et al. compared MS patients, CIP and healthy patients and found that there are decreased values in VD in the SVP and DVP in ON eyes whilst NON and control eyes show comparable values. No differences regarding the VD of the CC were found; however, increased CC VD was correlated with recent disease activity. OCT structural parameters were lower in the ON group compared with NON eyes and they correlated with OCT-A VD values. No IED regarding OCT-A parameters was found [43].
3.5. Volumetric Vascular Density
In a cross-sectional study, Jiang et al. defined volumetric vascular density (VVD) as a new parameter obtained by reporting the vessel density of the plexus to the corresponding tissue volume. The vessel density is calculated after removing the large vessels from the analysis, making the vessel density values unable to be compared with others from different studies of the same type. VVD is significantly increased in MS NON vs. healthy patients in the deep and whole retinal vascular plexus. VVD in MS ON is significantly increased compared to MS NON and healthy patients. Unlike other reports, vessel density from the superficial and whole retina plexus in MS NON are increased compared to healthy control groups. Retinal tissue volume, RNFL and GCL are decreased in MSON and MSNON compared to healthy patients. Combined INL and OPL thickness was decreased in MS ON compared to control groups. They suggest that VVD has a better correlation with visual function and disease duration compared to VD. Furthermore, the correlation between VVD and structural parameters offers the capacity to distinguish between MS-ON, MS-NON and control groups with a higher specificity than without the vascular parameters [44].
3.6. Choroidal and Choriocapillaris Vascular Density
Using OCT-A, Jesus et al. measured the VD in the choroid and choriocapillaris layers. They compared 45 eyes of 45 MS patients with a 45 age-matched control group, analyzing the VD surrounding the fovea up to 1500 µm. Their study showed a statistically significant decrease in VD in both layers in the foveal and parafoveal regions, from 500 to 1500 µm. Moreover, patients with a history of ON showed an even greater VD decrease, especially in the choroidal layer [45]. These findings, although not correlated with other parameters except for axial length, incline to support the hypothesis of a choroidal ischemia that leads to retinal degeneration in MS patients.
Gao et al. measured the CC VD and choroidal VD and compared between MS and healthy eyes, finding that MS NON patients presented decreased values, highlighting the role the outer retina (ORT) plays during disease activity. ORT thickness and CT had no differences between the MS and control group, and no correlation could be made regarding OCT-A parameters and disease activity [46].
4. Inter-Eye Differences
Murphy et al. performed a cross sectional study to compare inter-eye differences (IED) in RNFL, GCL, average macular thickness (AMT) and superficial vascular plexus density between MS patients with and without a history of ON. They concluded there is a larger IED in all parameters for MS patients who suffered an ON episode compared to those who did not. The superficial vascular plexus showed larger IED values for patients with >1 year since the ON episode, whilst those <1 showed lower differences [47]. This could suggest that the vascular changes that affect the retinal superficial plexus are not directly related to the inflammatory episode. Cordon et al. confirm these results with their study in which the SVP in MS patients presented a lower density than in healthy control groups especially in cases with disease activity >5 years. Therefore, this reaffirms the fact that the modifications in the SVP architecture are unlikely to be caused by the episode of ON, but by disease activity itself [48].
5. Foveal Avascular Zone
The foveal avascular zone (FAZ) is an area with no vessels that is vital for normal visual function. Vascular modifications that take part in this area have been shown to have a significant purpose in decreasing normal visual function. FAZ enlargement can be measured using OCT-A, and has been studied in both the SVP and DVP to better understand the modifications on the macula at these levels [49]. Yilmaz et al. found no significant differences between MS and healthy patients regarding the FAZ area, perimeter or circulation. However, they noticed an inverse correlation between VD and the FAZ area at all levels [50]. These findings are also supported by Balikci et al., who also found no significant differences between healthy and MS eyes regarding FAZ parameters [51]. On the other hand, Montorio et al. found larger FAZ areas in MS patients which contradicts the previous study. However, a reason for their findings may lie in the fact that they included a small lot size [33].
This entry is adapted from the peer-reviewed paper 10.3390/biomedicines11113031
References
- Dobson, R.; Giovannoni, G. Multiple sclerosis—A review. Eur. J. Neurol. 2018, 26, 27–40.
- Hittle, M.; Culpepper, W.J.; Langer-Gould, A.; Marrie, R.A.; Cutter, G.R.; Kaye, W.E.; Wagner, L.; Topol, B.; LaRocca, N.G.; Nelson, L.M.; et al. Population-Based Estimates for the Prevalence of Multiple Sclerosis in the United States by Race, Ethnicity, Age, Sex, and Geographic Region. JAMA Neurol. 2023, 80, 693.
- Langer-Gould, A.M.; Gonzales, E.G.; Smith, J.B.; Li, B.H.; Nelson, L.M. Racial and Ethnic Disparities in Multiple Sclerosis Prevalence. Neurology 2022, 98, e1818–e1827.
- Bennett, J.L. Optic Neuritis. CONTINUUM Lifelong Learn. Neurol. 2019, 25, 1236–1264.
- Kale, N. Optic neuritis as an early sign of multiple sclerosis. Eye Brain 2016, 8, 195–202.
- Britze, J.; Frederiksen, J.L. Optical coherence tomography in multiple sclerosis. Eye 2018, 32, 884–888.
- Picard, E.; Daruich, A.; Youale, J.; Courtois, Y.; Behar-Cohen, F. From Rust to Quantum Biology: The Role of Iron in Retina Physiopathology. Cells 2020, 9, 705.
- Zhang, J.; Zhang, T.; Zeng, S.; Zhang, X.; Zhou, F.; Gillies, M.C.; Zhu, L. The Role of Nrf2/sMAF Signalling in Retina Ageing and Retinal Diseases. Biomedicines 2023, 11, 1512.
- Puthenparampil, M.; Federle, L.; Poggiali, D.; Miante, S.; Signori, A.; Pilotto, E.; Rinaldi, F.; Perini, P.; Sormani, M.P.; Midena, E.; et al. Trans-synaptic degeneration in the optic pathway. A study in clinically isolated syndrome and early relapsing-remitting multiple sclerosis with or without optic neuritis. PLoS ONE 2017, 12, e0183957.
- Ciapă, M.A.; Șalaru, D.L.; Stătescu, C.; Sascău, R.A.; Bogdănici, C.M. Optic Neuritis in Multiple Sclerosis—A Review of Molecular Mechanisms Involved in the Degenerative Process. Curr. Issues Mol. Biol. 2022, 44, 3959–3979.
- Petzold, A.; Balcer, L.J.; Calabresi, P.A.; Costello, F.; Frohman, T.C.; Frohman, E.M.; Martinez-Lapiscina, E.H.; Green, A.J.; Kardon, R.; Outteryck, O.; et al. Retinal layer segmentation in multiple sclerosis: A systematic review and meta-analysis. Lancet Neurol. 2017, 16, 797–812.
- Petzold, A.; de Boer, J.F.; Schippling, S.; Vermersch, P.; Kardon, R.; Green, A.; Calabresi, P.A.; Polman, C. Optical coherence tomography in multiple sclerosis: A systematic review and meta-analysis. Lancet Neurol. 2010, 9, 921–932.
- Saidha, S.; Al-Louzi, O.; Ratchford, J.N.; Bhargava, P.; Oh, J.; Newsome, S.D.; Prince, J.L.; Pham, D.; Roy, S.; van Zijl, P.; et al. Optical coherence tomography reflects brain atrophy in multiple sclerosis: A four-year study. Ann. Neurol. 2015, 78, 801–813.
- Cellerino, M.; Cordano, C.; Boffa, G.; Bommarito, G.; Petracca, M.; Sbragia, E.; Novi, G.; Lapucci, C.; Capello, E.; Uccelli, A.; et al. Relationship between retinal inner nuclear layer, age, and disease activity in progressive MS. Neurol.-Neuroimmunol. Neuroinflamm. 2019, 6, e596.
- Paul, F.; Calabresi, P.A.; Barkhof, F.; Green, A.J.; Kardon, R.; Sastre-Garriga, J.; Schippling, S.; Vermersch, P.; Saidha, S.; Gerendas, B.S.; et al. Optical coherence tomography in multiple sclerosis: A 3-year prospective multicenter study. Ann. Clin. Transl. Neurol. 2021, 8, 2235–2251.
- Cilingir, V.; Batur, M. Axonal Degeneration Independent of Inflammatory Activity: Is It More Intense in the Early Stages of Relapsing-Remitting Multiple Sclerosis Disease? Eur. Neurol. 2020, 83, 508–516.
- Cujba, L.; Stan, C.; Samoila, O.; Drugan, T.; Cutas, A.B.; Nicula, C. Identifying Optical Coherence Tomography Markers for Multiple Sclerosis Diagnosis and Management. Diagnostics 2023, 13, 2077.
- Frau, J.; Fenu, G.; Signori, A.; Coghe, G.; Lorefice, L.; Barracciu, M.A.; Sechi, V.; Cabras, F.; Badas, M.; Marrosu, M.G.; et al. A cross-sectional and longitudinal study evaluating brain volumes, RNFL, and cognitive functions in MS patients and healthy controls. BMC Neurol. 2018, 18, 67.
- Ersöz, M.G.; Mart, D.K.; Hazar, L.; Ayıntap, E.; Güneş, İ.B.; Konya, H.Ö. Evaluation of Prelaminar Region and Lamina Cribrosa with Enhanced Depth Imaging Optical Coherence Tomography in Pseudoexfoliation Glaucoma. Türk Oftalmol. Derg. 2018, 48, 109–114.
- Hamamcı, M.; Küçük, B.; Bayhan, S.; Bayhan, H.; İnan, L. Can Lamina Cribrosa Indicate Optic Neuritis in Multiple Sclerosis? Neurol. India 2022, 70, 2366.
- Lightman, S.; McDonald, W.I.; Bird, A.C.; Francis, D.A.; Hoskins, A.; Batcholer, J.R.; Halliday, A.M. Retinal Venous Sheating in Optic Neuritis. Brain 1987, 110, 405–414.
- Caprio, M.G.; Russo, C. Vascular Disease in Patients with Multiple Sclerosis: A Review. J. Vasc. Med. 2016, 4, 2.
- D’haeseleer, M.; Beelen, R.; Fierens, Y.; Cambron, M.; Vanbinst, A.-M.; Verborgh, C.; Demey, J.; Keyser, J.D. Cerebral hypoperfusion in multiple sclerosis is reversible and mediated by endothelin-1. Proc. Natl. Acad. Sci. USA 2013, 110, 5654–5658.
- Castellazzi, M.; Lamberti, G.; Resi, M.V.; Baldi, E.; Caniatti, L.M.; Galante, G.; Perri, P.; Pugliatti, M. Increased Levels of Endothelin-1 in Cerebrospinal Fluid Are a Marker of Poor Visual Recovery after Optic Neuritis in Multiple Sclerosis Patients. Dis. Markers 2019, 2019, 9320791.
- Minagar, A.; Jy, W.; Jimenez, J.J.; Alexander, J.S. Multiple sclerosis as a vascular disease. Neurol. Res. 2006, 28, 230–235.
- Doğan, Ü.; Ulaş, F.; Türkoğlu, Ş.A.; Ögün, M.N.; Ağca, S. Eyes are mirror of the brain: Comparison of multiple sclerosis patients and healthy controls using OCT. Int. J. Neurosci. 2019, 129, 848–855.
- Esen, E.; Sizmaz, S.; Demir, T.; Demirkiran, M.; Unal, I.; Demircan, N. Evaluation of Choroidal Vascular Changes in Patients with Multiple Sclerosis Using Enhanced Depth Imaging Optical Coherence Tomography. Ophthalmologica 2015, 235, 65–71.
- Masala, A.; Mola, I.D.; Cellerino, M.; Pera, V.; Vagge, A.; Uccelli, A.; Christian, C.; Traverso, C.E.; Iester, M. Choroidal Thickness in Multiple Sclerosis: An Optical Coherence Tomography Study. J. Clin. Neurol. 2022, 18, 334.
- Garcia-Martin, E.; Jarauta, L.; Pablo, L.E.; Bambo, M.P.; Ara, J.R.; Martin, J.; Polo, V.; Larrosa, J.M.; Vilades, E.; Ramirez, T.; et al. Changes in peripapillary choroidal thickness in patients with multiple sclerosis. Acta Ophthalmol. 2018, 97, e77–e83.
- Bostan, M.; Pîrvulescu, R.; Tiu, C.; Bujor, I.; Popa-Cherecheanu, A. OCT and OCT-A biomarkers in multiple sclerosis-review. Rom J. Ophthalmol. 2023, 67, 107–110.
- Wang, L.; Murphy, O.; Caldito, N.G.; Calabresi, P.A.; Saidha, S. Emerging Applications of Optical Coherence Tomography Angiography (OCTA) in neurological research. Eye Vis. 2018, 5, 11.
- Farci, R.; Carta, A.; Cocco, E.; Frau, J.; Fossarello, M.; Diaz, G. Optical coherence tomography angiography in multiple sclerosis: A cross-sectional study. PLoS ONE 2020, 15, e0236090.
- Montorio, D.; Cennamo, G.; Carotenuto, A.; Petracca, M.; Morra, V.B.; Costagliola, C. Correlation analysis between foveal avascular zone and near peripheral retinal hypoperfusion in multiple sclerosis: A wide field optical coherence tomography angiography study. Front. Med. 2022, 9, 1032514.
- Wang, X.; Jia, Y.; Spain, R.; Potsaid, B.; Liu, J.J.; Baumann, B.; Hornegger, J.; Fujimoto, J.G.; Wu, Q.; Huang, D. Optical coherence tomography angiography of optic nerve head and parafovea in multiple sclerosis. Br. J. Ophthalmol. 2014, 98, 1368–1373.
- Spain, R.I.; Liu, L.; Zhang, X.; Jia, Y.; Tan, O.; Bourdette, D.; Huang, D. Optical coherence tomography angiography enhances the detection of optic nerve damage in multiple sclerosis. Br. J. Ophthalmol. 2017, 102, 520–524.
- Nawar, A.; Khader, S.; Ghali, A.; Ghoneim, A. Evaluation of optical coherence tomography angiography findings in patients with multiple sclerosis. Indian J. Ophthalmol. 2021, 69, 1457.
- Hwang, J.C.; Konduru, R.; Zhang, X.; Tan, O.; Francis, B.A.; Varma, R.; Sehi, M.; Greenfield, D.S.; Sadda, S.R.; Huang, D. Relationship among Visual Field, Blood Flow, and Neural Structure Measurements in Glaucoma. Investig. Opthalmol. 2012, 53, 3020–3026.
- Cennamo, G.; Carotenuto, A.; Montorio, D.; Petracca, M.; Moccia, M.; Melenzane, A.; Tranfa, F.; Lamberti, A.; Spiezia, A.L.; Servillo, G.; et al. Peripapillary Vessel Density as Early Biomarker in Multiple Sclerosis. Front. Neurol. 2020, 11, 542.
- Ulusoy, M.O.; Horasanlı, B.; Işık-Ulusoy, S. Optical coherence tomography angiography findings of multiple sclerosis with or without optic neuritis. Neurol. Res. 2020, 42, 319–326.
- Bhaduri, B.; Nolan, R.M.; Shelton, R.L.; Pilutti, L.A.; Motl, R.W.; Moss, H.E.; Pula, J.H.; Boppart, S.A. Detection of retinal blood vessel changes in multiple sclerosis with optical coherence tomography. Biomed. Opt. Express 2016, 7, 2321.
- Lanzillo, R.; Cennamo, G.; Criscuolo, C.; Carotenuto, A.; Velotti, N.; Sparnelli, F.; Cianflone, A.; Moccia, M.; Morra, V.B. Optical coherence tomography angiography retinal vascular network assessment in multiple sclerosis. Mult. Scler. J. 2017, 24, 1706–1714.
- Murphy, O.C.; Kwakyi, O.; Iftikhar, M.; Zafar, S.; Lambe, J.; Pellegrini, N.; Sotirchos, E.S.; Gonzalez-Caldito, N.; Ogbuokiri, E.; Filippatou, A.; et al. Alterations in the retinal vasculature occur in multiple sclerosis and exhibit novel correlations with disability and visual function measures. Mult. Scler. J. 2019, 26, 815–828.
- Feucht, N.; Maier, M.; Lepennetier, G.; Pettenkofer, M.; Wetzlmair, C.; Daltrozzo, T.; Scherm, P.; Zimmer, C.; Hoshi, M.-M.; Hemmer, B.; et al. Optical coherence tomography angiography indicates associations of the retinal vascular network and disease activity in multiple sclerosis. Mult. Scler. J. 2018, 25, 224–234.
- Jiang, H.; Gameiro, G.R.; Liu, Y.; Lin, Y.; Hernandez, J.; Deng, Y.; Gregori, G.; Delgado, S.; Wang, J. Visual Function and Disability Are Associated with Increased Retinal Volumetric Vessel Density in Patients with Multiple Sclerosis. Am. J. Ophthalmol. 2020, 213, 34–45.
- Jesus, J.; Soares, R.; Geraldes, R.; Matias, M.; Chibante, J. Analysis of choroidal vessel density in patients with multiple sclerosis. Biomark. Neuropsychiatry 2021, 5, 100040.
- Gao, Y.; Liu, Y.; Zhang, Y.; Lang, Y.; Xu, H.; Tao, Y.; Li, Y.; Mou, K.; Zhang, Y.; Man, S.; et al. Assessment of Outer Retina and Choroid Using Swept Source Optical Coherence Tomography and Angiography in Patients With Multiple Sclerosis. J. Neuro-Ophthalmol. 2023.
- Murphy, O.C.; Kalaitzidis, G.; Vasileiou, E.; Filippatou, A.G.; Lambe, J.; Ehrhardt, H.; Pellegrini, N.; Sotirchos, E.S.; Luciano, N.J.; Liu, Y.; et al. Optical Coherence Tomography and Optical Coherence Tomography Angiography Findings After Optic Neuritis in Multiple Sclerosis. Front. Neurol. 2020, 11, 618879.
- Cordon, B.; Vilades, E.; Orduna, E.; Satue, M.; Perez-Velilla, J.; Sebastian, B.; Polo, V.; Larrosa, J.M.; Pablo, L.E.; Garcia-Martin, E. Angiography with optical coherence tomography as a biomarker in multiple sclerosis. PLoS ONE 2020, 15, e0243236.
- Samara, W.A.; Say, E.A.T.; Khoo, C.T.L.; Higgins, T.P.; Magrath, G.; Ferenczy, S.; Shields, C.L. Correlation of foveal avascular zone size with foveal morphology in normal eyes using optical coherence tomography angiography. Retina 2015, 35, 2188–2195.
- Yilmaz, H.; Ersoy, A.; Icel, E. Assessments of vessel density and foveal avascular zone metrics in multiple sclerosis: An optical coherence tomography angiography study. Eye 2019, 34, 771–778.
- Balıkçı, A.; Yener, N.P.; Seferoğlu, M. Optical Coherence Tomography and Optical Coherence Tomography Angiography Findings in Multiple Sclerosis Patients. Neuro-Ophthalmology 2021, 46, 19–33.
This entry is offline, you can click here to edit this entry!