Living systems are highly complex systems, which makes them challenging for quantitative investigations. Approaches in current biology and biotechnology research are increasingly aimed at the identification and precise characterization of basic processes on the level of individual cells or even biomolecules, like proteins, amino acids, and lipids.
2. Basic Principles of Raman Spectroscopy
As is well known, photons of frequency νinc can be scattered by molecules elastically or inelastically: the former are assigned to Rayleigh scattering, while the shifted photons are associated with Raman scattering.
In the context of a quantum description, Rayleigh photons derive from the excitation of a virtual energy level followed by an instantaneous decay towards the same starting vibrational level (νRay = νinc). Conversely, Raman photons (νRaman ≠ νinc) can arise from two different decay channels. If the molecule occupies the lowest vibrational energy level, the decay occurs towards the first excited vibrational level, and the emitted photons exhibit an energy lower than the incident photons (Stokes photons, νStokes < νinc). On the other hand, when the molecule is initially on an excited vibrational level, the decay can take place towards the fundamental level and the emitted photons show an energy higher than the incident photons (anti-Stokes photons, νanti-Stokes > νinc). In both cases, the Raman signal involves a coupling to the internal degree of freedom of the molecule, i.e., the molecular vibration of frequency νvib. In particular, Raman photons have frequency νRaman = νinc ± νvib, where the sum/difference results in anti-Stokes/Stokes Raman scattering, respectively. According to Boltzmann’s statistics, at room temperature, the vibrational levels are poorly occupied; therefore, the anti-Stokes signal is much less intense than the Stokes one. Importantly, since the shift in energy of Stokes photons is associated with the discrete vibrational modes of polarizable molecules, Raman spectra represent an analytical tool for determining the biochemical composition of the investigated analyte (“chemical fingerprint”). In this regard, RS provides information quite similar to that deriving from IR absorption. However, the two techniques have experienced a quite different fortune for biological applications. This is mainly due to the strong IR-absorption cross section of water, which usually masks the contribution of species in aqueous environment. In contrast, water interferes only poorly with Raman spectrum of aqueous solutions, due to the quite low water Raman activity.
Focusing on the study of biological material, the most significant spectral regions fall within 400–2000 cm
−1 wavenumbers, typically associated with the bond vibrations of relevant macromolecules. In particular, Amide I-III protein bands fall in this range and provide useful insight on protein secondary structures; carbohydrates lie in the 1500–1700 cm
−1 spectral range, while phosphate groups of DNA can be found in the 470–1200 cm
−1 region. Higher-frequency bond vibrations associated with CH, NH, and OH stretching in lipids and proteins are instead observed in the range 2700–3500 cm
−1 [
24].
However, due to the high number of vibrational degrees of freedom that occurs in complex molecules made up of numerous atoms, a typical Raman spectrum of biological material is overly complex, and the extraction of biological information is quite challenging. Therefore, multivariate analysis approaches are often necessary to distinguish the different molecular components present in the specimen.
The other side of the coin of Raman analysis is related to the exceptionally low probability of occurrence of Raman scattering: each Raman photon corresponds to ~106 Rayleigh scattered photons. The strength of the Raman effect can also increase by some order of magnitude if the laser frequency is resonant with molecular electronic transitions (resonance Raman scattering, RRS), but in such conditions, the contrast of Raman peaks could be reduced by the co-presence of a broad fluorescence spectrum.
Such negative features of Raman spectroscopy have relegated this technique to specific and rare applications for decades after its discovery. Its recent impressive diffusion is to be found in the extraordinary technological progress related to efficient laser sources, low-noise solid-state detectors, and effective filters to remove Rayleigh background. From an experimental point of view, a Raman spectrum is recorded through the following steps: collecting the scattered photons, rejecting the intense Rayleigh photons (usually by a notch-filter), dispersing the inelastic photons by means of efficient diffraction gratings, and recording the peaks with low-noise CCD camera [
25].
In recent times, Raman spectroscopy has been combined with confocal optical microscopy (micro-Raman spectroscopy) and even with optical tweezers (Raman tweezers) [
26,
27] to analyze single microparticles, bacteria, or cells [
28,
29].
The spatial resolution of a micro-Raman system is limited by the diffraction of light and, according to Abbe’s law, it is dAbbe = λ/2NA, where λ is the used laser wavelength and NA is the numerical aperture of the objective lens. For visible radiation and high NA objectives, dAbbe is ~0.300 μm in the transverse plane, while in the axial direction it is ~1.2 μm. It is clear that, for extended samples, it is possible to acquire the Raman spectra on a two- or three-dimensional array of points, with a step comparable with the spatial resolution (raster scan). The collected spectra can then be analyzed in terms of the intensity of a selected Raman band corresponding to a specific bio-chemical component of the sample. The result is a spatial image of the abundance of that specific component (Raman imaging). Nowadays, Raman imaging is becoming a tool for a patchwork of interdisciplinary research, involving physicists, chemists, biologists, and molecular biologists and clinicians.
Alongside the many advantages of RS, however, it should be emphasized that the cross section of Raman scattering is quite low, typically ~10−25−10−30 cm2, depending on whether the process is resonant or non-resonant. In a typical Raman measurement using a diffraction-limited laser beam, the typical detection volume is of the order of few fL and, for concentrations of ~1 μM, the total number of scattering molecules is ~106. Even after optimizing the power of the Raman probe and the integration time, the obtained signal approaches a signal-to-noise ratio close to 1, i.e., clearly not enough for many applications in which the analytes are present at sub μM concentrations, or for very thin samples.
As will be discussed in the next paragraph, this drawback has been overcome thanks to the discovery of the SERS (surface-enhanced Raman scattering) technique which pushes the limit of detection even to the single molecule level [
30].
3. Surface- and Tip-Enhanced Raman Scattering
The discovery of SERS dates backs to 1974, when Fleishmann and co-workers [
17] accidentally observed an anomalous enhancement of the Raman signal when pyridine molecules were deposited over a roughened silver surface. A few years later, two independent papers [
31,
32] provided a physical interpretation of the phenomenon based on localized surface plasmon resonances (LSPRs) induced by the laser radiation shining on metal nanostructured surfaces.
Since this initial discovery, there has been an impressive growth in the number of publications that have confirmed this phenomenon, and the SERS technique is today a powerful spectroscopic tool with high sensitivity and chemical selectivity [
33,
34,
35]. Research activity in the field of plasmon-enhanced spectroscopies and their numerous applications is nowadays rooted in many laboratories scattered around the world. An indicator of the great interest in this research topic is the huge number of publications: by searching various databases using the keyword SERS more than 3 × 10
4 papers are found. Even in Italy, there is very lively activity on this topic, but the detailed description of these studies is beyond the scope of this text. For more information on the trend of Italian research, one can visit the website
www.plasmonica.it (accessed on 14 September 2023). Among the countless applications, we note the most significant ones: environmental science [
43], cancer detection [
44], free immunoassay platform [
45], food safety [
46], and, very recently, coronavirus detection [
47].
Coming to the basic physical principles, LSPR originates from the interaction between laser radiation and free electrons, which causes coherent and collective electron oscillations at the interface of two media having the real part of dielectric functions of the opposite sign. This condition is usually realized at the interface between noble metals (mainly gold and silver) and dielectrics. Noble metals exhibit resonance wavelength located typically in the visible and near-infrared regions. Although metals are the most used plasmonic materials, significant plasmonic responses are also observed in heavily doped semiconductors and 2D materials.
The plasmon frequency is certainly the most representative parameter of plasmonic effect:
where
𝑛𝑒 is the electronic density,
𝑒 is the elementary charge,
𝑚* is the effective electron mass, and
𝜖0 is the vacuum dielectric constant. For many metals,
𝜔𝑝 lies typically in the UV region.
A full description of LSPR is based on Maxwell’s equations [
48], but this is beyond the scope of this text. A simplified approach to describe SERS is based on a metal spherical nanoparticle (NP) illuminated by laser light. The oscillating electromagnetic (EM) field can sustain collective oscillating surface plasmonic multipoles. If the size of the NP is small compared to the wavelength of the incident light, the plasmonic wave packet remains confined around the metal surface, giving rise to a surface plasmon (SP). Moreover, if the frequency of the incident EM field is close to the SP oscillation frequency, the field extinction (i.e., the sum of absorption and scattering) presents a maximum. It is not difficult to image that the SP resonance depends critically on the size and shape of the employed NP. The plasmonic response of NPs has attracted considerable interest since ancient times, when they were used as decorative pigments in stained glass and artworks. Probably the most famous example of such an application is the Lycurgus Cup (4th century), which exhibits different colors depending on whether light is passing through it. As already said, a comprehensive model of SP resonances is based on Maxwell’s equations with appropriate boundary conditions. A useful approximation scheme is the so-called electrostatic approximation, in which the optical field is considered constant over distances comparable to particle size, so that phase delay effects can be neglected (in practice, for visible radiation, the electrostatic approximation works well for objects of typical sizes up to ~10 nm). However, fully analytical solutions of Maxwell’s equations exist in a few selected simple geometries (Mie theory), as spheres and cylinders, while for generic geometries, numerical simulations are used. For simple geometries, like a sphere, the particle behaves as an induced dipole whose polarizability depends on the dielectric constants as follows:
where
V is the particle volume,
𝜀=𝜀𝑟+𝑖𝜀𝑖𝑚 is the complex frequency-dependent dielectric function of the metal, and
ɛm is the dielectric constant of the surrounding medium.
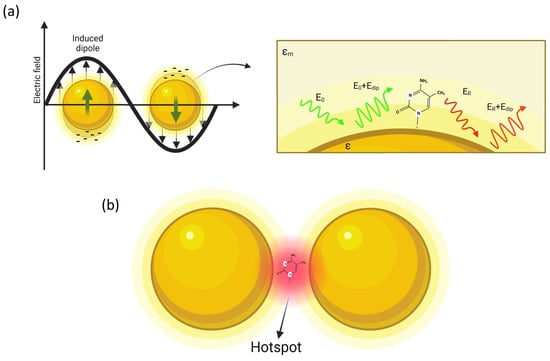
As depicted in
Figure 1, a molecule in proximity of the sphere (at distance
d) is exposed to a field
Etot, which is the superposition of the incident field
E0 and the dipole-field
Edip:
Figure 1. Simple description of SERS: (a) a metal nanoparticle illuminated by light causes the oscillation of the free electrons of the surface, so that a molecule placed at nanometric distance from the NP surface is affected by an amplified optical field; (b) amplification is further increased in the gap region in a dimer structure (hot-spot).
It is possible to define an optical gain as the ratio of the total field
Etot at the molecule position to the incoming field
E0:
Despite the simplified model used, Equation (4) shows two notable results. Firstly, the denominator leads to a strong resonance when, at the laser frequency 𝜈𝐿, 𝜀+2𝜀𝑚 reaches a minimum. The second interesting aspect is the dependence on the third power of the distance d between the analyte and the metal surface.
A second amplification step occurs because the Raman field itself is also enhanced. Therefore, considering both the incident and Raman field amplification, the total electromagnetic gain
G of the Raman signal intensity is
where
𝜈𝐿 and
𝜈𝑅 are the frequencies of the incident field and Raman photons, respectively. Interestingly, Equation (5) shows that the gain factor
G decreases as (1/
d)
12, which is responsible for the local character of SERS enhancement [
49].
In a real measurement, to give an estimation of how much the
SERS signal (
ISERS) is greater than the spontaneous Raman (
SR) signal (
ISR), the two signals have to be properly normalized. This is commonly introduced as the enhancement factor
EF, defined as follows:
in which the intensities
ISERS and
ISR are normalized to the respective number of detected molecules, and to the laser power and integration time employed in the respective measurements.
It is worth noticing that, in the electrostatic approximation, the plasmon resonance does not depend on the size of the NP. Nevertheless, following a more rigorous approach (Maxwell’s equations), it is possible to show that, considering the boundary conditions of the optical field, the size of the NP plays a significant role. As a general rule, as the NP size increases, (i) the resonances shift to the red, (ii) they are strongly damped and spectrally broadened, and (iii) new resonances appear because of the activation of multipolar resonances (such as quadrupolar resonances).
Although the single particle model is effective for understanding the basic mechanism of plasmon amplification, the intensity of the optical gain is not particularly high. This is the reason leading to the use of more complex nanostructures. The next step is to consider, for example, two nanospheres placed at a nanometer distance. It is possible to demonstrate that resonance coupling produces a red shift of the plasmon resonance, and, still more interestingly, the field amplification is mainly focused on the gap separating the two spheres, as illustrated in
Figure 1b. These highly localized regions of intense local field enhancement are also observed within the interstitial crevices present in metallic nanostructures, and are called “hot-spots” [
50]. Such hot-spots provide huge enhancements of up to 10
14 orders of magnitude in areas of subwavelength localization, allowing to reach sensitivity at single molecule level [
51].
For gap distances below ~1 nm, the classic electromagnetic theory is no longer valid, and a quantum mechanical approach is necessary. Interestingly, as a rule, the SERS signal shows a critical dependence on the distance from the hot-spot because it drops to zero within a few tens of nm. As we will see later, this peculiarity plays a key role in the study of interfaces.
The enhancement effect just described is commonly referred to as electromagnetic enhancement. However, another cause of SERS enhancement is the so-called chemical enhancement due to electron transfer between the modified molecules and nanoparticles [
52]. In general, chemical enhancement contributes to SERS enhancement by a minor factor, of about 10 ÷ 10
3.
Even SERS, like any experimental technique, has its limits. One of these is certainly represented by the large fluctuations of the SERS signal, which make reproducible experiments exceedingly difficult. The cause of such fluctuations is primarily the heterogeneity of the SERS substrate which leads to a variable hot-spot density when moving from point-to-point on the substrate surface. Another cause is the position and orientation with which the analyte occupies the hot-spot sites, and even the intermittent contact with the substrate.
This problem becomes particularly important when the number of molecules in the laser spot is greatly reduced, reaching the single molecule regime. In ref. [
53], the authors discuss the phenomenology and statistics of this kind of fluctuation.
The variability of the SERS signal both over time (repeated measurements at the same point) and over space (repeated measurements at different points) has prompted an effort, still in progress, to fabricate SERS substrates as reproducible as possible. Nevertheless, since this aspect cannot be completely eliminated, it is necessary to resort to multivariate statistical techniques, among which principal component analysis (PCA) is the one most widely used. This aspect is particularly significant when complex biological structures are investigated, due to the intrinsic heterogeneity of this type of sample.
Although the hot-spots are extremely localized regions, their position within the area of the focused laser beam remains undetermined; therefore, the SERS technique remains a diffraction-limited technique. In other words, if there was only one molecule in the laser area, we would not be able to say from which hot-spot the SERS signal originates.
This drawback has been solved by a recent technique named tip-enhanced Raman spectroscopy (TERS) [
54,
55,
56,
57,
58]. Tip-enhanced Raman spectroscopy is a combination of the plasmonic amplification, typical of LSPR, with scanning probe microscopy (SPM), such as atomic force microscopy (AFM), or similar microscopies such as scanning-tunneling microscopy (STM). The general idea is to use solid metal tips or dielectric tips coated with nanostructured metal films. The enhancement mechanism is strongly dependent on the geometry and the type of plasmonic material of the probe. By modifying these parameters, it is possible to manipulate the conditions necessary to excite the plasmon resonance modes in the tip apex that contribute to the local field enhancement. When the TERS tip approaches the surface of the sample under investigation and is illuminated by laser radiation, it behaves as a nano-antenna [
59,
60,
61,
62,
63], and a localized nanoscale enhancement of the Raman signals is produced from the portion of the sample placed under the tip [
64,
65].
The near field at the tip apex results significantly amplified for longitudinally polarized far field excitation [
66]. Moreover, when the tip is close to a metallized surface, a much higher gain is achieved in the gap between the tip and the substrate. This configuration, named gap-mode TERS, leads to a further enhancement of ~10
2, which is very useful for most biomolecular applications [
67,
68].
TERS spatial resolution depends on the radius of curvature of the tip, typically varying around 10–20 nm [
69]. However, single-molecule mapping has been published with a higher spatial resolution of 0.5 nm [
70].
For the numerous technical aspects of the TERS technique (illuminating geometries, the role of the polarization, and so on), readers can refer to several exhaustive review articles [
22,
71,
72,
73,
74,
75,
76].
TERS amplification is usually described in terms of the so-called optical contrast (OC), defined as the ratio of near-field (
INF) to far field (
IFF) Raman intensities:
A high contrast value implies a strong plasmonic TERS enhancement at the apex of the tip. The intensity
Itip is the TERS experimentally detected Raman intensity which is superimposed on a large non-enhanced background
I0. In terms of OC, the
EF can be approximated by the relation:
where
AFF =
πw2, with
w being the beam waist, and
ANN ~
πr2, with
r being the tip radius of curvature.
Finally, a common issue which concerns both SERS substrates and TERS tips is their lifetime [
72,
77]. The exposure of these devices to the air or other environments can induce several types of mechanisms (mainly oxidation and contamination by the adsorption of molecules present in the environment) which reduce plasmonic activity and/or produce significant interferences in the final spectra. Thus, many strategies have been proposed both to fabricate high-quality TERS probes and to extend the tip’s lifetime.