During lithium-ion batteries (LIBs) ordinary operation, safety concerns are related to the possibility of overheating and, in extreme cases, to the risk of fire or explosion. Hence, it is crucial to implement proper safety measures in the design, manufacturing, and in the second life of LIBs, through a proper design of thermal management systems or short circuit protection. Regarding their durability, LIBs can face degradation over time due to repeated charge–discharge cycles. This might affect their charge retention capacity and their lifespan. Hence, ongoing research is being conducted to improve these aspects through advancements in materials, electrode design, and battery management systems. LIB development focuses on improving their efficiency by using environmentally friendly materials. The non-destructive testing (NDT) of LIBs can be classified into several categories. The commonly accepted taxonomy is based on their underlying physical principle of measurement, e.g., electromagnetic waves, thermal waves, mechanical waves, etc.
- non-destructive testing
- non-destructive evaluation
- lithium battery
- experimental setup
- state-of-health
- second life usage
- electrochemical impedance spectroscopy
- infrared thermography
- X-ray
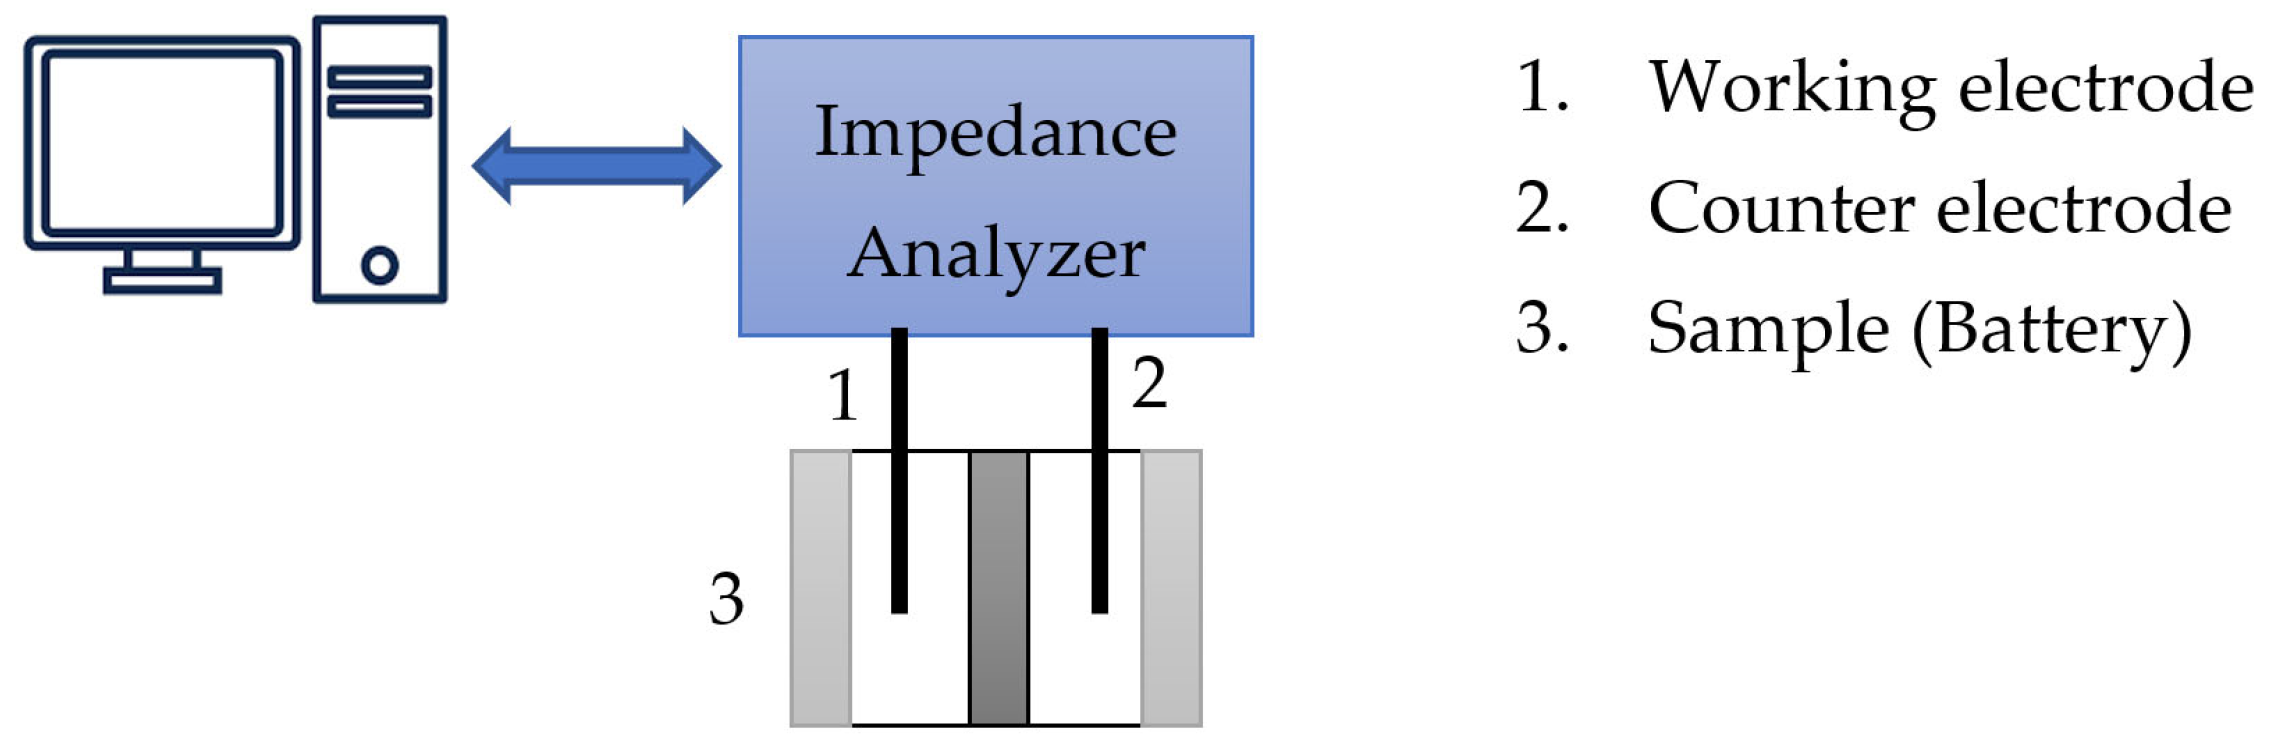
2. Electromechanical Impedance Spectroscopy (EIS)
Related Works
| Refs. | Parameter | Error (%) |
Battery Type |
Experimental Setup |
Characteristics |
|---|---|---|---|---|---|
| [5] | T | <1 | Pouch | Abin Battery Cycler Potentiostat: Gamry Interface 5000P, Pennsylvania, USA MZTC Arbin climate-controlled |
LCO Li-polymer. Real-time estimator. Online acquisition of impedance ECM was used to interpret and analyze the impedance data at each temperature. Sensitivity to temperature. Low sensitivity to SOC and SOH. ECM: Ro − (CPE1//(Rct − W)) |
| [14] | SOH | <1 | Pouch | Electrochemical Workstation (unreported) |
Electrode: LiMnNiCoO2 LiPF6 Recurrent neural networks (RNNs). Model for high energy density dedicated to EVs. ECM: R1 − (R2(SOC)//CPE1) − CPE2 − E(SOC) |
| [15] | SOH | ~5 | Coin | Electrochemical Workstation(unreported) |
Eunicell LR2032. Five different ECMs. Data-driven algorithm with CNN. ECM and IPSO-CNN-BiLSTM ECM: Rohm − Ls − (RSEI//CPE1) − (Rct//CPE2) |
| [16] | RUL | <1 | Coin | Electrochemical Workstation (unreported) |
Eunicell LR2032. LiCoO2/graphit Real-time battery forecasting system. Gaussian process model and ML. Over 20,000 EIS spectra of commercial Li-ion batteries, with different states of health. |
| [17] | SOH | 3.73–8.66 | Pouch | Potentiostat: Gamry Series G300 Keithley 2420 Source Meter Opto-isolated relay board (Devantech RLY816) |
LiPO Performance under load. Used parameters of ECM to reproduce the discharge curves. ECM: Rohm − L − (CPE1//Rct1) − (CPE2//Rct2) − W |
| [18] | SOH | 2 | Cylindrical | Electrochemical Workstation(unreported) |
Commercial Li-ion cells ECM 10 kHz–1 MHz at different SOCs, SOHs, and temperatures. ECM based on the physics of the system. A transmission line model: (L//Ro) − Rc − [Cg//(C1//(R1 + Zd1) − Re − C2//(R2 + Zd2))] |
| [19] | SOH | 1.29–4 | Cylindrical | Boling BLC-300 (battery test incubator) Solartron analytical 1470E NEWARE BTS-5V6A |
Battery model: 18650. Anode: Graphite. Cathode: LiNi0.5C0.2Mn0.3O2 Model-based method. ECM: RΩ − Ls − (CPE1//RSEI) − (CPE2//Rct) |
| [20] | SOH | <1.36 | Coin | Electrochemical Workstation(unreported) |
Eunicell LR2032. Elman NN and cuckoo search (CS-Elman). No building of a circuit model, no consideration of the complex electrochemical reaction. |
| [13] | SOH | <10 before 240 cycles |
Cylindrical | Signal generator V/I converter circuit module (DAQ of NI) |
UR14500P Type: LiCoO2. TDIS (time-domain EIS) based on FFT SOH is established by using BPNN (back-propagation NN) algorithm. ECM: [(Cdln//ZFDn) − Rfilm]//Cfilm − Ro − (Cdlp//ZFDp) |
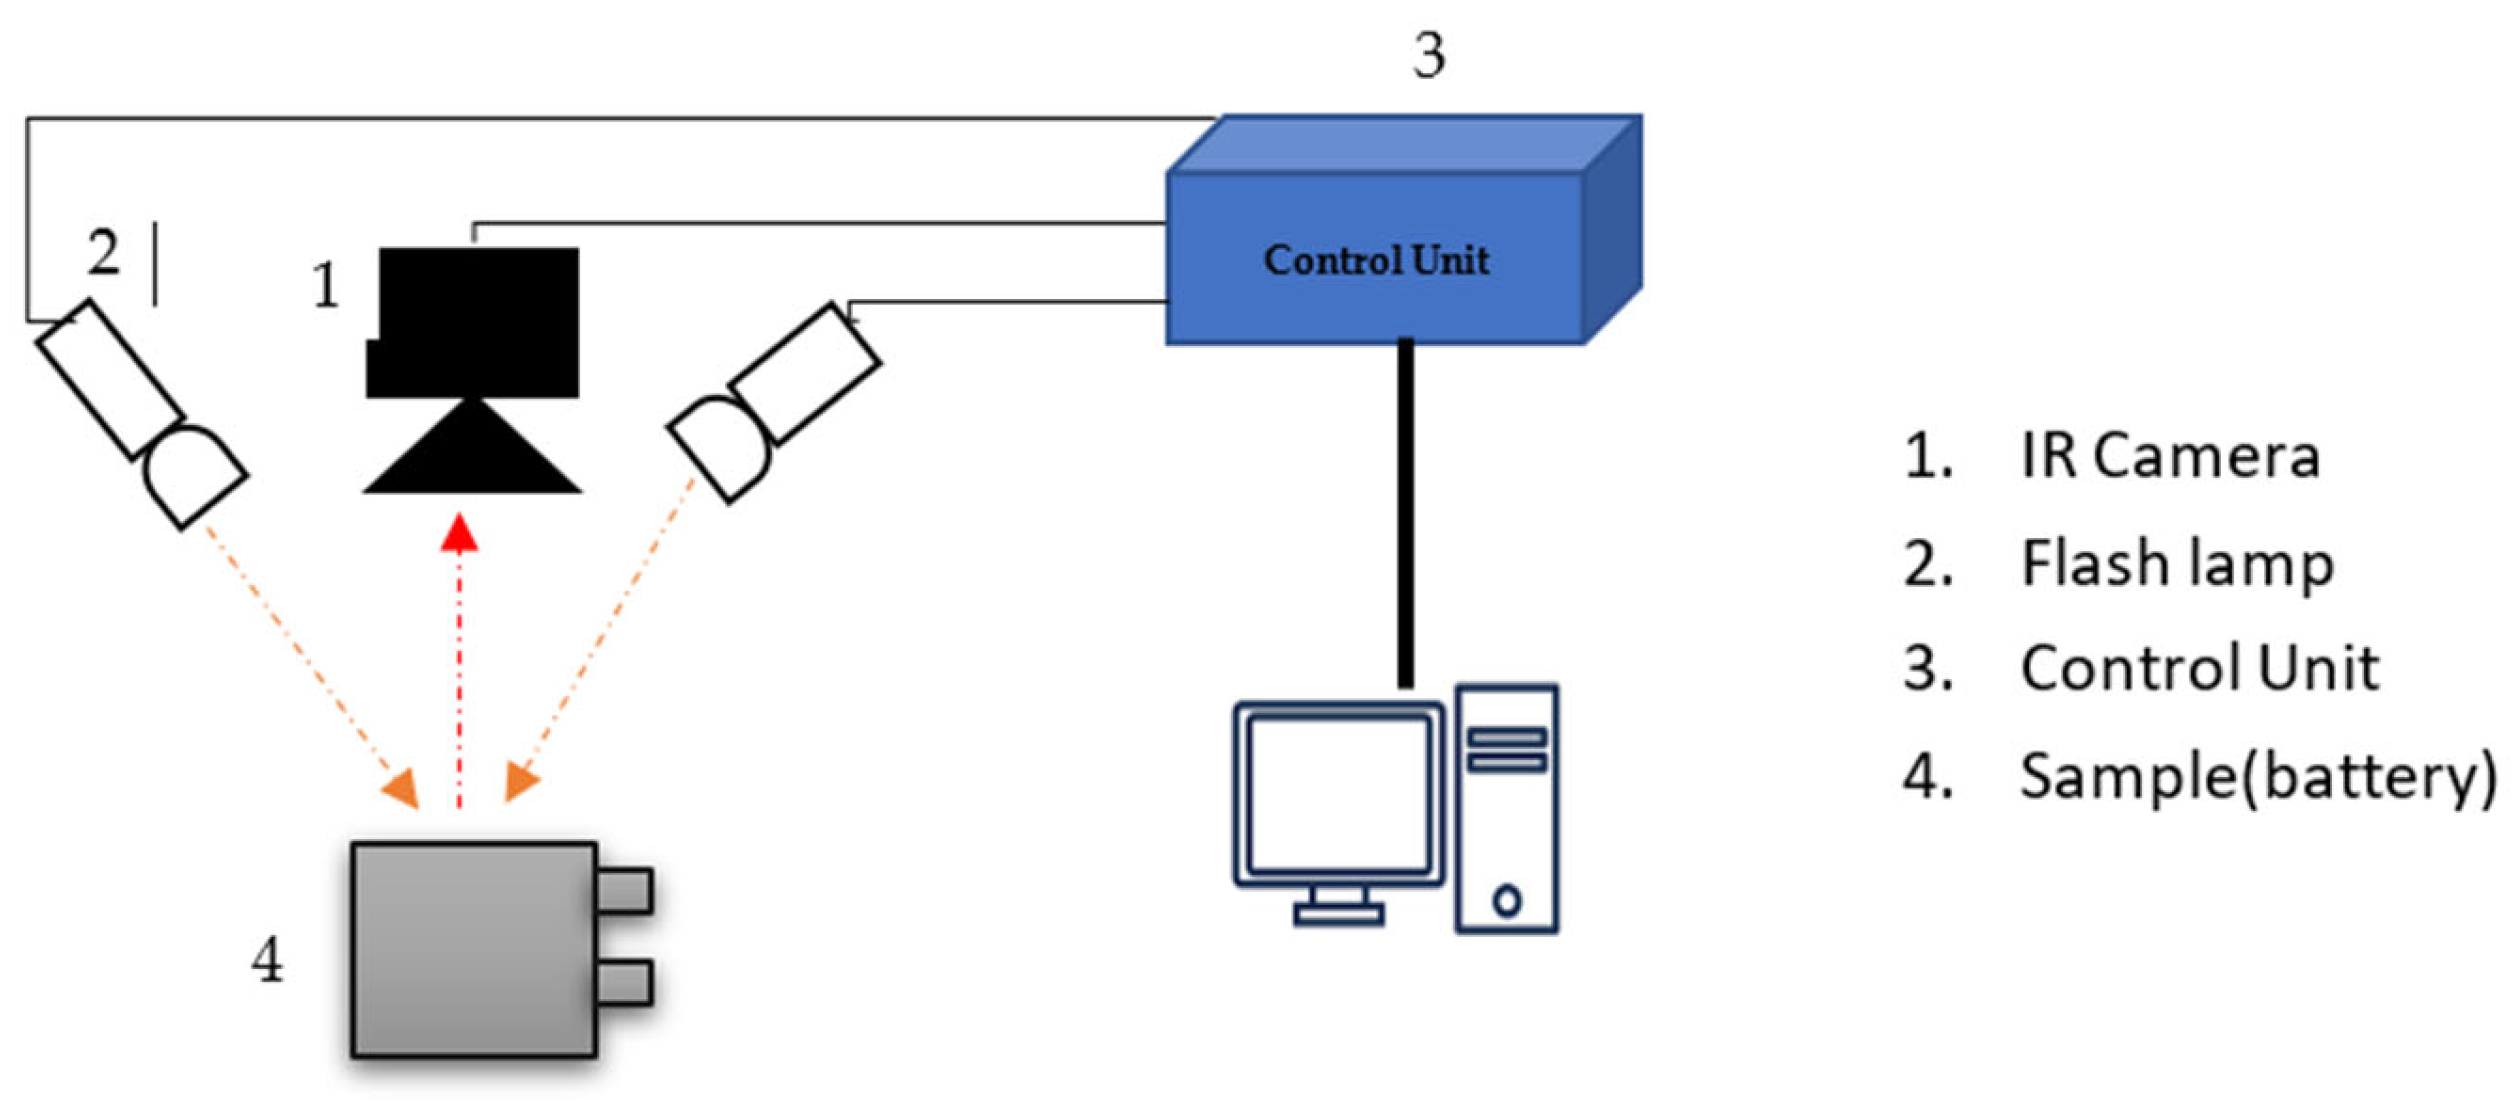
3. Infrared Thermography (IRT)
Related Works
| Refs. | Parameter | Error (%) |
Battery Type |
Experimental Setup |
Characteristics |
|---|---|---|---|---|---|
| [26] | H-generation | <0.1 | Cylindrical | (RMX-4125) programmable power supply (RMX-4005)-DC electronic load NI 6289-data acquisition FLIR SC3000 IR camera thermocouple |
Positive and negative electrodes LiFePO4 and LiC6. Electrolyte LiPF6. IT and thermocouple probe Increase in the thermal power when the battery is subjected to higher discharge currents. Efficiency decreased with higher C-rates. It describes a heat generation model. |
| [27] | Thermal abuse | 1 | Pouch | Li-Polymer battery Infrared camera-FLUKE |
LiFePO4 The security problem lies in thermal control, including the heat-generation and the internal and external heat transfer. |
| [28] | H-generation | 2.6 | Pouch | polyimide film heater FLIR A320-calorimeter |
LiFePO4 Mathematical model (Biot number, LCM) Lumped capacitance model (LCM) and thermography. Not to be applied where the C-rate is 2C or lower. |
| [29] | Surface temperature |
<10% | Pouch LCO |
FLIR E6 thermal imaging camera, thermocouples, humidity sensor black cardboard Applent AT4808 Handheld Multi-channel Temperature Meter |
It compares the surface temperature at different discharging rates by infrared thermography and thermocouple measurements. Temperature rises rapidly at higher discharge rates. |
| [30] | Surface temperature |
<1 | Pouch NMC, LCO, LPF |
NMC-based, LFP, LTO ACT 0550 (80 channels) battery tester (PEC®). NTC 5K thermistor Ti25 thermal imager (FLUKE®) |
Evolution of surface temperature. Non-uniformity of the surface temperature. |
| [31] | Thermal conductivity |
12.2 | Cilindrical 18650 |
Coating (XFNANO) laser (MDL-III-808-2W, CNI) Camera (MAG32MINI, Magnity). |
Negative electrode: Li4Ti5O12 Non-contact steady-state method. Equivalent thermal circuit. |
| [32][33] | Defects | 1 | Coin | FLIR SC-8200 Carl Zeiss Merlin SEM Bruker Nano GmbH using an XFlash 5030 detector Hitachi S3400 SEM |
Positive electrode: LiNi0.5Mn0.3Co0.2O2 Different plausible defects (agglomeration, blisters, pinholes, metal particle contamination, and non-uniform coating). |
| [34] | Detection of gas pockets | 1 | Pouch | PL-565068 infrared camera (FPA InSb FLIRSC5000MB) Potentiostat-IviumStat Current probe-Tektronix A622. Digital acquisition unit-USB 6363 Software-Altair |
It demonstrates the effectiveness in the detection of gas pockets formed during cell aging. |
| [35] | Thermal | 1 | pouch | ThermaCam-SC640 Fluke 867B multimeter TENMA 72-10505 power supply block TENMA 72-13200 electronic load. |
Thermal behavior at different charging and discharging modes. |
| [36] | H-generation | 1 | Pouch | Environmental chamber-(Tenney T10c) IR-camera (T650sc, FLIR) T-type thermocoupleSA1-T infrared (IRW-4C, FLIR) Battery tester-BT2000, Arbin Instruments. |
Cathode: LiNi0.6Co0.2Mn0.2O2, anode: graphite. Suggesting uniform heating. Hotspot is detected at the activation terminal for improvement of SHLB design. SHLB (self-heating of LIB). |
| [37] | Cycle Life (RUL) |
<10% | pouch | MLX90621-infrared sensor array SUNKEE module ACS712 current sensor. N103-voltage sensors |
Combination of infrared thermography and supervised learning techniques. Surface temperature profiles as the input nodes for ANN and SVM models. ANN could estimate the current cycle under 10 min of testing time. |
This entry is adapted from the peer-reviewed paper 10.3390/wevj14110305
References
- Meddings, N.; Heinrich, M.; Overney, F.; Lee, J.-S.; Ruiz, V.; Napolitano, E.; Seitz, S.; Hinds, G.; Raccichini, R.; Gaberscek, M. Application of electrochemical impedance spectroscopy to commercial Li-ion cells: A review. J. Power Sources 2020, 480, 228742.
- Padha, B.; Verma, S.; Mahajan, P.; Arya, S. Electrochemical Impedance Spectroscopy (EIS) Performance Analysis and Challenges in Fuel Cell Applications. J. Electrochem. Sci. Technol. 2022, 13, 167–176.
- Lazanas, A.C.; Prodromidis, M.I. Electrochemical Impedance Spectroscopy—A Tutorial. ACS Meas. Sci. Au 2023, 3, 162–193.
- Hogg, B.-I.; Waldmann, T.; Wohlfahrt-Mehrens, M. 4-Electrode Full Cells for Operando Li+ Activity Measurements and Prevention of Li Deposition in Li-Ion Cells. J. Electrochem. Soc. 2020, 167, 090525.
- Carthy, K.; Gullapalli, H.; Kennedy, T. Real-time internal temperature estimation of commercial Li-ion batteries using online impedance measurements. J. Power Sources 2022, 519, 230786.
- Zheng, Y.; Shi, Z.; Guo, D.; Dai, H.; Han, X. A simplification of the time-domain equivalent circuit model for lithium-ion batteries based on low-frequency electrochemical impedance spectra. J. Power Sources 2021, 489, 229505.
- Fernández Pulido, Y.; Blanco, C.; Anseán, D.; García, V.M.; Ferrero, F.; Valledor, M. Determination of suitable parameters for battery analysis by Electrochemical Impedance Spectroscopy. Measurement 2017, 106, 1–11.
- Andre, D.; Meiler, M.; Steiner, K.; Walz, H.; Soczka-Guth, T.; Sauer, D.U. Characterization of high-power lithium-ion batteries by electrochemical impedance spectroscopy. II: Modelling. J. Power Sources 2011, 196, 5349–5356.
- Habte, B.T.; Jiang, F. Effect of microstructure morphology on Li-ion battery graphite anode performance: Electrochemical impedance spectroscopy modeling and analysis. Solid State Ionics 2018, 314, 81–91.
- Westerhoff, U.; Kurbach, K.; Lienesch, F.; Kurrat, M. Analysis of Lithium-Ion Battery Models Based on Electrochemical Impedance Spectroscopy. Energy Technol. 2016, 4, 1620–1630.
- Li, D.; Wang, L.; Duan, C.; Li, Q.; Wang, K. Temperature prediction of lithium-ion batteries based on electrochemical impedance spectrum: A review. Int. J. Energy Res. 2022, 46, 10372–10388.
- Choi, W.; Shin, H.C.; Kim, J.M.; Choi, J.Y.; Yoon, W.S. Modeling and applications of electrochemical impedance spectroscopy (Eis) for lithium-ion batteries. J. Electrochem. Sci. Technol. 2020, 11, 1–13.
- Lyu, C.; Zhang, T.; Luo, W.; Wei, G.; Ma, B.; Wang, L. SOH Estimation of Lithium-ion Batteries Based on Fast Time Domain Impedance Spectroscopy. In Proceedings of the 2019 14th IEEE Conference on Industrial Electronics and Applications (ICIEA), Xi’an, China, 19–21 June 2019; pp. 2142–2147.
- Eddahech, A.; Briat, O.; Bertrand, N.; Delétage, J.-Y.; Vinassa, J.-M. Behavior and state-of-health monitoring of Li-ion batteries using impedance spectroscopy and recurrent neural networks. Int. J. Electr. Power Energy Syst. 2012, 42, 487–494.
- Li, D.; Yang, D.; Li, L.; Wang, L.; Wang, K. Electrochemical Impedance Spectroscopy Based on the State of Health Estimation for Lithium-Ion Batteries. Energies 2022, 15, 6665.
- Zhang, Y.; Tang, Q.; Zhang, Y.; Wang, J.; Stimming, U.; Lee, A.A. Identifying degradation patterns of lithium ion batteries from impedance spectroscopy using machine learning. Nat. Commun. 2020, 11, 1706.
- Galeotti, M.; Ciná, L.; Giammanco, C.; Cordiner, S. Performance analysis and SOH (state of health) evaluation of lithium polymer batteries through electrochemic. Energy 2015, 89, 678–686.
- Ezpeleta, I.; Freire, L.; Mateo-Mateo, C.; Nóvoa, X.R.; Pintos, A.; Valverde-Pérez, S. Characterisation of Commercial Li-Ion Batteries Using Electrochemical Impedance Spectroscopy. ChemistrySelect 2022, 7, e202104464.
- Zhang, Q.; Huang, C.G.; Li, H.; Feng, G.; Peng, W. Electrochemical Impedance Spectroscopy Based State-of-Health Estimation for Lithium-Ion Battery Considering Temperature and State-of-Charge Effect. IEEE Trans. Transp. Electrif. 2022, 8, 4633–4645.
- Chang, C.; Wang, S.; Jiang, J.; Gao, Y.; Jiang, Y.; Liao, L. Lithium-Ion Battery State of Health Estimation Based on Electrochemical Impedance Spectroscopy and Cuckoo Search Algorithm Optimized Elman Neural Network. J. Electrochem. Energy Convers. Storage 2022, 19, 030912.
- Alfredo Osornio-Rios, R.; Antonino-Daviu, J.A.; De Jesus Romero-Troncoso, R. Recent industrial applications of infrared thermography: A review. IEEE Trans. Ind. Inf. 2019, 15, 615–625.
- Hou, F.; Zhang, Y.; Zhou, Y.; Zhang, M.; Lv, B.; Wu, J. Review on Infrared Imaging Technology. Sustainability 2022, 14, 11161.
- Balakrishnan, G.K.; Yaw, C.T.; Koh, S.P.; Abedin, T.; Raj, A.A.; Tiong, S.K.; Chen, C.P. A Review of Infrared Thermography for Condition-Based Monitoring in Electrical Energy: Applications and Recommendations. Energies 2022, 15, 6000.
- Usamentiaga, R.; Venegas, P.; Guerediaga, J.; Vega, L.; Molleda, J.; Bulnes, F. Infrared Thermography for Temperature Measurement and Non-Destructive Testing. Sensors 2014, 14, 12305–12348.
- Pesaran, A.A.; Burch, S.D. Thermal Performance of EV and HEV Battery Modules and Packs Prepared under FWP HV71; National Renewable Energy Laboratory: Golden, CO, USA, 1997; p. 997.
- Giammichele, L.; D’Alessandro, V.; Falone, M.; Ricci, R. Thermal behaviour assessment and electrical characterisation of a cylindrical Lithium-ion battery using infrared thermography. Appl. Thermal Eng. 2022, 205, 117974.
- Wang, Z.-j.; Li, Z.-q.; Liu, Q. Infrared thermography non-destructive evaluation of lithium-ion battery. In International Symposium on Photoelectronic Detection and Imaging 2011: Advances in Infrared Imaging and Applications; SPIE: Beijing, China, 2011; pp. 1237–1244.
- Bazinsky, S.J.; Wang, X. Predicting heat generation in a lithium-ion pouch cell through thermography and the lumped capacitance model. J. Power Sorces 2016, 305, 97–105.
- Rani, M.F.H.; Razlan, Z.M.; Shahriman, A.B.; Ibrahim, Z.; Wan, W.K. Comparative study of surface temperature of lithium-ion polymer cells at different discharging rates by infrared thermography and thermocouple. Int. J. Heat Mass Transf. 2020, 153, 119595.
- Goutam, S.; Timmermans, J.M.; Omar, N.; Van den Bossche, P.; Van Mierlo, J. Comparative study of surface temperature behavior of commercial li-ion pouch cells of different chemistries and capacities by infrared thermography. Energies 2015, 8, 8175–8192.
- Liu, Y.; Xu, S.; Wang, Y.; Dong, H. Non-contact Steady-State Thermal Characterization of Lithium-Ion Battery Plates Using Infrared Thermography. Int. J. Thermophys. 2022, 43, 131.
- Mohanty, D.; Hockaday, E.; Hensley, D.K.; Daniel, C.; Wood, I.D. Effect of electrode manufacturing defects on electrochemical performance of lithium-ion batteries. J. Power Sources 2016, 312, 70–79.
- Mohanty, D.; Li, J.; Born, R.; Maxey, L.C.; Dinwiddie, R.B.; Daniel, C.; Wood, D.L. Non-destructive evaluation of slot-die-coated lithium secondary battery electrodes by in-line laser caliper and IR thermography methods. Anal. Methods 2014, 6, 674–683.
- Robinson, J.B.; Engebretsen, E.; Finegan, D.P.; Darr, J.; Hinds, G.; Shearing, P.R.; Brett, D.J.L. Detection of internal defects in lithium-ion batteries using lock-in thermography. ECS Electrochem. Lett. 2015, 4, A106–A109.
- Stoynova, A.; Bonev, B.; Rizanov, S. Thermographic Study of Thermal Processes during Battery Charging and Discharging. In Proceedings of the 2021 44th International Spring Seminar on Electronics Technology (ISSE), Bautzen, Germany, 5–9 May 2021.
- Zhang, G.; Tian, H.; Ge, S.; Marple, D.; Sun, F.; Wang, C.-Y. Visualization of self-heating of an all climate battery by infrared thermography. J. Power Sources 2018, 376, 111–116.
- Zhou, X.; Hsieh, S.-J.; Peng, B.; Hsieh, D. Cycle life estimation of lithium-ion polymer batteries using artificial neural network and support vector. Microelectron. Reabil. 2017, 79, 48–58.