Your browser does not fully support modern features. Please upgrade for a smoother experience.
Please note this is an old version of this entry, which may differ significantly from the current revision.
Subjects:
Computer Science, Theory & Methods
The volume of multimedia assets in collections is growing exponentially, and the retrieval of information is becoming more complex. The indexing and retrieval of multimedia content is generally implemented by employing feature graphs. Feature graphs contain semantic information on multimedia assets. Machine learning can produce detailed semantic information on multimedia assets, reflected in a high volume of nodes and edges in the feature graphs. Graph Codes provide fast and effective multimedia indexing and retrieval, even in billion-scale use cases.
- semantic
- multimedia
- feature graph
- Graph Code
1. Introduction
Whether in social networks, media, or medicine, many industries collect and process a growing volume of multimedia content objects (i.e., representations of real-world scenes, such as videos, images, textual descriptions, audio recordings, or combined objects). Statista [1] describes an increase in the volume of photos taken with a smartphone, from 660 billion in 2013 to 1.2 trillion in 2017. When comparing the volume of titles on video streaming services from fall 2021 [2] and summer 2022 [3], annual growth can be observed. Research data sets grow with similar rates, as the National Library of Medicine shows. Founded as Open-i in 2012 with 600,000 [4] assets, the collection grew to 1.2 million in 2022 [5]. Similar rates are shown in Figure 1; in one minute on the Internet [6], 695,000 Instagram [7] stories are shared, 500 hours of YouTube [8] content is uploaded, and 197 million emails are sent.
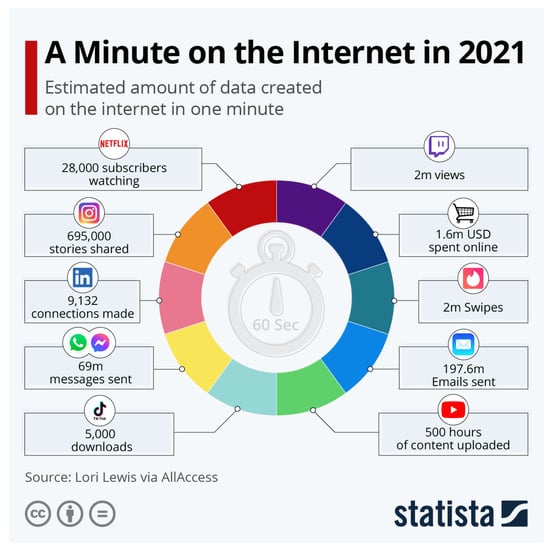
Figure 1. A Minute on the Internet in 2021 [6].
Mechanisms for the efficient indexing and fast retrieval of these multimedia content objects are essential to manage this large volume of information. Cloud computing [9] and big data technologies [10] enable the storage and processing of these amounts of multimedia content objects. Recent improvements in machine [11] learning, such as deep learning [12], enabled the automated extraction of features from the raw multimedia content object by employing object recognition [13], face identification, and further methods. The increasingly high resolution in multimedia content objects, such as 32-bit audio recording, 8K video recording, and 200-megapixel smartphone cameras, allows the extraction of features with a high level of detail (LOD) from the content of multimedia content objects. All this extracted feature information can be efficiently organized and indexed by graph-based technologies. Evaluations showed that they are fast and effective technologies for Multimedia Information Retrieval (MMIR) [15] and that Graph Codes can perform better as graph databases. According to [16], the acceptable response time for users is around one second. However, information retrieval in large multimedia collections and a high LOD still result in processing times above the margin of one second. Previous experiments show a potential speedup of the execution times of the Graph Code algorithm through the parallelization of Graph Code algorithms. One of the remaining research questions is how to efficiently parallelize Graph Code algorithms and whether this can lead to a speedup.
2. Information Retrieval
Information retrieval [19] aims to find information in large information collections. Multimedia Information Retrieval particularly targets collections with image, video, text, or audio assets (i.e., multimedia content objects). MMIR systems are designed to support these use cases. To search for information, the main component is a search engine. The search engine has an information database containing the list of multimedia assets in the collection and also an index of them. The index contains metadata about the assets. Semantic metadata connect the features and make them machine processable. Metadata can be supplied or generated by feature extraction. In order to organize features, graph-based methodologies and structures are frequently employed, given that feature information relies on information nodes and the connections that exist between these nodes [20].
3. Multimedia Features and Multimedia Feature Graphs
The Multimedia Feature Graph (MMFG) [21] is a weighted and directed graph [22], whose nodes and edges represent features of multimedia assets. The Generic Multimedia Annotation Framework (GMAF) [23] is an MMIR system for multimedia assets that uses MMFGs as an index and access method. GMAF provides a flexible plugin architecture that allows the processing of various multimedia asset types to extract features that are stored as metadata in the MMFG. The extracted features are contributed to the MMFG, which can be further processed. Extensions of MMFGs have led to semantic analysis, such as Semantic Multimedia Feature Graphs (SMMFGs) and Explainable SMMFGs (ESMMFGs) [24]. Despite these extensions, the graph-based structure of MMFGs remains and can lead to slow processing times. When the LOD of the assets increases, the number of elements in the MMFG also increases, which further increases the processing times. To address this, Graph Codes were introduced for faster indexing [14]. Therefore, it is important to experiment with an improved processing model to reduce processing times. This is outlined in the next subsection.
4. Graph Codes and Algorithms
Graph Codes [14,25] are a 2D transformation of a multimedia feature graph that is encoded using adjacency matrix operations [26]. GCs have been shown to be more efficient for similarity and recommendation searches than graph-traversal-based algorithms. Graph Codes represent the labels of feature graph nodes and edges in the form of vocabulary terms. Based on the adjacency matrix of such a feature graph, these are used as row and column indices. The elements of the matrix represent the relationships between the vocabulary terms. The type of the edge in the graph is encoded as the value of the matrix element. Figure 2 illustrates a simple example of a multimedia feature graph (see Figure 2a), a detailed section from the graph (Figure 2b), its corresponding GC in a table representation (Figure 2c), and the GC matrix 𝐺𝐶𝑒𝑥 (Figure 2d).
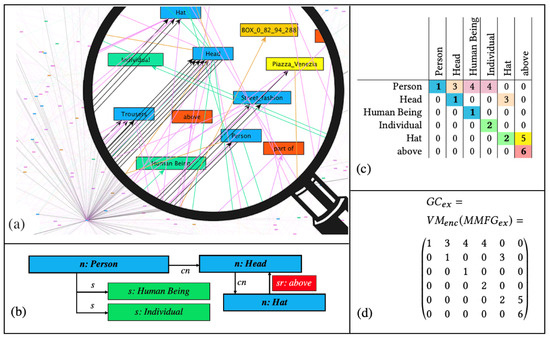
Figure 2. Multimedia features represented as a Graph Code index (a–d) [27].
GCs contain a dictionary 𝑑𝑖𝑐𝑡𝐺𝐶 of feature vocabulary terms (𝐹𝑉𝑇) and represent the relationships between these terms using the matrix field 𝑚𝑖,𝑗. A similarity metric triple 𝑀𝐺𝐶=(𝑀𝐹,𝑀𝐹𝑅,𝑀𝑅𝑇) has been defined for GCs. The feature metric 𝑀𝐹 is based on the vocabulary, the feature relationship metric 𝑀𝐹𝑅 is based on the possible relationships, and the feature relationship type metric 𝑀𝑅𝑇 is based on the actual relationship types.
Semantic Graph Codes (SGCs) [23] are an extension of GCs that incorporate additional semantic structures using annotation with semantic systems such as RDF, RDFS, ontologies, or Knowledge Organization Systems [28,29,30]. This additional semantic information can help to bridge the semantic gap between the technical representations of multimedia feature graphs and their human-understandable meanings.
With the introduction of semantics to the MMFGs in [24], the researchers introduced additional metrics to improve the efficiency and effectiveness of Graph Codes for MMIR. First, the feature discrimination 𝑀𝐷𝐼𝑆 is defined as the difference in the number of nonzero Graph Code fields for two feature vocabulary terms of a given Graph Code or Semantic Graph Code. TFIDF [31] is a numerical statistic used in natural language processing to evaluate the importance of a word in a document. An adapted TFIDF measure for Graph Codes can use 𝑀𝐷𝐼𝑆 to reveal how representative a term is for a single document—in this case, an SGC. The Semantic Graph Code collection corresponds to the TFIDF documents. With 𝑀𝑅𝐸𝐿, it can be used to define a threshold for a collection to exclude less relevant features from the retrieval process. Alternatively, 𝑀𝑅𝐸𝐿 can be used to weight terms according to the use case. This requires the pre-processing of the Graph Codes by removing the non-relevant vocabulary terms. This step needs to be performed when the relevance threshold is changed, or whenever a multimedia content object is added to or removed from the collection.
Introduced in [14], the basic algorithm for the comparison and order of Graph Codes in a collection is listed in pseudocode below.
for each GC in collection
--- parallelize ---
calculate the intersection matrices
of GC_Query and~GC
--- parallelize each ---
calculate M_F of GC_Query and GC
calculate M_FR of GC_Query and GC
calculate M_RT of GC_Query and GC
--- end parallelize each ---
compare
--- end parallelize~---
order result list according to
value of M_F
value of M_FR where M_F is equal
value of M_RT where M_F and M_FR are equal
return result list
Experiments with a proof-of-concept (POC) implementation of the algorithm showed that parallel instances can process individual parts of a Graph Code collection in less time on multicore CPUs compared to a single instance. Compared to a single instance with an execution time of 635 s, 16 instances could process the same volume of data in 65 s [32].
5. Parallel Computing
The scaling of algorithm processing can either be achieved by higher-performance computing resources or by executing parts of the algorithm in parallel. Higher performance is usually an upgrade of hardware, which is called vertical scaling. Parallel computing can be achieved in many ways. In a single computer, multiple processing units can exist in the form of multicore Central Processing Units (CPUs) [33] or coprocessors such as Graphics Processing Units (GPUs) [17] or Field-Programmable Gate Arrays (FPGAs) [34]. While multicore CPUs work in Multi-Instructions Multiple Data (MIMD) [35] fashion, GPUs usually work in a Single-Instruction Multiple Data (SIMD) [35] method. Although MIMD is suitable for general purpose computing, it is limited for massive parallelization [36] (p. 181). SIMD is optimal for massive parallelization, but only in cases where the same instructions are being applied to the data. Both concepts can be found in modern processors, e.g., Apple M-series [37] and A-series [38], Nvidia G200 [36] (p. xii), CPU AVX extension [39]. Additionally, systems can contain multiple processing units, such as multi GPUs. State-of-the-art approaches [40,41,42] mainly apply GPUs for performance improvements.
Another option for in-system parallelization is distributed computing. Instead of spreading the operations on the data to different processing units in the system, the data and the instructions are distributed to many systems. This is called horizontal scaling. Many frameworks are available to support coordination in distributed computing. Frameworks such as Hadoop [18] or TensorFlow [43] can be used to coordinate parallel execution on large clusters of computers.
On a high level, a task to parallelize can be classified as Task-Level Parallelization (TLP) [33] or Data-Level Parallelization (DLP) [33]. While tasks in TLP can be general purpose and very different from each other, in DLP, the same operation is applied to different data, similar to a matrix multiplication. Given Flynn’s taxonomy [35], for the parallel computation of multiple data, SIMD or MIMD processors can be used. TLP works well with MIMD processors, while, for DLP, SIMD processors are more suitable. As mentioned above, modern processors cannot simply be categorized as SIMD or MIMD, because they often have features of both categories. Multi-Core CPUs such as an Intel i9 [39] work as MIMD but have SIMD extensions such as AVX. GPUs operate as SIMD, but Nvidia CUDA [44] GPUs can also operate as MIMD. Hence, a detailed analysis is needed to find the most suitable processor for a certain task.
To take advantage of the potential for parallel computing, applications and algorithms need to be modified. The method of algorithm decomposition [45] (p. 95) can be applied to identify sections that can run in parallel. Recursive decomposition searches for options for a divide-and-conquer approach. Data decomposition looks for parts of the algorithm that apply the same operation to parts of the data to be processed. Further techniques exist, and they can be applied in hybrid. The result of the algorithm decomposition is a Task Dependency Graph (TDG). A TDG is a directed acyclic graph that signifies the execution process of a task-oriented application. In this graph, the algorithm’s tasks are depicted as nodes, while edges symbolize the interdependencies among tasks. This relationship denotes that a task can only commence its execution once its preceding tasks, represented by incoming edges, have been successfully completed. The TDG can be used to organize an algorithm for the targeted system.
According to [46], the efficiency gain of parallel executions is defined as the speedup S, which is the ratio of the sequential execution time 𝑡𝑠 and the execution time on n processors 𝑡𝑝:

Amdahl’s [47] and Gustafson’s [48] laws can be used to calculate the theoretical speedup, based on the fractions of the program, which can be parallelized or not, and the number of execution units. According to Gustafson’s law, the speedup S on 10 cores N would be 9.19.1.

However, the following decomposition of the algorithm to calculate and order the Graph Code metrics will produce a TDG. The characteristics of the tasks can indicate which execution model provides the best acceleration yields.
This entry is adapted from the peer-reviewed paper 10.3390/bdcc7020070
This entry is offline, you can click here to edit this entry!