Your browser does not fully support modern features. Please upgrade for a smoother experience.
Please note this is an old version of this entry, which may differ significantly from the current revision.
Subjects:
Astronomy & Astrophysics
An extraordinary component of this mission is the “Lunar Regolith Penetrating Radar” (LRPR) housed within its lander, which currently stands as the most advanced payload in terms of vertical resolution among all penetrating radars employed in lunar exploration.
- CE-5 mission
- lunar regolith
- dielectric properties
- lunar radar detection
- the Moon
1. Introduction
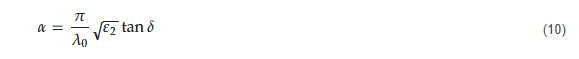
As the third phase, the CE-5 mission is part of the program of China’s lunar exploration, characterized by the sequential “orbit (the CE-1 and CE-2 mission [1,2,3]), land (the CE-3 mission and CE-4 [4,5,6,7]), and return (the CE-5 mission and future CE-6 mission [8,9,10,11,12])” strategy. In the year 2020, China achieved a significant triumph by flawlessly executing the landing of the CE-5 within the Mons Rumker region on the lunar’s near side (see Figure 1, [13]). The CE-5 mission achieved its objective, safely bringing back a substantial cache of 1731 g of collected lunar samples to Earth [14,15,16,17]. This mission gives a precious opportunity for scientists to answer many unresolved questions about the formation and evolution of the Moon’s surface and the physical properties of the lunar regolith [11,18,19,20,21,22,23,24,25,26]. This landmark achievement underscores the resounding success of the initial three stages constituting China’s lunar exploration endeavor. In 2021, the China National Space Administration (CNSA) announced the approval of the fourth phase of the program of China’s lunar exploration, which is expected to establish an international lunar base on the Moon around the year 2028. Currently, three years have passed since the successful launch of the CE-5 mission, and scientists have made significant scientific achievements using the lunar samples and payloads carried by the CE-5 spacecraft [11,23,27,28,29,30,31,32,33]. Notably, the radar instrument onboard the CE-5 lander has been utilized to assist in the drilling process for drilling lunar samples [17,23]. Additionally, the LRPR represents the first deployment of an array antenna with high precision for observing the shallow lunar regolith structure [23,34,35].
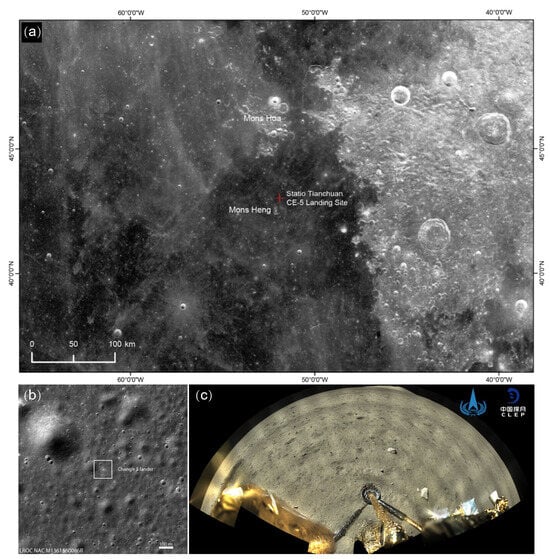
Figure 1. The morphological context of the CE-5 landing site (adopted from Li et al. [13]), and CLEP stands for China’s Lunar Exploration Project. (a) The comprehensive geological information was obtained through the Digital Orthophoto Map (DOM) from CE-2, and the position of the CE-5 lander is indicated by a red cross. (b) The Landing camera of CE-5 provided the image of the landing location, and the CE-5 lander is inside the white box. (c) Topographic map captured by panoramic camera of the CE-5.
To precisely investigate the internal structure of the shallow subsurface of the lunar down to a depth of around ∼3 m is the main scientific goal of the LRPR that the CE-5 lander carried [23,34,35]. In the lunar case, a layer of loose regolith material covers the shallow subsurface [36]. Its regolith is the product of space weathering and meteoroid impacts on its surface [36], and its thickness varies across the Moon, often being about ∼5 m in mare region and up to ∼10 m in highland regions [37,38,39]. According to earlier research, the interior of the shallow regolith is made up mostly of fine-grained type of regolith, and mixed with some rock fragments from ejecta [7,40,41,42,43]. The amount of rock fragments in the shallow regolith relies on the maturity of the local regolith and is closely correlated with the geological age of the surface in the area [44]. Generally, the lunar geological units with older geological ages exhibit higher regolith maturity and lower rock fragments [44]. Optical methods (e.g., spectrum and camera) lack penetrative capabilities, making radar a primary tool for investigating the shallow regolith’s internal structure [6,45,46]. The depth of the deepest drilling core collected during the Apollo 17 mission was about ∼3 m [47], although the detection area of the drilling core is constrained. Drilling samples have been utilized to explore the lunar regolith’s internal structure [48,49,50]. Therefore, it can be said that in-situ radar is a potent instrument for subsurface investigation [7,40,41,51,52,53]. The CE-3 was the first mission to deploy a ground-penetrating radar for lunar surface exploration, with its high-frequency radar achieving a resolution of 0.3 m within the lunar regolith [5,51,54], and the CE-5 radar has a resolution of ∼5 cm within the lunar regolith [34,35]. The basic parameters of the CE-3 and CE-5 radars can be found in detail in Table 1. Therefore, the radar on CE-5 can disclose more precise structural data on the shallow level of the subsurface.
3. Lunar Regolith Penetrating Radar (LRPR)
3.1. Concise Description of the CE-5 Radar System
The CE-5 lander’s LRPR is a time-domain pulsed radar designed for subsurface detection on the Moon [34,35]. The CE-5 radar employs a time-domain technology rather than a frequency-domain technology, primarily due to the well-established and engineering-friendly nature of time-domain radar technology. Furthermore, it has already been successfully applied in the earlier CE-3 and CE-4 missions. While frequency-domain radar offers higher resolution and greater penetration capabilities compared to time-domain radar [72,73], the design of its radar system is more complex, and its system stability is inferior to that of time-domain radar. Generally, the preference for payload design tends to favor mature technology and stable systems in lunar exploration.
For the first time in history, antenna array radar has been used for lunar exploration and subsurface investigation [55]. It consists of 12 irregularly arranged butterfly antennas (Figure 3), and it works between the frequencies of 1–3 GHz (for detailed parameters, refer to Table 1). The LRPR’s basic operating concept is as follows [12,34,35,55]: one antenna emits an ultra-wideband carrier-free picoseconds pulse signal towards the lunar surface, generating electromagnetic waves that penetrate the lunar regolith. Simultaneously, the other 11 antennas receive signals reflected from points or surfaces with different electromagnetic properties in the surrounding medium.
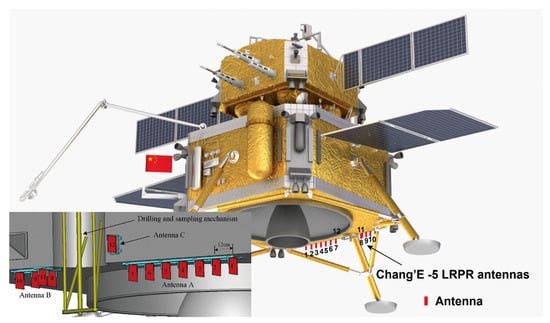
Figure 3. Layout diagram of LRPR radar antenna array, adopted form Ding et al. [11]. The inset image in the lower left corner represents the antennas’ position, with the typical spacing between antennas being 12 cm.
A total of 132 data traces with a time window of 55 ns and a time sampling interval of 18.3 ps are produced and received by the 12 antennas [34]. When stationary, the LRPR can transmit data on the surface to the subsurface depth of ∼2 m [23,74,75]. Through the analysis of the radar dataset, imaging of the drilling area can be achieved, providing valuable information support for drilling and sampling collection [23,35].
The main objective of the radar carried on the CE-5 lander is to assist in drilling and sampling activities, providing real-time observations of the subsurface conditions of the lunar regolith. Another scientific goal is to investigate the fine structure of the lunar regolith. The radar is designed to be positioned on the bottom of the lander and is not capable of mobility. Its detection range in the horizontal direction is limited to 1.5 m. The CE-5’s radar characteristics are different from those of its forerunners, e.g., the CE-3 & CE-4 radars (Table 1). The CE-5 radar operates at a higher frequency (e.g., 2 GHz), whereas the high-frequency radar frequencies of CE-3 and CE-4 are at 500 MHz. This higher frequency allows CE-5 radar to achieve a higher vertical resolution (e.g., 5 cm in lunar regolith), compared to the corresponding performance of 0.3 m for CE-3 and CE-4 high-frequency radar [7,34,54]. However, the penetration depth of the CE-5 radar is not as deep as that of the CE-3 and CE-4. This difference in frequency design is related to their respective scientific objectives. To aid in drilling regolith cores of the lunar, the CE-5 mission has been launched, providing detailed interpretations of the shallow internal structure of the lunar regolith [23,34]. In contrast to the high-frequency LRPR radar used in CE-5, the Lunar Penetrating Radar (LPR) carried by CE-3 and CE-4 operates at relatively lower frequencies to perform penetrating observations [5,76,77]. The LPR is a surface penetrating radar that works in the time domain [54], and the LPR radar consists of two detection channels. The first channel is called “CH1” and operates between 40 and 80 MHz, having capabilities to penetrate the subsurface depth of many ∼100 m with high vertical resolution [40,54,70]. Along the rover’s route, this channel is utilized to identify the crust structure of the lunar at a shallow level. The second channel is called “CH2” and operates between 250–750 MHz [54]. Its vertical resolution is about <30 cm and its penetration depth is around 50 m [78]. Along the Yutu rover’s course of travel, this channel is utilized to investigate the structure thickness of the regolith of the Moon [7,51].
3.2. Preprocessing of Radar Data
The LRPR radar undergoes several preprocessing steps before radar data imaging, as detailed including [79]:
-
Sample time calibration: This procedure is conducted to rectify any irregularities in the sampling interval, ensuring uniformity. The sampling time intervals at the instrument level are not constant. Therefore, it is needed to access the sampling time axis data to calibrate the radar observation. The sampling time axis data represents the actual sampling times of each sampling point when the LRPR acquires a scientific dataset. This data is obtained through ground calibration experiments. The actual scientific data’s time axis data can be obtained by using the parameter “sampling start position” to look up the actual sampling time for each point within the sampling time axis data.
-
Bandpass filtering: This step is employed to effectively eliminate system noise and direct current components.
-
Delay correction: LRPR employs a single transmitter and a single receiver, and different channels are switched using a switching matrix, resulting in varying delays in different channels. Delay correction is performed to address this issue.
-
Background removal: The signals emitted by the antenna undergo multiple couplings/reflections between the antenna and the lander, generating interference in the form of clutter that severely affects the imaging of underground targets. This step aims to remove such background noise.
Once the preprocessing is completed, radar imaging can be carried out to obtain radar images with reduced interference and improve the quality of the radar image.
3.3. Calibration or Ground Validation
The ground experiment is a crucial step in evaluating the radar detection capability and imaging algorithms. Before the CE-5 radar was launched, Xiao et al. [34] and Li et al. [35] conducted extensive ground validation experiments. Figure 4a illustrates a full-scale model of a CE-5 lander equipped with the LRPR (shown in Figure 4b. The LRPR is positioned at the lower section of the lander, approximately 0.89 m above the lunar surface [34]. Directly below the model is a concrete pool (shown in Figure 4c) filled with simulated lunar regolith material made from volcanic ash [34]. The measured dimensions of the pool are depth, width, and length are 2.5 m, 3 m, and 7 m respectively. It contains buried target objects, such as metal spheres, square plastic plates, and irregularly shaped basalt rocks (shown in Figure 4e) [35].
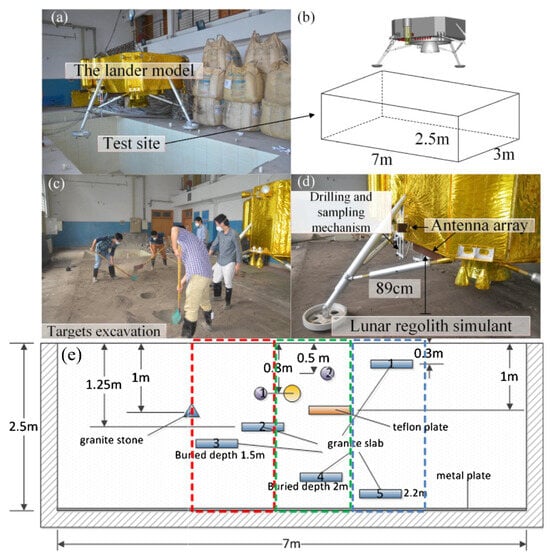
Figure 4. Experimental site and conditions for ground verification of CE-5 LRPR (modified from Xiao et al. [34], Li et al. [35]). (a) The LRPR carried by the lander model. (b) The structure of the test site. (c) Targets excavation. (d) The LRPR deployed on the lunar regolith simulant. (e) The location of the buried targets within the lunar regolith simulant.
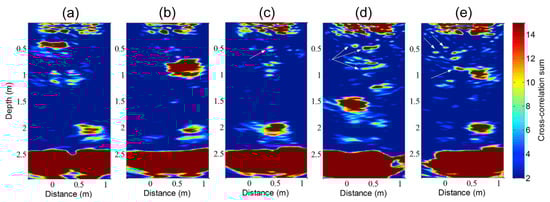
Five ground measurement experiments were conducted by burying different target objects. The background of the surface echoes was also obtained in the experiment by measuring the surface of the simulation layer covered with the material absorbing the electromagnetic waves [79]. The results of radar images after different processing methods are shown in Figure 5.
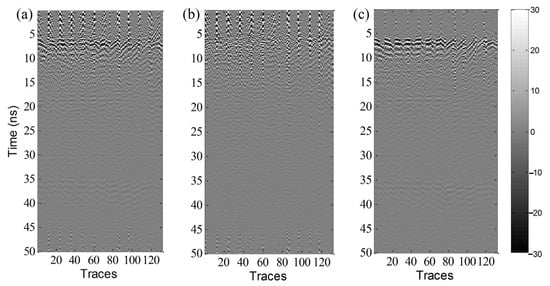
Figure 5. Radar images acquired from the ground experiments, adopted from Feng et al. [79]. (a) Raw radargram. (b) Processed radargram after applying delay correction, bandpass filtering, and sampling calibration. (c) Radargram after background removal.
3.4. Estimation of Velocity Spectrum of the Radar Image
The LRPR data goes through automatic gain control before velocity spectrum estimation to enhance weak signals from deeper levels and ensure that there is enough total energy. As the top and bottom of the simulated lunar regolith layer are flat. All midpoints fall within a comparatively smaller area than the LRPR aperture. The radar-observed data traces are considered as if they have an identical midpoint. Based on cross-correlations of the traces utilizing the common midpoint (CMP), the velocity spectrum analysis is conducted. The coherence of signals between various traces is computed along specific test velocities defined as trajectories or paths. The stacked coherence power can be plotted on a velocity-time image, and the coherence power varies with different test velocities [79].
The measurement of coherence is typically represented by the non-normalized type of cross-correlation and is given by the equation [80]:
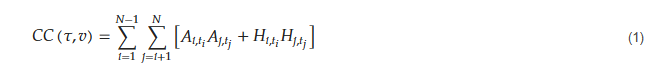
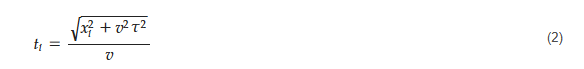
N is the quantity of traces in the CMP set, while j and i are trace numbers. 𝐴𝑖, 𝑡𝑖, and 𝐻𝑖, 𝑡𝑖 are the imaginary and real parts of LRPR data after Hilbert transform in the 𝑖−𝑡ℎ trace at 𝑡𝑖, and 𝑡𝑖 is determined by both the two-way zero offset travel (TZT) time and the experimentally derived propagation velocity v.
According to Equation (1), the envelope velocity spectrum can be obtained (as shown in Figure 6). Two peaks can be pinpointed at the spectrum’s upper and lower extremities, corresponding to pronounced reflection events occurring at the interface between the lunar regolith and vacuum layer, as well as at the bottom. The chosen time corresponds to the TZT time of these reflections, while the selected velocity is referred to as the stacking velocity. Additionally, the velocity of the lunar regolith layer can be calculated using the Dix formula [81]:
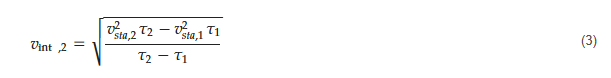
where 𝑣𝑠𝑡𝑎,1 and 𝑣𝑠𝑡𝑎,2 represent the stacking velocity of the vacuum and regolith layer respectively. 𝑣𝑖𝑛𝑡,2 signifies the interval velocity, representing the speed of propagation for electromagnetic waves within the lunar regolith. After obtaining 𝑣𝑖𝑛𝑡,2, the dielectric permittivity of the lunar regolith layer can be determined by establishing a relationship between dielectric permittivity and electromagnetic wave velocity. By applying the equation mentioned above, according to Feng et al. [79] electromagnetic waves in lunar regolith propagate at a speed of about 0.173 m/ns (Figure 6a). The speed at which electromagnetic waves typically propagate through lunar regolith is this [7,36].
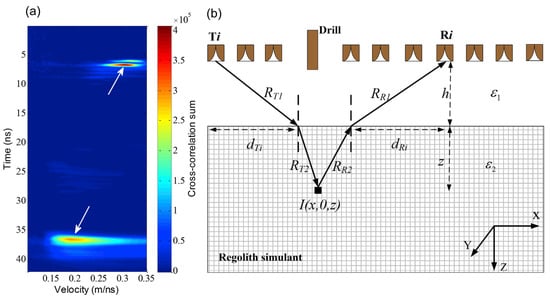
Figure 6. Estimation of velocity spectrum for LRPR data (adopted from Feng et al. [79]). (a) Envelope velocity spectrum. (b) The geometric path of electromagnetic wave propagation in two media.
3.5. Radar Imaging Algorithm
The research on LRPR radar imaging algorithms mainly includes Li et al. [75] and Feng et al. [79]. Li et al. [75] provide a migration imaging technique of an advanced prestack depth rooted in the Kirchhoff integral principle. Feng et al. [79] offer an imaging method that is derived from SAR (Synthetic Aperture Radar) validation and imaging by processed data from ground-based experiments [79]. Furthermore, the latest study also introduces an imaging technique grounded in synthetic imaging principles drawn from the field of radio astronomy [12].
The radar imaging algorithm of diffraction stacking migration is highly flexible and applicable to various array configurations. Its process entails the reverse-time back-propagation of each time-domain trace collected, effectively relocating the observed reflections to their accurate spatial positions. The array radar antenna data imaging algorithm used in the CE-5 mission mainly adopts this approach, e.g., Feng et al. [79] conducted detailed research on this algorithm. The main steps of the algorithm are as follows:
1. First step: Integrate the signals that have been propagated backward from traces all within the aperture of radar, culminating in the comprehensive computation of diffraction stacking for the region of migration. An improved migration formula using cross-correlation is used to achieve better imaging results, as shown in the following equation:
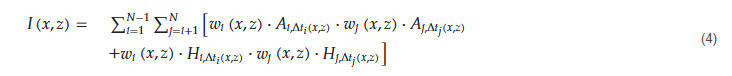
where the 𝑦=0 plane is taken as the migration plane. 𝐼(𝑥,𝑧) represents the reflection intensity at a certain point (𝑥,0,𝑧). The weighting coefficient, 𝑤𝑖(𝑥,𝑧), is employed to account for compensating energy losses brought on by spherical spreading and medium absorption. Following the Hilbert transform, 𝐻𝑖,Δ𝑡𝑖(𝑥,𝑧) and 𝐴𝑖,Δ𝑡𝑖(𝑥,𝑧) represent imaginary and the real parts of the observation of radar at the trip time of two-way along the i-th trace.
2. Second step: Calculate the two-way travel time. For the time Δ𝑡𝑖(𝑥,𝑧), it can be calculated based on the geometric relationships shown in Figure 6b using the following equation:

where the values of permittivity of two layers two as determined via velocity estimate are denoted by 𝜀1 and 𝜀2, respectively. 𝑅𝑇1, 𝑅𝑇2, 𝑅𝑅1, 𝑅𝑅2 represent the propagation paths of electromagnetic waves (as shown in Figure 6b), displayed as the following equations:
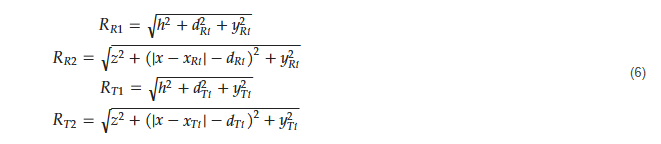
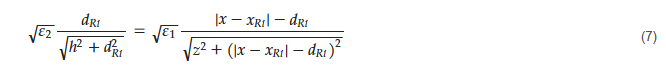
Their calculations can be combined with 𝑑𝑇𝑖, 𝑑𝑅𝑖 (distances from the refractive points on the surface layer to the transmitting or receiving antenna), 𝑥𝑇𝑖, 𝑦𝑇𝑖, 𝑥𝑅𝑖, 𝑦𝑅𝑖 (coordinates of the receiving and transmitting antennas for the 𝑖−𝑡ℎ trace), and h (distance from the receiving and transmitting antennas to the lunar regolith). For 𝑑𝑅𝑖, it can be calculated according to Snell’s law, and 𝑑𝑇𝑖 is the same as:
3. Third step: Calculate the weighting coefficients for Equation (4). The weighting coefficients can be calculated using the following formula:

where 𝛼 denotes the attenuation coefficient of electromagnetic waves within a medium characterized by losses, defined as:
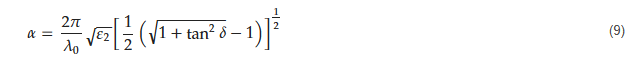
where 𝜆0 is the wavelength. The parameter tan𝛿 is the loss tangent of the material for electromagnetic wave propagation. Typically, the loss tangent of lunar regolith is significantly less than 1 [36], and with an approximation, the above formula can be simplified to
4. The final step is to calculate Δ𝑡𝑗(𝑥,𝑧) and 𝑤𝑗(𝑥,𝑧) similarly, then input the results into Equation (4) to compute the pixel value for each individual in the grid of the lunar regolith simulation. After calculating the pixel values for all, the migrated radar image can be obtained, as shown in Figure 7.
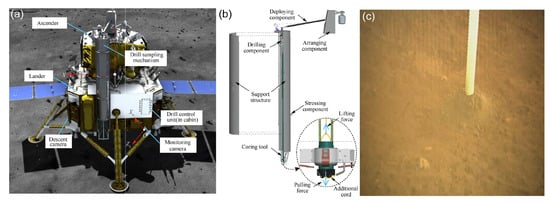
Figure 7. Core sampling scene of the CE-5 mission on the Moon’s surface (adopted from Zheng et al. [17]. (a) Layout of drilling equipment. (b) Schematic diagram of drilling mechanism. (c) Drilling Scenario.
From Figure 7, it is noted that the interfaces between the vacuum/regolith layer and the metallic bottom are distinctly visible due to the presence of the most pronounced reflections. The plastic plates and metal spheres are imaged with precise localization, but the diffraction characteristics of electromagnetic waves obscure their exact physical size and shape. On the other hand, the radar images do not render a clear depiction of the basalt rocks. This can be attributed primarily to their relatively small radar cross-sections and irregular shapes. This suggests that accurately imaging irregular rocks with dimensions smaller than 19 cm poses a greater challenge for the CE-5 radar system [79]. Additionally, there are issues of clutter and meaningless imaging results in the imaging plots that still need to be resolved.
3.6. Possibility for Solving Cluttered Imaging
Based on the imaging results shown in Figure 8, while the positions of the plastic plate and metal sphere are accurately represented, the irregular rock blocks with a diameter smaller than 19 cm are difficult to locate due to imaging noise and interference. Solving the issue of imaging noise becomes essential when there is a need for precise localization of such objects and a demand for clearer imaging results. Yang et al. [82] proposed a method to handle imaging noise. According to their study, to reduce the noise, they rotated the radar main beam’s transmission direction and imaged it before and after the rotation. By fusing the images obtained before and after the rotation using the Hadamard product, they significantly reduced the noise. The principle is to use strong radar signal data from the main beam transmission for imaging, thereby reducing noise caused by weak signals from the side beams. However, strong radar signals can also cause noise. By rotating the radar main beam’s transmission direction, the trace of strong radar signals differs, and the noise positions in the imaging are different. Since the target positions remain fixed, fusing the two imaging results can eliminate noise from different positions while preserving the target imaging.
The core idea of the method proposed in Yang et al. [82]’s paper is to “multiply” two different radar images with different noise positions to obtain a radar image with reduced noise and containing target information. Based on this idea, it can be speculated that to address the imaging noise in LRPR radar, it may be necessary to obtain radar images with the same target positions but different noise positions. Since LRPR radar operates in a static state, and the radar signal transmitter does not rotate, it is not possible to generate images with different noise positions by transmitting signals in different directions. Therefore, to obtain images with consistent target positions without modifying the equipment, it might be necessary to address this issue through data processing and possibly with different imaging algorithms. For the data processing, the experiment’s results of Zhang et al. [12] revealed that the data collected from the Moon exhibits a deviation of approximately 0.850 ns when compared to the data acquired through ground experiments. The calibration of cable delay parameters used is also a crucial step that requires attention [74,75,79]. Based on the position of direct coupling waves and LRPR hardware design, a delay model was developed by Zhang et al. [12] to estimate the cable delay of LRPR, which offers a credible way for calibrating LRPR data and may contribute to reducing cluttered imaging.
This entry is adapted from the peer-reviewed paper 10.3390/rs15215173
This entry is offline, you can click here to edit this entry!