Small peptides are an important component of the vertebrate immune system. They are important molecules for distinguishing proteins that originate from the host versus proteins derived from a pathogenic organism, such as a virus or bacterium. Therefore, these peptides are central to the vertebrate host response to intracellular and extracellular pathogens. Computational models for peptide prediction are based on a narrow sample of data with an emphasis on the position and chemical properties of the amino acids. In prior studies, this approach has led to models with higher predictability as compared to models that rely on the geometrical arrangement of atoms. However, protein structure data from experiment and prediction is a source for building models, and, therefore, knowledge on the role of small peptides in the vertebrate immune system.
- protein structure
- small peptides
- vertebrate immunity
- pathogenic organisms
- adaptive immunity
1. Background on Immunological Peptides
The adaptive immune system of vertebrates is a system of cells and molecules whose role is to distinguish self from non-self. Therefore, a vertebrate host has the potential to detect and clear pathogenic organisms. A major component of this system involves a linear chain of amino acids, the small peptides[1]. The small peptide is of interest since the host immune system relies on it as a marker for a determination on whether a protein originates from itself, or instead of a foreign origin, such as a virus or bacterium[2]. This system can also identify its own cells as foreign if they are genetically altered by a process that leads to the production of non-self molecules[3][4].
These small peptides of interest are formed by cleavage of proteins in the cells of the host, and they form the basis for the cellular processes of immune surveillance, and for identifying pathogens along with cells that operate outside their expected genetic programming[3][5][6][7]. However, the adaptive immune system can falsely identify a peptide as originating from non-self in cases where it is a self-peptide, the phenomenon of autoimmunity[8][9][10][11]. An example is where a subset of T cells[12][13], named for their development in the thymus[14][15], falsely detects small peptides as presented on the surface of cells as originating from non-self, and subsequently signals the immune system to eliminate these cells[16][17][18].
The mechanism for small peptide detection is reliant on a molecular binding between the peptide and a major histocompatibility complex (MHC) receptor that is expressed in the majority of cells of a vertebrate[19][20][21]. Further, this mechanism is refined by training the T cells as specialists, which disfavors individual T cells that attack normal cells, while favoring the proliferation of those that attack non-self[14][21]. This is not a deterministic process, however. The dictates of probability are present in biological systems, including in the generation of genetic diversity across the different MHC receptor types, the cleavage process for generating small peptides from a protein, the timeliness of the immune response to molecular evidence of a pathogen, the binding strength of peptides to a MHC receptor, and the requisite sample of peptides for pathogen detection. This system is in contrast to a human designed system, where the structure and function originates by an artificial design, along with low tolerance for this kind of variability.
In prior experimental studies, the small peptide data has not been uniformly sampled[3][21]. For example, only a small proportion of MHC molecules have been studied in regard to their association with a small peptide. The problem is the allelic distribution that corresponds to these molecules. While there are about around a dozen genetic loci in clusters that code for a MHC protein receptor, the number of alleles among these loci is very high as compared to the other genetic loci across a typical vertebrate genome. In the human population, the number of total alleles across the MHC loci is estimated in the thousands[3][22]. These are active genetic sites of evolutionary change and generative of diversity, and unlike the other regions of the genome, has been unhindered at the genetic level by the putative bottleneck that reduced our effective population to mere thousands of individuals[23]. Likewise, studies of these small peptides have generally been restricted to the human population, animal models that serve as a proxy in the study of biomedicine, and livestock[21].
Moreover, there is a preference in scientific analysis that corresponds to MHC class type. The MHC Class 1 receptor is generally favored over that of Class 2 in modeling the MHC-peptide association, partly because in MHC Class 1 some of the amino acids of the peptide are confined in pockets of the MHC receptor[1][3][24][25] (Figure 1). This has led to predictive models of MHC-peptide (pMHC) binding that parameterize the position and chemical type of the amino acids of these peptides[21][26]. These models have exceeded the predictiveness as compared to those solely based on geometrical data of atomic arrangements[3]. However, the geometrical features are expected to provide further insight on pMHC and models for predicting an immunogenic response.
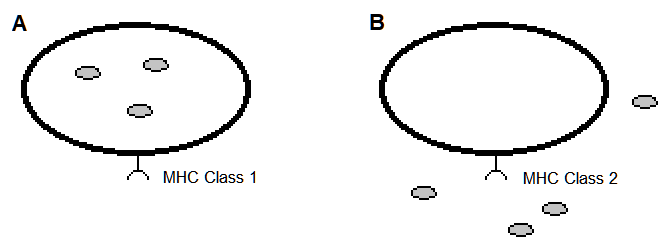
Figure 1. Vertebrate cells expressing an MHC receptor on their cell surface. The hypothetical pathogens are the small filled circles. (A). Nearly all cells express MHC Class 1 cell surface receptors that present peptides of an intracellular origin. (B). Many cell types of the immune system express MHC Class 2 cell surface receptors that present peptides of an intercellular origin.
Recently, artificial neural networks and related machine language approaches have led to advances in knowledge of protein structure and the potential for modeling the association between proteins and other molecules[21][26][27][28][29]. These methods are capable of highly predictive models that incorporate disparate kinds of data, such as in the use of both geometrical and chemical features in estimating the binding affinity for an MHC receptor with a small peptide[21]. Moreover, they are highly efficient in the case where modelling is dependent on a very large number of parameters, as commonly observed in biomolecular interactions. Consequently, the deep learning approaches have led to successes in the prediction of protein structure across the many clades of life[30]. These approaches are complemented by the analysis of interpretable metrics for estimating the geometrical similarity among proteins[31][32][33].
The study of immunogenetics relies on collecting data and building models as expected in the pursuit of scientific knowledge[21][34]. Ideally, this practice is expected to lead to a meaningful synthesis that is unmired by a collector's fondness for naming schemes and ungrounded collations of terms and studies[35]. The latter perspective resembles the practice of creating the images of science, akin to an art form, while not achieving the aim of extending knowledge by the purposeful modeling of natural phenomena[36].
2. Metrics of Peptide Structure Similarity
2.1. TM-score and the RMSD metric
There are a large number of methods for measurement of the geometrical similarity among proteins[37]. In particular, one method is by the template modeling score (TM-score), which is based on an algorithm, and a performant implementation in code, for measuring the similarity between any two protein molecules ((Figure 2)[31]. Further, the compiled program from this open source code computes a root-mean-square deviation (RMSD) metric, a similar measure to the TM-score, but, where the latter method is relatively less sensitive to the non-local interactions of a molecular topology, along with the advantage of model invariance to the size of the protein. However, the RMSD metric is also interpretable.
Given a cellular protein, there is empirical support for a range of TM-score values that are meaningful in the context of protein structure similarity, and, likewise, for dissimilarity. A value above 0.5 is considered a significant result of similarity, while a value below 0.17 represents a comparison that is indistinguishable from a randomly selected comparison[38]. The values for this metric are further bounded by the values of 0 and 1.
The TM-score metric is applicable to the analysis of small peptides. For instance, it is possible to sample protein structure data[30], select all unordered pairs of proteins for comparison, and then find an empirical distribution of values of this metric. This practice may be used to establish significance values for this metric, based on the above sampling procedure. The next subsection describes a method to obtain data for the predictions of the three dimensional structure across biological proteins.
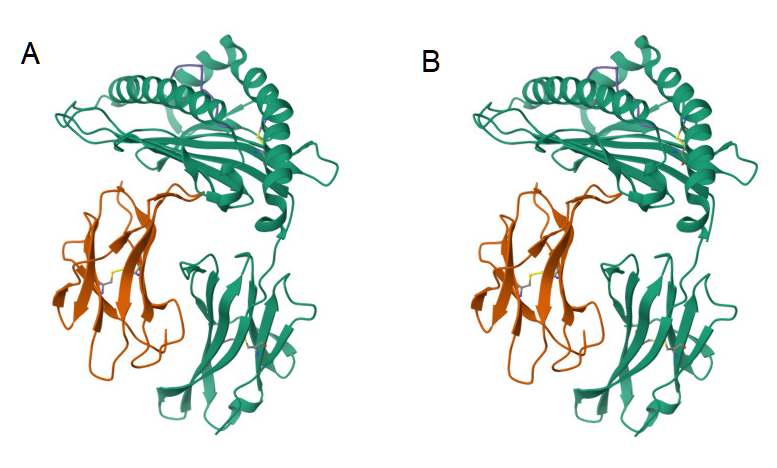
Figure 2. Ribbon diagrams of the 3d atomic structure of an MHC Class 1 receptor as bound to a peptide[39]. The protein structures appear identical, so a score for their similarity should be very high[31]. (A). The peptide is AH1 (6L9M)[40]. (B). The peptide is A5 (6L9N)[41].
2.2. Peptide Structure Data Files
Predictions of protein structure in PDB formatted files are available across the many forms of cellular life: https://alphafold.ebi.ac.uk/download (Figure 3). These files are stored as an archival file type (.tar), so the "tar" program is useful for extracting the files as contained within the archival file. The archive file sizes are generally large, so an alternative to a conventional web-based retrieval is to use the "curl" program at the command line, which is capable of resuming from a partial file transfer as can result from loss of the network connection. An example below is for the mouse data:
curl -O https://ftp.ebi.ac.uk/pub/databases/alphafold/latest/UP000000589_10090_MOUSE_v4.tar
The above archive file (tar file format) has both PDB and mmCIF formatted file types for each protein. A command line is shown below for restricting the file extraction process to PDB files:
tar -xvf UP000000589_10090_MOUSE_v4.tar *.pdb.gz
As noted above by the "gz" file extension, each PDB formatted file has been compressed to a smaller file size in a binary format (gzip file format), so a decompression operation will lead to a plain text file with the PDB protein structure data (text file format). To decompress these files in a single operation, the "gzip" program is commonly used:
gzip -d *.gz
Since the archive file (tar file format) itself is not compressed, but the data files contained within the archive are compressed, the unarchival operation to extract these files to a directory will use disk space similar to that of the original archive file. However, decompression of the individual compressed data files (gzip file format) will occupy a much larger space on the storage device because each of these data files are compressed by 25% of its original size. Therefore, if the uncompressed data files of interest occupy 4 gigabytes of disk storage, then the decompression operation is expected to result in the use of 16 gigabytes of disk space. Since this example corresponds to a single organism and its protein structure data files, the disk storage requirement is consistent with a desktop computer. However, extending a study to other organisms, or inclusion of protein structure predictions across the Swiss-Prot database, will lead to a very large disk space requirement. The file system of the disk storage is also expected to show robustness to the handling of a very large number of data files since the above method can lead to the creating of a few thousand to over a million files.
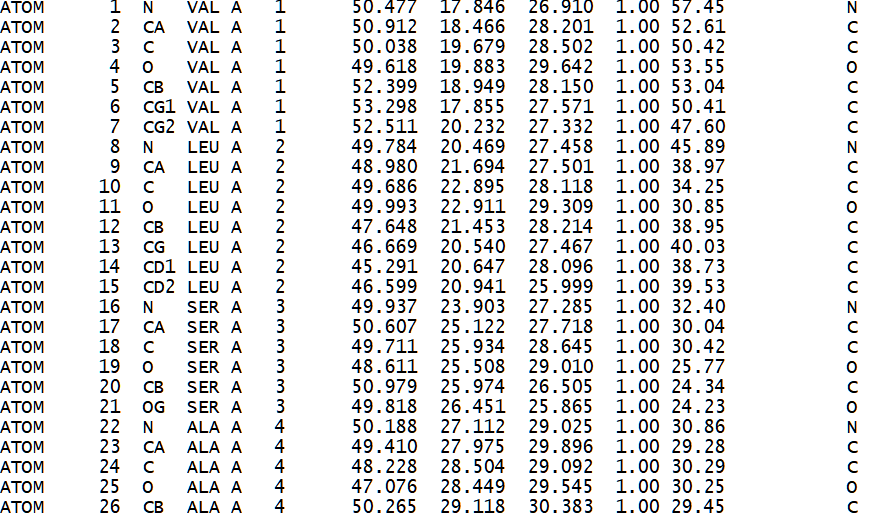
Figure 3. Sample of a PDB formatted file that describes the 3d atomic structure of a hemoglobin protein (1HV4)[42].
2.2.1. Parsing the PDB Data Files
The PDB formatted data files are expected to conform to the standardized format as described at the following site:
https://www.cgl.ucsf.edu/chimera/docs/UsersGuide/tutorials/pdbintro.html
Each PDB formatted data file can contain more than one model of the protein structure. It may also describe more than one protein chain per model. Below is Python computer code for parsing each PDB data file by these two features, which then prints out the names of the model and protein chains[43]:
import glob
from Bio.PDB.PDBParser import PDBParser

# assign functions
parser = PDBParser()

# input file
for file in glob.glob('./*.pdb'):
    print("file: ", file)

    # retrieve PDB structure
    structure = parser.get_structure(file, file)

    # iterate over models and chains in file
    for model in structure:
        print("model: ", model)
        for chain in model:
           print("chain: ", chain)
Other code samples are available at a GitHub web site for processing PDB data files[43], including a template for splitting a PDB data file into multiple files, where each split file represents a window of 9 amino acid residues. The window is shifted by 1 residue per newly created file, so the procedure is equivalent to sliding a window along the sequence of amino acid residues of a protein, and writing that data to a file that corresponds to the window of 9 amino acids and the associated protein structure data. However, this procedure leads to disk space usage that is orders of magnitude more than the disk space occupied by the original PDB formatted data files. The count of files likewise increases by the same factor, while the Python code is not a performant language in processing these file operations, given it is expected to process the code along a single thread, and, furthermore, the code in this example is not necessarily translated by the Python code interpreter to a highly efficient machine code, whereas a low level programming language is designed for computational efficiency at the level of machine code.
2.2.2. Format of Data Files for TM-score
Below is another code sample. In this case, it resets the amino acid residue number, an index, of each PDB data file, since by default the TM-score expects that the sequence of residues in each of the two input data files to start with the same index numbering scheme:
import os

directory = 'C:/Peptide3d/data'
files = os.listdir(directory)

for file in files:
    if file.endswith('pdb'):
        print(file)
        pdb_file = file

        with open(pdb_file, 'r') as f:
            lines = f.readlines()

        current_residue = None
        start_residue = 1
        current_residue_number = start_residue - 1

        for i, line in enumerate(lines):
            if line.startswith('ATOM'):
                residue = line[22:26]
                if residue != current_residue:
                    current_residue = residue
                    current_residue_number += 1
                lines[i] = line[:22] + str(current_residue_number).rjust(4) \
                 + line[26:]

            if line.startswith('TER'):
                residue = line[22:26]
                if residue != current_residue:
                    current_residue = residue
                lines[i] = line[:22] + \
                 str(current_residue_number).rjust(4) + line[26:]

        with open(pdb_file, 'w') as f:
            f.writelines(lines)
3. Peptide Structure Analysis in Immunogenetics
3.1. Significance Levels for TM-score
The TM-score metric is a powerful tool for measuring the structural similarity among proteins[31]. This metric, along with available protein structure data, can be applied to the study of small peptides. However, in the case of small peptides, the significance levels are not yet established for the expectation on the TM-score values. These levels can be estimated by computational analysis of randomly selected pairs of small peptides, such as by a sliding window analysis of protein structure data by residue, as described above, or, alternatively, by simulation of the amino acid sequence of peptides. This knowledge would provide the groundwork for analysis of small peptides as derived from clinical and other empirical data sources, such as in the case of a pathogen that has evolved to escape detection from the immune defenses of members of a host population, allowing for a reference on the expected numbers and types of amino acid changes in a pathogen to evade host immunity. The above sections refer to a linearly sampled peptide of the immune system, such as detected by a specialized T-cell, but the activity of the B cell types is a separate question, where the effective sampling of polypeptides may be by geometric proximity, and, therefore, not reliant on a linear arrangement of amino acids for detection of non-self molecules.
3.2. Local versus Global Factors of Protein Structure
A complementary approach is to survey the world of potential small peptides as sampled from the protein structure data, and test whether their geometrical structure are shaped by either physical factors at the local level or at the global level of the molecule (Figure 4). The null hypothesis would be that any two small peptides with the same amino acid sequence, but sampled from different non-homologous proteins, would not show similarity in their protein structure, as measured by the TM-score[31]. However, this test is based on the prior assumption that the TM-score has a previously established level of significance for rejecting this null hypothesis, and this assumption may be met by the suggestion in an above section. Another assumption is on the availability of small peptide data for this test. For a peptide sequence of 9 amino acids, where there are 20 types of amino acids, the naive probability of finding any two randomly selected matching pairs of these peptides is 1 in 20 to the 9th power, which resolves to 1 in 520 billion pairs. However, sampling of peptides with a shorter length, with fewer residues, is expected to lead to finding identical pairs of peptides in a large database of protein structures. This test is also reliant on the reliability of the TM-score metric at the specified peptide length. If local factors of protein structure are in fact predictive of the structure of a small peptide, then it is possible to apply this knowledge to prediction of immunogenic peptides in Nature, and, therefore, the geometrical distance between a known peptide and a predicted peptide is potentially measureable.
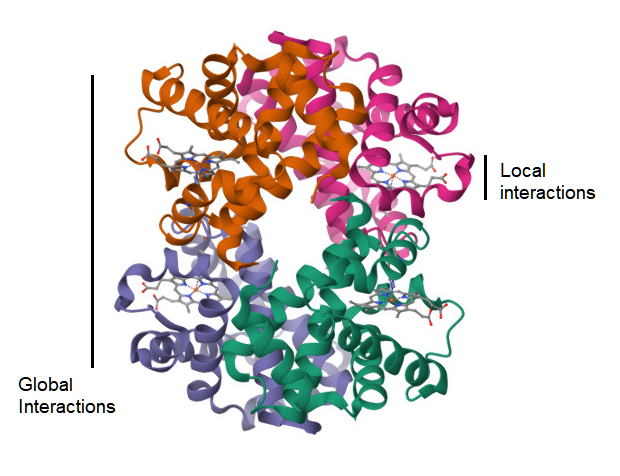
Figure 4. Ribbon diagram of the 3d atomic structure of a hemoglobin molecule (1HV4)[44]. A visualization of the hypothesis on whether the strength of atomic interactions at the local scale is equal to that at the global level.
4. The Immunogenicity of Peptides
As described in the above Introduction, the applicable immunological models of small peptides are dependent on position and chemical type of amino acids, largely a consequence of the linear structure and restriction in length of these peptides, and their molecular interaction with an MHC receptor type as a complex of multiple components (pMHC). Further, it is reasonably established that the formation of an pMHC is highly dependent on the upstream pathways for restriction in peptide length[21]. However, this is an explanation on peptide-MHC binding, but not the subsequent downstream pathway for T-cell recognition. Likewise, models have high predictiveness in determining an association between peptide with an MHC receptor type[45], but less is known about the downstream immune response[21][46]. However, it is known that the probability is very low for a peptide, as presented on the cell surface by an MHC receptor, to lead to an immune response (Figure 5).
As covered by Nielsen and others[21], the problem is not in the robustness of models of pMHC binding, but in predicting that a peptide as presented on the cell surface is truly immunogenic[47]. For detection of these immunogenic peptides, a model must show high accuracy[48][49]. Given a model where the error rate from false negatives is set low, ~1 percent, so that the number of potential epitopes is large, and few candidates are absent, then there is a concomitant increase in the false positive error rate for these predictions, leading to a limitation in detection of the set of true epitopes[21][50][51]. Given this rarity of immunogenicity in a sample of peptides, and the factors that lead to this rarity, modelling this phenomenon is limited[48], while the parameterization of the model is additionally hindered by the presence of unknown factors. With an informative data set, this is a kind of problem that is suitable for a deep learning approach, where the higher order features are captured by the model, including that of the atomic structure.
Gao and colleagues[52] developed a method and procedure in their article "Pan-Peptide Meta Learning for T-cell receptor-antigen binding recognition". It is based on meta learning principles and a neural Turing machine. In the case of zero-shot learning, where the potential for immunogenicity in peptides is not modelled by prior data, the authors undertook a procedure to validate their proposed method: an T-cell receptor-antigen dataset from a COVID-19 study. Their method, PanPep[53], showed a model performance of ~0.7[52] (ROC-AUC analysis[54]). They further showed that past models did not discriminate better than random chance. However, their model performance of ~0.7 is not considered robust, but this is in the case of zero-shot learning, while their study suggests higher predictiveness with the inclusion of data as a prior (called few-shot learning). PanPep[53] is also capable of assessing the structural relationship between peptide and T-cell receptor by simulation of a substitutional analysis of alanines (an established technique by experimental biologists) even though their data is based on sequence information only[52], and the authors describe a "contribution score" for this relationship at each residue along the CDR3 region of the T-cell receptor[52][55][56], a region of very high diversity[57][58] that is central to its interaction with pMHC and any subsequent immune response. Therefore, this method is applicable for investigating a shift in the population of peptides as derived from a pathogen, and its influence on prior host immunity.
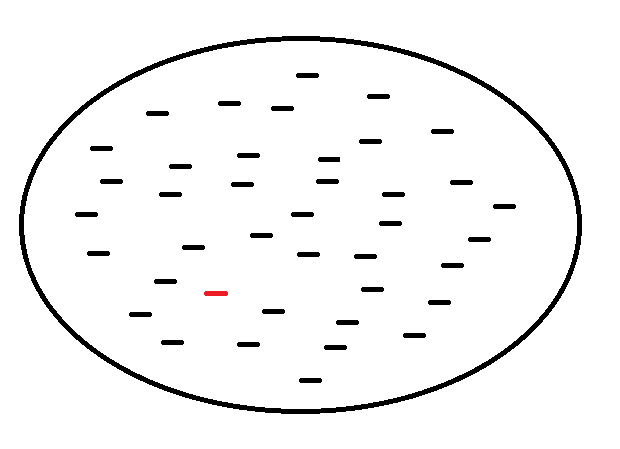
Figure 5. An abstract view of a sample of small peptides, as shown inside the circle, that are known to bind with an MHC receptor on the surface of a vertebrate cell. The red colored peptide is immunogenic, while the other peptides in this sample are not. The expectation is that most peptides, as presented on the cell surface by an MHC receptor, do not lead to an immune response.
5. Modelling Protein Structure of T Cell Receptors
5.1. Overview of the ImmuneBuilder Method
While AlphaFold[30] uses a deep learning method for prediction of the protein structure of multimeric molecules, it is not specifically adapted to modelling molecules of immunity. Recently, Abanades and others developed ImmuneBuilder[59], a set of deep learning models specific to the hypervariable molecules of immunity. It includes a component known as TCRBuilder2[59], a model for predicting the protein structure of T-cell receptors. The authors showed that their method is over 100x faster in performance than the well known AlphaFold approach. This higher performance in the generation of protein structures allows for efficient computation that is within the capabilities of a typical computer workstation. Furthermore, TCRBuilder2 is specific for predicting a narrow range of protein structures, and, therefore, it has removed a dependency on a prior of a multiple sequence alignment. However, AlphaFold-Multimer[60] is dependent on this prior since it is tuned as a general model of protein structure prediction.
The model weights of TCRBuilder2 are publicly available[59]. The model is based on a curated set of 704 T-cell receptor variable domains[61]. Of this set, 50 of the data samples were used to validate the method, so they were excluded in the training of the model[59].
The RMSD metric[62], as described in an above section, is a measure to compare the quality of predictions as generated by TCRBuilder2 and AlphaFold-Multimer. In this case, the methods are fairly comparable in the prediction of T-cell receptors as sampled in the study[59]. In the CDR (hypervariable complementarity-determining regions) regions of the TCR alpha and beta chains, the mean RMSD metric values, as reported in units of angstroms, are generally below a value of 2.0, although the values are near to 2.0 in the CDR3 region. The smaller this value the closer the correspondence of the predicted protein structure with that expected of the molecule. A value of 0 indicates that they are identical. The divergence in values as reported, particularly the higher value in the CDR3 region, is expected since they are hypervariable as compared to other regions of the receptor. Therefore, it is expected that the hypervariable regions require greater sampling for better predictiveness by the model.
The interpretation of RMSD values requires knowledge of other factors, such as the sample size of amino acid residues, so the TM-score metric[31] will help in validating an interpretation of the RMSD metric and its assumptions. However, common advice is to interpret a mean RMSD value of <2 angstroms as suggestive of similarity in the comparison of the spatial structure of two proteins. In the TCRBuilder2 study, and to disentangle the parameters of their predicted protein structure, the authors included measurements of error in the reconstruction of the 6 angles between the alpha and beta chains (ABangles)[63], the 4 torsion angles of the side chain (potentiality for peptide binding)[64], and solvent accessibility of amino acid residues[59]. Overall, their extensive analysis of a molecule by region allows for a robust interpretation of model performance and that of competing methods.
5.2. Usage of TCRBuilder2
The source code for ImmuneBuilder is available at GitHub[65]. The code includes instructions for an analysis at the command line of a compatible computer system. Further, their repository includes a Colab Notebook for testing TCRBuilder2. The software includes several dependencies on other Python libraries, which are under active development. A large number of library dependency is common in the case in deep learning projects, where commonly used algorithms and code is relegated to a library for reuse by others.
Since the library dependencies are actively developed, I made modifications to the Colab Notebook file for a successful test run of the code at Google Colab[66]. The modified file is shown below, along with comments to help document the lines of code.
Step 1. Install TCRBuilder2 Dependencies:
# Edit sequence_1, sequence_2, filename - the input data for prediction of 3d structure# The Colab runtime may report a crash from an expected restart during installation of a library
# Comment out this line to enable verbose output%%capture
!pip install ImmuneBuilder # use Python installer to install ImmuneBuilder (TCRBuilder2)!pip install -q condacolab # google colab-compatible access to conda
import condacolab, sys # import modules to access their functionscondacolab.install_mambaforge() # use of mamba to install conda modules
!mamba install openmm # install openmm (toolkit for molecular simulation; refine prediction)!mamba install pdbfixer # install pdbfixer (fix problems in PDB formatted files)!conda install -y -c bioconda anarci # install anarci module from bioconda distribution
Step 2. Install TCRBuilder2 and Run Prediction:
# Delete and restart Colab runtime to help avoid unexpected errors in the following code
# Comment out this line to enable verbose output%%capture
!pip install -q ImmuneBuilder # use Python installer to install ImmuneBuilder (TCRBuilder2)
protein_type = "TCR"from anarci import number # github.com/oxpig/ANARCI; aligns sequence to canonical proteinfrom ImmuneBuilder import TCRBuilder2 # prediction of 3d structure
# select modelpredictor = TCRBuilder2() # "TCRBuilder2" or "ABodyBuilder2" model
# Verify that TCR sequences are annotated as TCR alpha and beta chains# Example below is sample data from www.rcsb.org/structure/5d2lsequence_1 = 'MILNVEQSPQSLHVQEGDSTNFTCSFPSSNFYALHWYRWETAKSPEALFVMTLNGDEKKKGRISATLNTKEGYSYLYIKGSQPEDSATYLCAFITGNQFYFGTGTSLTVIPNIQNPDPAVYQLRDSKSSDKSVCLFTDFDSQTNVSQSKDSDVYITDKCVLDMRSMDFKSNSAVAWSNKSDFACANAFNNSIIPEDTFFPSPESS'sequence_2 = 'MGAGVSQSPSNKVTEKGKDVELRCDPISGHTALYWYRQRLGQGLEFLIYFQGNSAPDKSGLPSDRFSAERTGESVSTLTIQRTQQEDSAVYLCASSQTQLWETQYFGPGTRLLVLEDLKNVFPPEVAVFEPSEAEISHTQKATLVCLATGFYPDHVELSWWVNGKEVHSGVCTDPQPLKEQPALNDSRYALSSRLRVSATFWQNPRNHFRCQVQFYGLSENDEWTQDRAKPVTQIVSAEAWGRAD'
sequence_1 = "".join(sequence_1.split()) # Remove whitespacesequence_2 = "".join(sequence_2.split()) # Remove whitespacefilename = 'output.pdb' # output file name as PDB formatted file (viewable in RasMol)
# anarci will reject the sequence if it is not an expected match to the immunoprotein_, chain1 = number(sequence_1) # set key for chain 1 to input sequence_, chain2 = number(sequence_2) # set key for chain 2 to input sequence
input = dict() # initialize hash table of key-value pairsif chain1:input[chain1] = sequence_1 # add sequence value to key for hash tableif chain2:input[chain2] = sequence_2 # add sequence value to key for hash table
predictor.predict(input).save(filename) # run 3d prediction of TCR, save to file
The output file is a 3d protein structure in PDB format. The RasMol software[67] can display these files, including as ribbon diagrams of the atomic arrangements, but the export feature to save the image is not expected to function in recent versions of Microsoft Windows. For this case, the image may be captured in Windows by pressing two keys on the keyboard at the same time, the 'Alt' key and the "Print Screen" key. This captured image is a copy and it can be pasted into another document by the simultaneous pressing of the 'Ctrl' key and the 'V' key.
5.2. Verification of the TCRBuilder2 Model
The TCRBuilder2 prediction is of the protein structure as generated from the protein sequence input that corresponds to the two TCR protein chains (i.e., alpha/beta chains). In the example below, the input is of a protein complex as sampled from the RCSB database[68], PDB record 5d2l (rcsb.org/structure/5d2l). This record includes an empirically derived protein structure, a potential benchmark for the quality of the predicted protein structure by TCRBuilder2. The empirical data for 5d2l is exportable as a file in PDB format. This file appears to correspond to an empirical analysis of a quaternary crystal structure of the protein. For details on collection of the empirical data, the database record references an article entitled Structural Basis for Clonal Diversity of the Public T Cell Response to a Dominant Human Cytomegalovirus Epitope[69], which describes the study:
"The corresponding r.m.s.d. for the four C7·NLV·HLA-A2 complexes ranged from 0.50 to 0.83 Å. Based on these close similarities, the following descriptions of TCR-pMHC interactions apply to all complex molecules in the asymmetric unit of the C25·NLV·HLA-A2 or C7·NLV·HLA-A2 crystal."
"Three complex molecules in the asymmetric unit were located first; the fourth was found according to non-crystallographic symmetry."
A method to confirm that the record 5d2l is of four empirically derived samples of a single protein complex is as follows. First, the empirical data (in this case, PDB formatted) can processed to collate the alpha and beta chains of the TCR receptor and their amino acid sequences. In this this case, the data samples by chain were identical or nearly identical at the residue level. Therefore, the data is expected to contain four models based on the four samples of the same protein complex. Thirdly, there is a REMARK section in the file with descriptions for 4 BIOMOLECULEs.
The PDB formatted file of 5d2l has annotated information on the protein chains. In this case, the relevant data fields are identified by the prefix COMPND:
COMPND 12 MOL_ID: 3;COMPND 13 MOLECULE: C7 TCR ALPHA CHAIN;COMPND 14 CHAIN: I, K, O, E;COMPND 16 MOL_ID: 4;COMPND 17 MOLECULE: C7 TCR BETA CHAIN;COMPND 18 CHAIN: J, L, P, F;
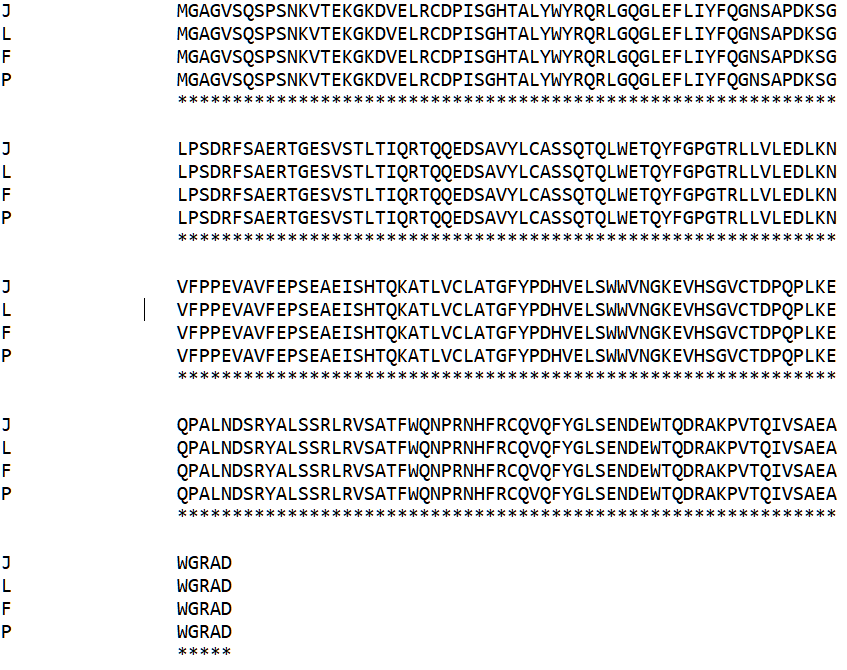
The alpha and beta chains of the TCR are annotated with letter assignments that correspond to the four models. The alpha chain is represented in the data file as I, K, O, and E; likewise, the beta chain is represented as J, L, P, and F. In the file, there are also fields that show the amino acid residue sequence of these chains. This data can be extracted by searching for the data fields with a prefix SEQRES and the letter that identifies the protein chain of interest. To view these amino acid sequences and their similarity, a sequence alignment software is used, such as ClustalW[70]. An amino acid sequence alignment of the TCR beta chain is shown below (confirming the identity of the four beta chains in the data record):
To identify the pairing of TCR alpha and beta chains in this data record, the PDB data fields with a prefix BIOMOLECULE reveal that the chains I and J are of the same data sample, and their correspondence with an alpha or beta chain, respectively, of the TCR. The PDB files can then be used to create PDB formatted files specific to each of the chains I and J. The predictions by TCRBuilder2 are presented in PDB format, so comparisons are possible between it and the protein structure in the PDB database. Next, the PDB data fields that prefix with ATOM of the TCR alpha chain were aligned (by eye in this case), and trimmed so that the amino acid residues are comparable and orthologous between the PDB record and that generated by TCRBuilder2. This procedure was repeated for the beta chain. The goal is to have a comparison between data that represents aligned amino acid residues, where each residue is orthologous between the comparisons. Next, the index value of the amino acid residues (data fields for residues have prefix ATOM) was reset as described in the above section for TM-score.
TM-score was used to compute the TM-score values[31]. The command line is as follows for one possible file naming arrangement. The "seq" parameter may also be used to align the sequence data, but the sequences should then be inspected and verified in the output file. The software uses an internal algorithm for the alignment, so it may be preferable to construct the alignments beforehand as described in the previous paragraph.
tmscore 5d2l_prediction_A.pdb 5d2l_ChainA-I.pdb > 5d2l_A_RMSD.outtmscore 5d2l_prediction_B.pdb 5d2l_ChainB-J.pdb > 5d2l_B_RMSD.out
The output of the TCR alpha chain comparison (the first command line above) reports an an TM-score value of 0.9539 across 98 residues. For the beta chain, the TM-score value is 0.9426 across 110 residues. This verifies that TCRBuilder2 is constructing models of protein structure that very closely resemble the empirical models in the PDB record.
Furthermore, TM-score has an option to output the superposition data for viewing the similarity of the protein structure (the "seq" parameter may also be specified for an automatic sequence alignment):
tmscore 5d2l_prediction_A.pdb 5d2l_ChainA-I.pdb -o 5d2l_A_SUPtmscore 5d2l_prediction_B.pdb 5d2l_ChainB-J.pdb -o 5d2l_B_SUP
RasMol can show a tube diagram of the superposed protein structures (Figures 6 and 7)[67]:
./RasMol/raswin.exe -script 5d2l_A_SUP./RasMol/raswin.exe -script 5d2l_B_SUP

Figure 6. Three dimensional protein structure of the TCR alpha chain as empirically modeled (PDB record 5d2l)[69] and that predicted by TCRBuilder2[59]. Both these models are shown in the image as a tube diagram, so that they are superposed and overlapping in geometrical space[31][67]. Thus, the two protein structures can be qualitatively analyzed for similarity. It is apparent that both protein structures are nearly identical in their spatial arrangements, but there are small regions of spatial difference. These regions can be observed by comparing the thicker strand with the nearby thinner strand.

Figure 7. Three dimensional protein structure of the TCR beta chain as empirically modelled (PDB record 5d2l)[69] and that predicted by TCRBuilder2[59]. See Figure 6 for interpretation of the image[31][67].
The above result shows that TCRBuilder2 is functioning as expected. Therefore, the method may be further tested on TCRs outside its validation set[59].
5.3. Future Directions for TCR Modeling
Even though ImmuneBuilder is competitive with Alphafold-Multimer, it is of interest to develop deep learning models that are generalized. Generalization of the model is expected to lead to a broader parameterization of protein structure for capturing the rarer patterns of atomic arrangements. However, at this time, the specificness of the ImmuneBuilder approach is favorable as it has very good performance in inferring protein structure from sequence data. Another goal of interest is the expansion of the TCR database. With better models, it may be possible to analyze the shifts in TCR structure that originates from binding of difference peptides, and gain insight into immunity across a host population.
Other approaches in deep learning pertain to the modeling of the TCR receptor. Recently, an approach was published to use a large language model to "perform evolutionary optimization over reward code" and use "the resulting rewards ... to acquire complex skills via reinforcement learning"[71]. This approach pertains to the field of robotics, but the methodology is applicable to other tasks and automate the process of trial-and-error. An example is an informatics pipeline for evaluating peptides for immunogenicity as defined by the association with an MHC molecule and subsequently by one or more TCR receptors.
6. Evolutionary Strategies by Pathogens
6.1. Molecular Signature of Peptide Immunogenicity
With a sufficiently large collection of data, the deep learning approaches are applicable for modelling the immunological pathways, particularly where traditional approaches, based on a set of interpretable parameters, are inadequate. Since the small peptides are a major determinant of adaptive immunity in the jawed vertebrates, it is essential to broadly sample for data in building models of immunogenicity[21]. Without these models, there is low predictability on the evolution of pathogens, and, therefore, the practioners of the science will tend toward misperceptions of the inner workings of the immunological system.
The above is a view based on making predictions about immunogenic peptides as derived in a pathogen of interest. However, another approach is to compare the evolution of a specific pathogen against data as generated from the highly accurate peptide-MHC binding models[21][45]. This suggestion is for simulation of changes in the genome of the pathogen, and then identifying these changes that weaken the putative binding association between peptide and MHC receptor. The distribution of amino acid substitutions in these simulations may be compared against prior knowledge of the evolution of a pathogen and its response to host immunity. The comparisons would provide insight into the numbers and types of amino acid changes that are characteristic of an evolutionary response of a pathogen, including a predictiveness on novel variants and their potential for host immune evasion. The assumption for this comparative approach is that the peptide-MHC association is a vulnerable pathway to the evolution of a pathogen. Another potential strategy by a pathogen is to target the host pathway that cleaves and forms the small peptides before any association with an MHC receptor. Third, a pathogen may evolve so the resultant peptides in this host are no longer immunogenic, although it is presumed that all three pathways are potential targets by the pathogen in its evolutionary search for evasion of host immunity. However, the relative utilization of each of these strategies is unknown.
A confounding factor is in the identification of the sets of amino acid substitutions in the pathogen that are in response to the host, as substitutions may be caused by other factors, and the genomic signature of the host response can be erased by subsequent evolutionary change. It is possible to discriminate among these evolutionary changes in a pathogen by their association with the force of natural selection. For instance, nucleotide substitution methods are available to predict if a genomic region has a recent signature of positive selection, and the signature is measured by comparing the rates of nonsynonymous and synonymous substitutions (Figure 8)[72]. A nonsynonymous change is defined as a nucleotide change that leads to an amino acid change, while a synonymous change is silent at the amino acid level. These regions identified as evolution by positive selection are ideal candidates for further study on the evolutionary response of a pathogen to a host. In contrast, the simulations are artificially generated so they can control for and model the known confounding factors by a prior set of parameters and their values.

Figure 8. The two nucleotide sequences code for a protein. They are represented as codons, where each codon codes for an amino acid. The topmost sequence is the parent while the sequence below it is the evolutionary descendant. The bottommost letters [N, S, -] represent the type of codon change, whether it leads to an amino acid change [N] or does not [S]. The third possibility is no change in the codon, so no change in the amino acid [-]. There are models of evolution for calculating a nonsynonymous and synonymous substitution rate from knowledge of the above substitutions, along with a control for the bias at each codon in its potential for a substitution[72].
Last, the immune response by a host is not dictated by any single peptide and T-cell receptor type, but a process based on combinations of various peptides and T-cell receptor types[73]. This population level perspective of peptides and their corresponding associations with T-cell receptors is illustrative of an applicable modelling approach in studying the host immune response to a pathogen. It further conforms to the mathematics of sampling, so the immunological system is, on average, reacting to a true molecular signal of a pathogen, and not a spurious sample based on a low sample size. It also dampens the error from a false signal of the presence of a pathogen, as in the cross-reactivity of the MHC receptor to non-pathogenic peptides[10]. Moreover, the biological systems, as well documented in animal development[74][75], are an interplay between error in biological pathways and a compensatory process that is regulatory. The robust sampling process by the host immune system is an example of this kind of regulation, so a costly immune response to non-pathogens is minimized, and detection of true infection by a pathogen is maximized. An error in the biological pathways remain, but the mere evolutionary history of vertebrates[76] is supportive that this evolved system is robust, and populations are competitive in an evolutionary context.
6.2. Deep Learning to Model Immunogenicity
6.2.1. Deep Learning Architectures
Deep learning is applicable to the biological sciences where the data are represented as a sequence of tokens, such as a genetic sequence or the structure of a protein[30][77][78][79]. Ideally, the architecture of a deep learning model has adequate data for its training step, which then leads to a capacity for making inferences, such as in ESMFold[80], a transformer-based model that robustly learns the higher order structural elements of proteins from prior data, inclusive of protein sequence and structure. Moreover, an unmodified transformer architecture is ideal for use in the natural sciences since it is frequently used by engineers and scientists. For the immunological pathways, there is more than one approach in use of the transformer.
In the case of a pathogen that is genetically responding to a host, an approach to modelling this phenomenon is by collecting genetic and envionmental data, where the latter corresponds to the interactions between pathogen and host. The sequence-based transformer model is applicable for this kind of data and in making predictions on the evolutionary response. However, the data requirements would be high for predictiveness on the evolution of a pathogen. Another method, as described in the above section, is to focus on part of an immunological pathway, such as the probability of the formation of a protein complex between MHC and small peptide, given this association is supported by an accurate model. In this case, deep reinforcement learning is applicable, as it combines deep and reinforcement learning methods[81][82]. In reinforcement learning methods, an agent learns a policy by taking actions and receiving rewards. This is an useful approach to biological problems of high complexity, including their very large space of possible states, as observed in the genetics and environment of a biological cell. In the case of the evolution of a pathogen, it is possible to train a model where the genetic sequence of the pathogen is the agent, genetic substitution is the action, and the MHC-peptide model assigns the reward for genetic modification[83].
A third approach is to use the recent prompting methods in deep learning[84]. A diversity of deep learning models can serve as modules where the interconnections between them are written in the form of computer code, such as in the Python language. One module would be designated to run a program to compute the probabililty of MHC-peptide complex formation. Another module would generate the sequence data for input, while a third module would serve as a database that receives, processes, and stores the results. This is a similar and slower method as compared to deep reinforcement learning, but it is closer to an informatics pipeline of programs and data. It is both an extensible and recursive learning approach, where each module has a separate role, including that of making a decision or running an external tool[85]. The mechanism to connect the modules, the Python code, is a relatively simple language for modifying and testing new procedures in an overall informatics scheme. The code is essentially the "glue" that binds the modules together. This approach also allows for integration between local and remotely situated models, an efficient scheme where each model is highly specific for a purpose.
The above modular approach to deep learning systems is similar to the mixture of experts model (MoE)[86]. In deep learning, MoE is expected to have a gating neural network which routes data among the other networks and their specialized tasks. Advantages of the above modular approach is that deep learning models can be worked on independently and a separate model can validate the output from the individual modules in a manner that allows for human interpretation. Overall, it provides a flexible method for recursive learning and is closer to a fully meta-learning system.
6.2.2. Complexity in Deep Learning Systems
Deep learning modular systems, acting in concert, are a system with higher order of complexity. This mirrors natural systems where the elements and combinations of elements undergo natural processes that lead to higher level natural forms. This is typically referred to as an emergent property, but this observation is dependent on perspective, since it is likely that all forms, including in the smallest measurable elements, emerge from yet an underlying set of smaller elements[87]. This concept also applies to terminology in metaphysics without a physical grounding, although metaphysics may propose explanations that subsequently are shown to correspond to the mechanistic processes of natural systems. An example of this problem is in the concepts of "thinking" and "intelligence". These are loosely and often used terms to reference human capabilities, although their common definitions refer to mental processes. However, "thinking" or "intelligence" are valid as loosely formed interpretations of processes that emerge from neural systems and their networks of connections. This shows one scale of complexity at a smaller scale of the brain, while a higher order scale of complexity is arguably present in its modularity[88]. Given modularity is a design for informational efficiency, and not solely a compensation for biological constraint, then modularity may be considered exceptional in its importance to informational systems in overcoming computational limitations[89].
6.2.3. Interpolation and Extrapolation in Deep Learning
Another question in deep learning is whether learning occurs by interpolation or extrapolation[90]. LeCun and colleagues define these terms in a geometrical framework and then infer that high dimensional data is most often processed by "state-of-the-art algorithms" by extrapolation, not by interpolation (as commonly assumed)[90]. Their approach to the question is formal and scientific. In the case of biological data, as in sequence format, or molecular structure, it can then be inferred that deep learning architectures are capable of learning beyond the perceived limits of prior data and its distribution, given the presence of high dimensionality. A similar effect is observed in natural language processing in deep learning. A large pre-trained model is capable of being fine-tuned to specific tasks, therefore, the prior training step has learned and generalized a number of tasks in the broader space of all possible tasks[91]. This is a relevant concept to peptide structure and immunological questions. These are problems of high dimensionality, so use of approaches that incorporate data from other sources is relevant to this area of study. For instance, analysis of the binding between T-cell receptor and peptide are a product of atomic interactions, and, therefore, a general model of protein structure, or even use of data for other molecular structures, is expected to increase the generalizability of a deep learning model in immunobiology. This approach would ameliorate the reported deficit of structural data for modelling immunological pathways, such as TCR-peptide-MHC modelling beyond the CDR3 beta chain of the T-cell receptor[48][52], and inclusion of priors that parameterize the MHC receptor by type[22][52].
7. Conclusion
Small peptides are crucial to the functions of the immunological pathways in vertebrates. Their dynamical interactions with other molecules occur in three dimensional space, but, in the case of its association with the MHC Class 1 receptor, the linear peptide may be modelled by amino acid position and property. Otherwise, peptide structure at all scales is crucial for an accurate modelling of immunological pathways, such as in the detection of pathogenic peptides by the pathway involving pMHC and T-cell receptor. Although protein sequence and structural data are ideally available, particularly in application of deep learning models, there are other approaches to modelling these systems, such as in isolating the tractable pathways, where one example is in the formation of the peptide-MHC complex. Since these pathways are complex systems, high in dimensionality, and not well understood, it is worthwhile to employ deep learning models, or the related machine learning architectures[52], for advancement in modelling the major pathways of immunobiology, and for prediction of the evolution of pathogens in response to a vertebrate host.
Lastly, general models of immunobiology should incorporate a population level perspective, and avoid a narrow viewpoint that fully centers on the atomic arrangements. This is a suggestion to view the system at the scale of a population. The peptides of a pathogen that are generated by host immune processes are essentially a population of potentially immunogenic peptides. An evolution of the pathogen can be considered a "shift"[92] in the population of peptides. This shift in this population may or may not correspond to a change in immunogenicity in the overall peptide population. Further, the immunogenicity of peptides is largely a function of its association with an MHC receptor, detection by a T-cell receptor, and in these events leading to a downstream immune response in the host. The collection of these singular responses at the cellular level are a population of events, and a host immune response is dependent on the occurrence of a sufficiently large number of events. Where the pathogen is in interaction with the adaptive immune system of a vertebrate host, then it responds to these events by evolution, presumably by natural selection. This evolution is also a population level phenomenon. Likewise, at the cellular level, the adaptive immune system of a host is or has undergone genetic changes by recombinational and mutational processes, leading to novel populations of cells that function in this system[93][94]. Both the evolution of the pathogen, and the adaptation for immunity in the host population, are important elements of modelling the dynamical system of pathogen-host interactions.
References
- Marek Wieczorek; Esam T. Abualrous; Jana Sticht; Miguel Álvaro-Benito; Sebastian Stolzenberg; Frank Noé; Christian Freund.; Major Histocompatibility Complex (MHC) Class I and MHC Class II Proteins: Conformational Plasticity in Antigen Presentation. Front. Immunol. 2017, 8, 292, .
- Karthik Dhatchinamoorthy; Jeff D. Colbert; Kenneth L. Rock.; Cancer Immune Evasion Through Loss of MHC Class I Antigen Presentation. Front. Immunol. 2021, 12, 636568, .
- Bjoern Peters; Morten Nielsen; Alessandro Sette.; T Cell Epitope Predictions. Annu. Rev. Immunol. 2020, 38, 123-145, .
- Victor H. Engelhard.; Structure of peptides associated with MHC class I molecules. Curr. Opin. Immunol. 1994, 6, 13-23, .
- Mark M. Davis; Pamela J. Bjorkman; T-cell antigen receptor genes and T-cell recognition. Nat. 1988, 335, 744-744, .
- Thomas Serwold; Federico Gonzalez; Jennifer Kim; Richard Jacob; Nilabh Shastri.; ERAAP customizes peptides for MHC class I molecules in the endoplasmic reticulum. Nat. 2002, 419, 480-483, .
- H Clevers; The T Cell Receptor/Cd3 Complex: A Dynamic Protein Ensemble. Annu. Rev. Immunol. 1988, 6, 629-662, .
- Argyrios N Theofilopoulos; Dwight H Kono; Roberto Baccala.; The multiple pathways to autoimmunity. Nat. Immunol. 2017, 18, 716-724, .
- Yasushi Uemura; Satoru Senju; Katsumi Maenaka; Leo Kei Iwai; Shinji Fujii; Hiroki Tabata; Hirotake Tsukamoto; Shinya Hirata; Yu-Zhen Chen; Yasuharu Nishimura; et al. Systematic Analysis of the Combinatorial Nature of Epitopes Recognized by TCR Leads to Identification of Mimicry Epitopes for Glutamic Acid Decarboxylase 65-Specific TCRs. null 2003, 170, 947-960, .
- Tyler Borrman; Brian G Pierce; Thom Vreven; Brian M Baker; Zhiping Weng; High-throughput modeling and scoring of TCR-pMHC complexes to predict cross-reactive peptides. Bioinform. 2020, 36, 5377-5385, .
- Jörg Christoph Prinz; Immunogenic self-peptides - the great unknowns in autoimmunity: Identifying T-cell epitopes driving the autoimmune response in autoimmune diseases. Front. Immunol. 2023, 13, 1097871, .
- Yusuke Yanagi; Yasunobu Yoshikai; Kathleen Leggett; Stephen P. Clark; Ingrid Aleksander; Tak W. Mak; A human T cell-specific cDNA clone encodes a protein having extensive homology to immunoglobulin chains. Nat. 1984, 308, 145-149, .
- Stephen M. Hedrick; David I. Cohen; Ellen A. Nielsen; Mark M. Davis; Isolation of cDNA clones encoding T cell-specific membrane-associated proteins. Nat. 1984, 308, 149-153, .
- Qi Yang; J. Jeremiah Bell; Avinash Bhandoola; T-cell lineage determination. Immunol. Rev. 2010, 238, 12-22, .
- Janko Nikolich-Žugich; Mark K. Slifka; Ilhem Messaoudi; The many important facets of T-cell repertoire diversity. Nat. Rev. Immunol. 2004, 4, 123-132, .
- K. Maude Ashby; Kristin A. Hogquist.; A guide to thymic selection of T cells. Nat. Rev. Immunol. 2023, null, 1-15, .
- Jason T. George; David A. Kessler; Herbert Levine.; Effects of thymic selection on T cell recognition of foreign and tumor antigenic peptides. Proceedings of the National Academy of Sciences 2017, 114, E7875-E7881, .
- Dorinda A. Smith; Dori R. Germolec.; Introduction to Immunology and Autoimmunity. Environ. Heal. Perspect. 1999, 107, 661, .
- J Klein; F Figueroa; Evolution of the major histocompatibility complex.. null 1986, 6, 295-386, .
- Ronald N. Germain; MHC-dependent antigen processing and peptide presentation: Providing ligands for T lymphocyte activation. Cell 1994, 76, 287-299, .
- Morten Nielsen; Massimo Andreatta; Bjoern Peters; Søren Buus.; Immunoinformatics: Predicting Peptide–MHC Binding. Annu. Rev. Biomed. Data Sci. 2020, 3, 191-215, .
- Jacek Radwan; Wiesław Babik; Jim Kaufman; Tobias L. Lenz; Jamie Winternitz.; Advances in the Evolutionary Understanding of MHC Polymorphism. Trends Genet. 2020, 36, 298-311, .
- Jorde, L.B.; Genetic variation and human evolution. American Society of Human Genetics 2003, 7, 28-33, .
- P. J. Bjorkman; M. A. Saper; B. Samraoui; W. S. Bennett; J. L. Strominger; D. C. Wiley; Structure of the human class I histocompatibility antigen, HLA-A2. Nat. 1987, 329, 506-512, .
- Dinler A. Antunes; Didier Devaurs; Mark Moll; Gregory Lizée; Lydia E. Kavraki.; General Prediction of Peptide-MHC Binding Modes Using Incremental Docking: A Proof of Concept. Sci. Rep. 2018, 8, 4327, .
- Shutao Mei; Fuyi Li; AndrÉ Leier; Tatiana T Marquez-Lago; Kailin Giam; Nathan P Croft; Tatsuya Akutsu; A Ian Smith; Jian Li; Jamie Rossjohn; et al. A comprehensive review and performance evaluation of bioinformatics tools for HLA class I peptide-binding prediction. Briefings Bioinform. 2020, 21, 1119-1135, .
- Muhammad Saqib Sohail; Syed Faraz Ahmed; Ahmed Abdul Quadeer; Matthew R. McKay; In silico T cell epitope identification for SARS-CoV-2: Progress and perspectives. Adv. Drug Deliv. Rev. 2021, 171, 29-47, .
- Ehsan Raoufi; Maryam Hemmati; Samane Eftekhari; Kamal Khaksaran; Zahra Mahmodi; Mohammad M. Farajollahi; Monireh Mohsenzadegan.; Epitope Prediction by Novel Immunoinformatics Approach: A State-of-the-art Review. Int. J. Pept. Res. Ther. 2019, 26, 1155-1163, .
- Philip Bradley.; Structure-based prediction of T cell receptor:peptide-MHC interactions. eLife 2023, 12, e82813, .
- John Jumper; Richard Evans; Alexander Pritzel; Tim Green; Michael Figurnov; Olaf Ronneberger; Kathryn Tunyasuvunakool; Russ Bates; Augustin Žídek; Anna Potapenko; et al. Highly accurate protein structure prediction with AlphaFold. Nat. 2021, 596, 583-589, .
- Yang Zhang; Jeffrey Skolnick; Scoring function for automated assessment of protein structure template quality. Proteins: Struct. Funct. Bioinform. 2004, 57, 702-710, .
- Adam Zemla.; LGA: a method for finding 3D similarities in protein structures. Nucleic Acids Res. 2003, 31, 3370-3374, .
- Julia Koehler Leman; Pawel Szczerbiak; P. Douglas Renfrew; Vladimir Gligorijevic; Daniel Berenberg; Tommi Vatanen; Bryn C. Taylor; Chris Chandler; Stefan Janssen; Andras Pataki; et al. Sequence-structure-function relationships in the microbial protein universe. Nat. Commun. 2023, 14, 1-11, .
- Randi Vita; James A. Overton; Jason A. Greenbaum; Julia Ponomarenko; Jason D. Clark; Jason R. Cantrell; Daniel K. Wheeler; Joseph L. Gabbard; Deborah Hix; Alessandro Sette; et al. The immune epitope database (IEDB) 3.0. Nucleic Acids Res. 2014, 43, D405-D412, .
- Kristin Johnson; Natural history as stamp collecting: a brief history. Arch. Nat. Hist. 2007, 34, 244-258, .
- Michael Frede. Plato’s Sophist on False Statements; In The Cambridge Companion to Plato; Richard Kraut, Eds.; Cambridge University Press: Cambridge, United Kingdom, 1992; pp. 397-424.
- S A Bero; A K Muda; Y H Choo; N A Muda; S F Pratama; Similarity Measure for Molecular Structure: A Brief Review. null 2017, 892, 012015, .
- Jinrui Xu; Yang Zhang; How significant is a protein structure similarity with TM-score = 0.5?. Bioinform. 2010, 26, 889-895, .
- Pengcheng Wei; Kimberly R. Jordan; Jonathan D. Buhrman; Jun Lei; Hexiang Deng; Philippa Marrack; Shaodong Dai; John W. Kappler; Jill E. Slansky; Lei Yin; et al. Structures suggest an approach for converting weak self-peptide tumor antigens into superagonists for CD8 T cells in cancer. null 2021, 118, e2100588118, .
- 6L9M . RCSB Protein Data Bank. Retrieved 2023-9-22
- 6L9N . RCSB Protein Data Bank. Retrieved 2023-9-22
- 1HV4 . RCSB Protein Data Bank. Retrieved 2023-9-6
- Python code to help process files of 3d protein structure (PDB format) . GitHub (accessed on 19 August 2023). Retrieved 2023-8-21
- Yuhe Lianga; Ziqian Huaa; Xue Liang; Qian Xu; Guangying Lua; The crystal structure of bar-headed goose hemoglobin in deoxy form: the allosteric mechanism of a hemoglobin species with high oxygen affinity. J. Mol. Biol. 2001, 313, 123-137, .
- Hong Huang Lin; Surajit Ray; Songsak Tongchusak; Ellis L Reinherz; Vladimir Brusic; Evaluation of MHC class I peptide binding prediction servers: Applications for vaccine research. BMC Immunol. 2008, 9, 8-8, .
- Morten Nielsen; Claus Lundegaard; Peder Worning; Sanne Lise Lauemøller; Kasper Lamberth; Søren Buus; Søren Brunak; Ole Lund; Reliable prediction of T-cell epitopes using neural networks with novel sequence representations. Protein Sci. 2003, 12, 1007-1017, .
- Guobing Chen; Xinbo Yang; Annette Go; Mingming Gao; Yongqing Zhang; Alvin Shi; Xiaoping Sun; Roy A. Mariuzza; Nan-Ping Weng; Sequence and structural analyses reveal distinct and highly diverse human CD8+ TCR repertoires to immunodominant viral antigens. null 2017, 198, 125.25-125.25, .
- Christopher Szeto; Christian A. Lobos; Andrea T. Nguyen; Stephanie Gras; TCR Recognition of Peptide–MHC-I: Rule Makers and Breakers. Int. J. Mol. Sci. 2020, 22, 68, .
- Filippo Grazioli; Anja Mösch; Pierre Machart; Kai Li; Israa Alqassem; Timothy J. O’donnell; Martin Renqiang Min; On TCR binding predictors failing to generalize to unseen peptides. Front. Immunol. 2022, 13, 1014256, .
- Sinu Paul; Nathan P. Croft; Anthony W. Purcell; David C. Tscharke; Alessandro Sette; Morten Nielsen; Bjoern Peters; Benchmarking predictions of MHC class I restricted T cell epitopes in a comprehensively studied model system. PLOS Comput. Biol. 2020, 16, e1007757, .
- Jonathan W. Yewdell; Jack R. Bennink; IMMUNODOMINANCE IN MAJOR HISTOCOMPATIBILITY COMPLEX CLASS I–RESTRICTED T LYMPHOCYTE RESPONSES. Annu. Rev. Immunol. 1999, 17, 51-88, .
- Yicheng Gao; Yuli Gao; Yuxiao Fan; Chengyu Zhu; Zhiting Wei; Chi Zhou; Guohui Chuai; Qinchang Chen; He Zhang; Qi Liu; et al. Pan-Peptide Meta Learning for T-cell receptor–antigen binding recognition. Nat. Mach. Intell. 2023, 5, 236-249, .
- PanPep . Pan-Peptide Meta Learning for T-Cell Receptor-Antigen Binding Recognition. Retrieved 2023-9-18
- Francis Sahngun Nahm; Receiver operating characteristic curve: overview and practical use for clinicians. Korean J. Anesthesiol. 2022, 75, 25-36, .
- Zuly E. Parra; Michelle L. Baker; Ryan S. Schwarz; Janine E. Deakin; Kerstin Lindblad-Toh; Robert D. Miller; A unique T cell receptor discovered in marsupials. null 2007, 104, 9776-9781, .
- Bassing, C.H., Alt, F.W., Hughes, M.M., D'Auteuil, M., Wehrly, T.D., Woodman, B.B., Gärtner, F., White, J.M., Davidson, L. and Sleckman, B.P.; Recombination signal sequences restrict chromosomal V (D) J recombination beyond the 12/23 rule. Nature 2000, 405, 583-586, .
- E E Max; J G Seidman; P Leder; Sequences of five potential recombination sites encoded close to an immunoglobulin kappa constant region gene.. null 1979, 76, 3450-3454, .
- D R Davies; E A Padlan; S Sheriff; Antibody-Antigen Complexes. Annu. Rev. Biochem. 1990, 59, 439-473, .
- Brennan Abanades; Wing Ki Wong; Fergus Boyles; Guy Georges; Alexander Bujotzek; Charlotte M. Deane; ImmuneBuilder: Deep-Learning models for predicting the structures of immune proteins. Commun. Biol. 2023, 6, 1-8, .
- Richard Evans; Michael O’Neill; Alexander Pritzel; Natasha Antropova; Andrew Senior; Tim Green; Augustin Žídek; Russ Bates; Sam Blackwell; Jason Yim; Olaf Ronneberger; Sebastian Bodenstein; Michal Zielinski; Alex Bridgland; Anna Potapenko; Andrew Cowie; Kathryn Tunyasuvunakool; Rishub Jain; Ellen Clancy; Pushmeet Kohli; John Jumper; Demis Hassabis. Protein complex prediction with AlphaFold-Multimer; Cold Spring Harbor Laboratory: Woodbury, NY, United States, 2021; pp. 2021.10.04.463034.
- Jinwoo Leem; Saulo H P de Oliveira; Konrad Krawczyk; Charlotte M Deane; STCRDab: the structural T-cell receptor database. Nucleic Acids Res. 2017, 46, D406-D412, .
- Oliviero Carugo; Sándor Pongor; A normalized root-mean-spuare distance for comparing protein three-dimensional structures. Protein Sci. 2008, 10, 1470-1473, .
- J. Dunbar; A. Fuchs; J. Shi; C. M. Deane; ABangle: characterising the VH-VL orientation in antibodies. Protein Eng. Des. Sel. 2013, 26, 611-620, .
- Jinwoo Leem; Guy Georges; Jiye Shi; Charlotte M. Deane; Antibody side chain conformations are position-dependent. Proteins: Struct. Funct. Bioinform. 2018, 86, 383-392, .
- ImmuneBuilder . GitHub (accessed on 2 November 2023). Retrieved 2023-11-2
- Ekaba Bisong. Google Colaboratory; Springer Science and Business Media LLC: Dordrecht, GX, Netherlands, 2019; pp. 59-64.
- Roger A. Sayle; E.James Milner-White; RASMOL: biomolecular graphics for all. Trends Biochem. Sci. 1995, 20, 374-376, .
- H. Berman; K. Henrick; H. Nakamura; J. L. Markley; The worldwide Protein Data Bank (wwPDB): ensuring a single, uniform archive of PDB data. Nucleic Acids Res. 2007, 35, D301-D303, .
- Xinbo Yang; Mingming Gao; Guobing Chen; Brian G. Pierce; Jinghua Lu; Nan-Ping Weng; Roy A. Mariuzza; Structural Basis for Clonal Diversity of the Public T Cell Response to a Dominant Human Cytomegalovirus Epitope. J. Biol. Chem. 2015, 290, 29106-29119, .
- ClustalW . ClustalW. Retrieved 2023-11-2
- Yecheng Jason Ma; William Liang; Guanzhi Wang; De-An Huang; Osbert Bastani; Dinesh Jayaraman; Yuke Zhu; Linxi Fan; Anima Anandkumar. Eureka: Human-Level Reward Design via Coding Large Language Models; ArXiv: null, 2023; pp. 2310.12931.
- Wen-Hsiung Li; Unbiased estimation of the rates of synonymous and nonsynonymous substitution. J. Mol. Evol. 1993, 36, 96-99, .
- Paul Moss; The T cell immune response against SARS-CoV-2. Nat. Immunol. 2022, 23, 186-193, .
- W Scharloo; Canalization: Genetic And Developmental Aspects. Annu. Rev. Ecol. Syst. 1991, 22, 65-93, .
- C. H. Waddington; CANALIZATION OF DEVELOPMENT AND THE INHERITANCE OF ACQUIRED CHARACTERS. Nat. 1942, 150, 563-565, .
- Axel Meyer; Rafael Zardoya; Recent Advances in the (Molecular) Phylogeny of Vertebrates. Annu. Rev. Ecol. Evol. Syst. 2003, 34, 311-338, .
- Yoshua Bengio; Yann Lecun; Geoffrey Hinton; Deep learning for AI. Commun. ACM 2021, 64, 58-65, .
- Minjun Park; Seung-Woo Seo; Eunyoung Park; Jinhan Kim; EpiBERTope: A sequence-based pre-trained BERT model improves linear and structural epitope prediction by learning long-distance protein interactions effectively. bioRxiv 2022, bioRxiv, 2022.02.27.481241, .
- Robert Friedman; Tokenization in the Theory of Knowledge. Encycl. 2023, 3, 380-386, .
- Zeming Lin; Halil Akin; Roshan Rao; Brian Hie; Zhongkai Zhu; Wenting Lu; Nikita Smetanin; Robert Verkuil; Ori Kabeli; Yaniv Shmueli; et al. Evolutionary-scale prediction of atomic-level protein structure with a language model. Sci. 2023, 379, 1123-1130, .
- Vincent François-Lavet; Peter Henderson; Riashat Islam; Marc G. Bellemare; Joelle Pineau; An Introduction to Deep Reinforcement Learning. Found. Trends® Mach. Learn. 2018, 11, 219-354, .
- Alhussein Fawzi; Matej Balog; Aja Huang; Thomas Hubert; Bernardino Romera-Paredes; Mohammadamin Barekatain; Alexander Novikov; Francisco J. R. Ruiz; Julian Schrittwieser; Grzegorz Swirszcz; et al. Discovering faster matrix multiplication algorithms with reinforcement learning. Nat. 2022, 610, 47-53, .
- Robert Friedman; A Hierarchy of Interactions between Pathogenic Virus and Vertebrate Host. Symmetry 2022, 14, 2274, .
- Jason Wei; Xuezhi Wang; Dale Schuurmans; Maarten Bosma; Ed Chi; Quoc Le; Denny Zhou; Chain-of-thought prompting elicits reasoning in large language models. Advances in Neural Information Processing Systems 2022, 35, 24824-24837, .
- Wangchunshu Zhou; Yuchen Eleanor Jiang; Long Li; Jialong Wu; Tiannan Wang; Shi Qiu; Jintian Zhang; Jing Chen; Ruipu Wu; Shuai Wang; et al. Agents: An Open-source Framework for Autonomous Language Agents. arXiv 2023, null, arXiv: 2309.07870, .
- Saeed Masoudnia; Reza Ebrahimpour; Mixture of experts: a literature survey. Artif. Intell. Rev. 2012, 42, 275-293, .
- Kirk, G.S.; Raven, J.E.. The Presocratic Philosophers; null, Eds.; Cambridge University Press: London, UK, 1957; pp. null.
- Baslow, M.H.; The vertebrate brain, evidence of its modular organization and operating system: insights into the brain’s basic units of structure, function, and operation and how they influence neuronal signaling and behavior. Frontiers in Behavioral Neuroscience 2011, 5, 5, .
- Lazaros K. Gallos; Mariano Sigman; Hernán A. Makse; The Conundrum of Functional Brain Networks: Small-World Efficiency or Fractal Modularity. Front. Physiol. 2012, 3, 123, .
- Randall Balestriero; Jerome Pesenti; Yann LeCun; Learning in High Dimension Always Amounts to Extrapolation. arXiv 2021, null, arXiv: 2110.09485, .
- Xueyan Zou; Zi-Yi Dou; Jianwei Yang; Zhe Gan; Linjie Li; Chunyuan Li; Xiyang Dai; Harkirat Behl; Jianfeng Wang; Lu Yuan; Nanyun Peng; Lijuan Wang; Yong Jae Lee; Jianfeng Gao. Generalized Decoding for Pixel, Image, and Language; Institute of Electrical and Electronics Engineers (IEEE): Piscataway, NJ, United States, 2023; pp. 15116-15127.
- Katsuhisa Nakajima; The mechanism of antigenic shift and drift of human influenza virus. null 2003, 61, 1897-1903, .
- Chanchan Xiao; Zhiyao Ren; Bei Zhang; Lipeng Mao; Guodong Zhu; Lijuan Gao; Jun Su; Jiezhou Ye; Ze Long; Yue Zhu; et al. Insufficient epitope-specific T cell clones are responsible for impaired cellular immunity to inactivated SARS-CoV-2 vaccine in older adults. Nat. Aging 2023, 3, 418-435, .
- Qian Qi; Yi Liu; Yong Cheng; Jacob Glanville; David Zhang; Ji-Yeun Lee; Richard A. Olshen; Cornelia M. Weyand; Scott D. Boyd; Jörg J. Goronzy; et al. Diversity and clonal selection in the human T-cell repertoire. null 2014, 111, 13139-13144, .