Gravity centre watchdog alarm, called a GC-WatchdogAlarm, monitors the condition of the press stamping and warns us when a pattern appears that we consider outside the correct working standards. To this end, two restrictions have been defined that must not be complied with: one is that there should be no deviation in the stamping and the second is that there should be no difference between each of the force values for each press position greater than usual. The GC-WatchdogAlarm tool runs every 24 h, analysing all the stamping parts made during a day of production. In the case of finding an anomaly, it generates an alarm that is sent to the maintenance team in order to perform a deep analysis of what happened. This is a good tool to take advantage of when making decisions.
1. Alarm Limit Calculation
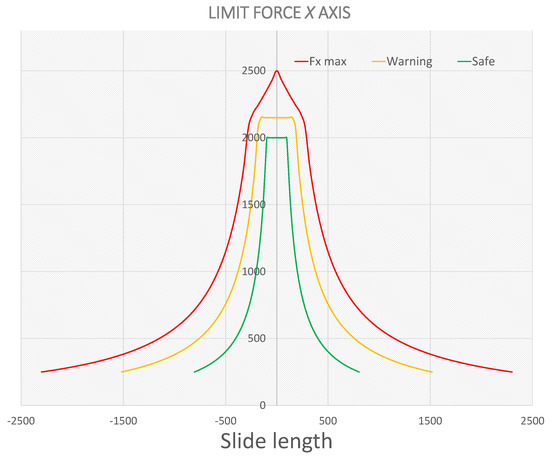
In order to know when the press begins to work with an anomalous behaviour, safety limits have been defined within the pyramid of the press that indicate the degree of malfunction. They have been classified as follows: “under surveillance” behaviour, when it exceeds the defined limit in green; “warning” behaviour, when it exceeds the yellow line; and “urgent revision” behaviour, when values outside the red limit occur. The limit values are calculated as 33% and 66% of the limit value established by the manufacturer. These limits can be seen in the following Figure 9.
Figure 9. Gravity centre safety limits.
As long as the GC value remains within the green zone, this will be considered normal and the alarm sending system will not perform any action after the analysis. When the first limit is exceeded, an alarm is generated to monitor the behaviour of the press. At this point, it is determined whether it is a random anomaly that will not happen again or a repetitive event of strokes outside the normal work area. If this happens, then the person in charge will be notified so that the necessary measures can be taken. When there are values that exceed the yellow limit, the procedure to be followed is the same as just explained, but this time, a thorough inspection of the different elements involved in the stamping process is directly carried out, making the necessary adjustments to return to the normal work situation. Furthermore, finally, if the limit defined in red is exceeded, production must be stopped urgently.
2. Continuity—DBSCAN
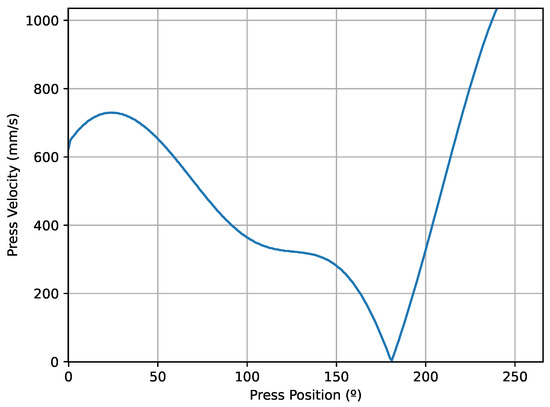
To obtain a good conformation of the piece, the deep drawing process must be continuous, so that the steel sheet slides into the die in a fluid way. The geometry of the design of many parts, together with the thicknesses of the sheets with which we work, need to meet these requirements. Failure to follow these conditions could lead to the occurrence of unfavourable events such as excess friction and wear of the die surface. In addition, the stretching of the material would not be adequate and cracks could appear. Industrial presses are designed to control the speed of the press, where the speed of raising and lowering of the die is higher than that at the time of drawing. In the following Figure 10, one can see the variation in the speed of the press in the degrees that the drawing is carried out, approximately between 100 and 180 degrees.
Figure 10. Press velocity during a cycle.
To detect possible anomalies in this continuous deformation, use of the DBSCAN [
27] algorithm is proposed. The DBSCAN algorithm is a non-parametric algorithm of grouping that is designed to form groups of points. DBSCAN requires two parameters: the maximum distance between two points
𝜖 (eps) and the minimum number of points required to form a dense area/cluster (
𝑚𝑖𝑛𝑝𝑡𝑠).
There are very efficient methods to choose the most optimal value of the parameter
𝜖, as seen in [
28], where a new method is proposed to obtain epsilon based on concepts of computational geometry, In a more specific case [
29], they were able to determine the value automatically. In the case, having such a particular pattern and with the distribution of the points similar in all the samples to be analysed, the following process will be followed to obtain the epsilon value that best fits the problem. By monitoring the state of the press at all times, the researchers have access to a record of data of thousands of cycles. Once verified that the information to be analysed has been stored under normal working conditions of the press, the maximum distances of each cycle between two consecutive points of the centre of gravity are obtained so the researchers can subsequently determine the mean of the calculated distances. This value will be the one that the researchers will use as
𝜖 when applying the DBSCAN algorithm to the data to analyse the press state.
The value of the minimum number of points, 𝑚𝑖𝑛𝑝𝑡𝑠, of a given point so that it can or cannot be classified as a core point will be 2, as this is the same number considered within the 𝑚𝑖𝑛_𝑠𝑎𝑚𝑝𝑙𝑒𝑠 in the DBSCAN algorithm. This ensures that at the moment that more than one point appears at a distance greater than what is considered normal for the stamping of the analysed part, the system notifies us by sending an alarm.
It should be noted that unlike the centred stamping analysis that is performed for all dies equally, in this case, DBSCAN will be applied differently to each of the dies used in the press. This is due to the geometry that each piece has, where the resulting force obtained will have a different behaviour depending on the drawing distance, some areas with greater depth than others or the adjustment of the die limits, among others. For these reasons, the value of
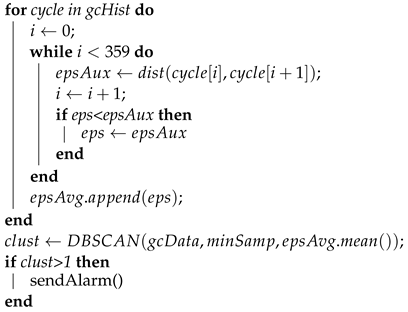
𝜖 will be different for each die. So the Algorithm 1 will be used for each car part with its specific data input.
| Algorithm 1: Abnormal Continuity Detection Algorithm |
|
Data: 𝑔𝑐𝐷𝑎𝑡𝑎: Gravity centre data of a press cycle to analyse
Data: 𝑔𝑐𝐻𝑖𝑠𝑡: History of gravity centre data
Data: 𝑚𝑖𝑛𝑆𝑎𝑚𝑝: Minimum sample for DBSCAN algorithm
𝑒𝑝𝑠←0; /*Initialise epsilon value */
𝑒𝑝𝑠𝐴𝑣𝑔←𝖺𝗋𝗋𝖺𝗒[]; /*Initialise empty array */
 |
DBSCAN was adapted and the distances were taken between points in three dimensions to obtain the number of clusters. However, if we want to obtain the epsilon of the record, and subsequently apply the algorithmic DBSCAN, this will result in a very high computational cost. To reduce the calculation time, the alternative was obtaining the number of clusters in each cycle twice in 2D, one for the data in the 𝑋−𝑍 plane and the other for the 𝑌−𝑍 plane. This is much more optimal in terms of computational cost.
This entry is adapted from the peer-reviewed paper 10.3390/s23146569