Your browser does not fully support modern features. Please upgrade for a smoother experience.
Please note this is an old version of this entry, which may differ significantly from the current revision.
Subjects:
Pharmacology & Pharmacy
In the pharmacokinetic analysis of ethanol after oral administration, only single- or two-compartment models are used, but their precision in estimating pharmacokinetic parameters might be insufficient. Pharmacokinetic parameters obtained using pharmacokinetic models differ depending on the type of model used. The estimated pharmacokinetic parameters depend on the type of model used. The classic Widmark model in particular overestimated the fraction of absorbed ethanol from the gastrointestinal system to systemic circulation.
- ethanol
- human
- mathematic model
- pharmacokinetic analysis
1. Ethanol Pharmacokinetics
Ethanol absorption occurs by the process of passive diffusion through the mucosa of the gastrointestinal system [1]. About 80% of this absorption takes place through the lining of the small intestine and the rest through the lining of the stomach. Therefore, the rate of ethanol absorption is mainly controlled by the passage of gastric content into the intestine, a process regulated by the pyloric sphincter.
Ethanol is absorbed from the gastrointestinal mucosa into the portal circulation and is therefore subject to first-pass metabolism in the liver before entering the systemic circulation. About 20% of orally consumed ethanol is thought to be metabolized by the first-pass metabolism [2]. Moreover, experimental studies have not yielded unambiguous conclusions about the major site responsible for ethanol first-pass metabolism. Namely, after discovering of the expression of the enzyme alcohol dehydrogenase (ADH) on the gastric mucosa, scientific papers were published indicating that the stomach is also responsible for the first-pass metabolism [3,4].
After absorption and first-pass metabolism, the remaining ethanol fraction is distributed in the blood, but also in other tissues such as the brain or skeletal muscle. Since ethanol is a small and hydrophilic molecule, its volume of distribution depends on total body water (TBW). Therefore, in studies, the dose of ethanol administered should be adjusted to either TBW or body weight so that the effects of ethanol on the body can be adequately assessed [5]. The total body water, and thus the volume of ethanol distribution, depends on gender and age. According to the literature, the volume of distribution of ethanol is 0.6 L/kg in women and 0.7 L/kg in men [6].
The major elimination pathway of ethanol (90–98%) occurs in the liver through oxidation to acetaldehyde. Other elimination pathways include conjugation of ethanol with the glucuronide and sulphate molecules and excretion of the resulting products in the urine, as well as excretion of non-metabolized ethanol in urine, exhalation, and sweat [5,7]. The oxidative metabolism of ethanol to acetaldehyde involves two enzyme systems. The first enzyme, ADH, is found in the cytoplasm of hepatocytes and metabolizes 85% of ethanol. The other is CYP2E, whose expression is induced by frequent consumption of alcohol, which explains higher ethanol elimination rates in frequent consumers. The range of the blood ethanol elimination rate is 0.10–0.25 g/(L × h) [8,9,10].
2. Factors Affecting Ethanol Absorption
Gastric emptying is the single most important factor controlling the absorption of ethanol from the gastrointestinal system into the bloodstream [5]. There is no unequivocal opinion in the literature on the mechanism by which gastric emptying affects ethanol absorption. Some researchers emphasize the importance of gastric ADH, which metabolizes ethanol even before its absorption into the portal circulation. On the other hand, by slowing down gastric emptying, the inflow of ethanol into the portal circulation or liver is slowed down. Due to the saturation kinetics of ADH, under the conditions of slow gastric emptying, the fraction of ethanol that is degraded in first-pass metabolism in the liver increases [11].
The presence of food in the stomach, that is, the consumption of alcohol together with food, slows down gastric emptying, and affects the concentration of ethanol in the blood. Several studies have shown that, in the presence of food, the maximum concentration of ethanol in the blood, the time to reach the maximum concentration, and the area under the concentration curve decrease [12,13,14].
The non-caloric sodas have increasingly been used in alcohol-based cocktail preparation. Moreover, it is known that the concentration of ethanol in the blood after consuming an alcoholic cocktail with low-caloric juice is higher than after consuming the same amount of ethanol in a cocktail sweetened with sucrose (standard sweetener), and this effect is attributed to gastric emptying [15,16,17]. In all the studies so far on the effects of low-calorie sweeteners on blood ethanol concentration, artificial sweeteners such as cyclamate and aspartame have been used.
Since the liver is the main organ of ethanol elimination, increased blood flow through the liver leads to faster elimination of ethanol from the body [10]. Consumption of a caloric meal increases blood flow through the portal vein by 52–107%, and thus the consumption of alcohol with a meal can lead to a decrease in the concentration of ethanol in the blood due to increased elimination in the liver [18].
3. Mathematical Modelling of Ethanol Pharmacokinetics
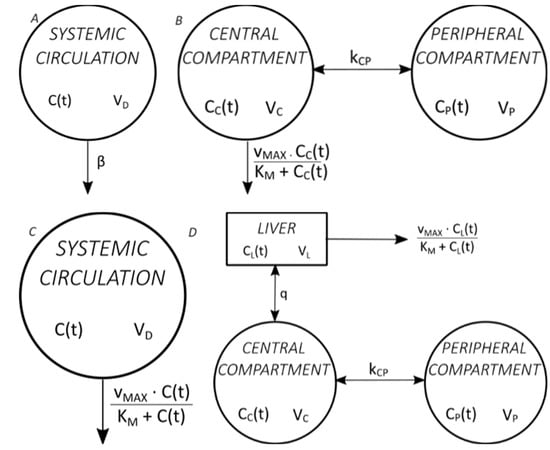
Figure 1 shows four commonly used mathematical models of ethanol pharmacokinetics [19].
Figure 1. Commonly used mathematical models of ethanol pharmacokinetics. (A) The classic Widmark model, with one distribution compartment and elimination by zero-order kinetics [20], (B) the Norberg model, with two distribution compartments and elimination by Michaelis–Menten kinetics [21], (C) the Wilkinson model, with one distribution compartment and elimination by Michaelis–Menten kinetics [22], (D) the Norberg model, with two distribution compartments and liver as a separate compartment and elimination by Michaelis–Menten kinetics from the liver [23].
Pharmacokinetic parameters obtained using pharmacokinetic models differ depending on the type of model used. Most ethanol pharmacokinetic studies are used to determine the volume of distribution and elimination parameters (β, KM, vMAX) so that ethanol is administered intravenously. Although mathematical models of ethanol absorption from the gastrointestinal system have been described and, although ethanol is administered orally in everyday life, only simple single- or two-compartment models are used in the mathematical modelling of oral ethanol administration [10,24]. The Norberg model with three compartments (two compartments of distribution and the liver as a separate compartment) is also called semi-physiological because it describes the ethanol pharmacokinetics most accurately of all models. However, the disadvantage of its use is that it determines pharmacokinetic parameters after intravenous administration [25].
Furthermore, some studies with more physiological models were recently published. Crowell et al. published a physiologically based pharmacokinetic model for ethyl acetate and ethanol but following intravenous application and inhalation exposure [26]. Pastino et al. published a seven-compartment model of ethanol pharmacokinetics in mice [27]. Sultatos et al. developed a computational eight-compartment model but did not validate it in a human study [28]. Umulis et al. conducted a validation of their five-compartment physiological model but using experimental data from previous studies [29].
This entry is adapted from the peer-reviewed paper 10.3390/toxics11090793
This entry is offline, you can click here to edit this entry!