Your browser does not fully support modern features. Please upgrade for a smoother experience.
Please note this is an old version of this entry, which may differ significantly from the current revision.
With the popularization of lung cancer screening, many persistent subsolid nodules (SSNs) have been identified clinically, especially in Asian non-smokers.
- subsolid nodules
- interval growth
- overdiagnosis
- lung cancer
1. Introduction
With the popularization and application of low-dose computed tomography (LDCT) screening for lung cancer worldwide, a high prevalence of early lung adenocarcinoma spectra manifesting as subsolid nodules (SSNs) have been identified, especially in Asian countries [1,2,3,4,5]. The American National Lung Screening Trial, a clinical randomized trial, has verified that compared to the chest radiograph screening group, an LDCT lung screening in high-risk smoking groups can reduce the lung cancer mortality by 20%, and improve the all-cause mortality by 6.7% [6]. A recent systematic review and meta-analysis has demonstrated that the current evidence supports a significant reduction in lung cancer-related mortality with the utilization of LDCT for lung cancer screening in high-risk populations with heavy smoking exposure [7]. However, there is limited evidence regarding the optimal screening frequency and interval period. Randomized trials are still ongoing for LDCT lung cancer screening in non-smokers. However, several cohort studies have observed that the implementation of lung cancer screening in Asian non-smoking groups can gradually reduce lung cancer mortality with each passing year [8,9]. Unfortunately, relevant studies have also found that with an increase in the volume of LDCT lung cancer screening, the rate of overdiagnosis will also increase [3,10,11]. Most lung cancers in Asian non-smokers are lung adenocarcinoma spectrum lesions manifesting as SSNs. Therefore, an efficient evaluation of these SSNs with heterogeneous growth trends will become a major clinical issue in lung cancer screening programs for Asian non-smoking populations [12]. SSNs can be categorized as pure ground-glass nodules (pGGNs) or part-solid nodules (PSNs) according to the guidelines of the Fleischner Society for the management of SSNs [13,14]. Furthermore, in the context of a lung cancer screening setting, Lung-RADS offers appropriate guideline for managing SSNs [15]. According to previous literature reviews, as high as 90% of persistent pulmonary SSNs are early lung adenocarcinoma spectrum lesions after 3–6 months of follow up [16,17]. In the context of the subsolid nodules definition, persistent SSNs generally mean that there is no significant resolution or disappearance of the nodule observed within a three-month follow-up period [18]. Persistent SSNs presenting as lung cancer are often lung adenocarcinoma spectrum lesions, including atypical adenomatous hyperplasia, adenocarcinoma in situ, minimally invasive or invasive adenocarcinomas according to the histopathologic classification of adenocarcinoma of the lung, as reported by the International Association for the Study of Lung Cancer [19]. According to the 2021 WHO Classification of Lung Tumors, atypical adenomatous hyperplasia and adenocarcinoma in situ lesions are classified as precursor glandular lesions [20].
2.1. SSNs Interval Growth with an Increase of ≥2 mm
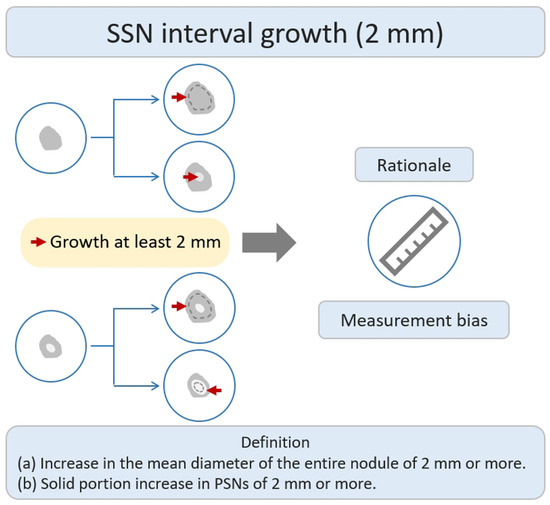
Many studies have investigated the natural growth course and relevant risk factors of SSNs based on the definition of growth of ≥2 mm in lung nodules by their longest diameter [21,22,25,26,29,30,31,32,33,34,35,36]. According to previous studies addressing the interval change in SSN measurement of <2 mm subjected to measurement bias, an increase of ≥2 mm in size was considered significant in the definition of SSN interval growth (Figure 2) [26,37]. In addition, different acquisition parameters and kernel reconstruction could introduce measurement bias in assessing nodule interval growth [38]. However, the nodule growth definition based on the 2 mm growth threshold does not allow further assessment of trends in the natural growth course of SSNs that may affect clinical outcomes or survival. The clinical management of pulmonary SSNs in lung cancer screening is often a dilemma in clinical decision making. While Lung-RADS guidelines offer clear recommendations for tracking and managing subsolid nodules, real-world scenarios may involve delays in diagnosis due to patient anxiety and concerns regarding nodule growth. Pulmonologists may also have concerns about potential medical litigation resulting from delays in diagnosis. On one end of the scale, the over management of small pGGNs (usually defined as a nodular diameter of less than 10 mm) meeting the 2 mm growth threshold may lead to increased overdiagnosis. The other end of the scale uses a follow-up strategy to monitor the subsolid pulmonary nodules. The delay in diagnosis and its impact on survival prognosis have considerable clinical implications for patients. According to a recent systematic review and meta-analysis clarifying the risk factors for SSN growth based on the definition of a nodule growing > 2 mm in diameter, male sex, history of lung cancer, a nodule size > 10 mm, nodule consistency, and age > 65 years were independent risk factors for SSN growth during the follow-up period of 24.2–112 months [39]. For pGGNs growth prediction, eight clinical or radiologic features, including male sex, smoking history, nodule size > 10 mm, larger nodule size, air bronchogram, higher mean CT attenuation, well-defined border, and lobulated margin, were independent risk factors. In the era of widespread lung cancer screening and to prevent overdiagnosis or delays in diagnosis and management, the implementation of risk-based follow-up guidelines for subsolid nodules (SSNs) or ground-glass nodules (GGNs) can assist in clinical decision-making and follow-up strategies. However, future research is needed to clarify the prediction of the growth threshold that affects the clinical prognosis or morbidity in patients with SSNs.
Figure 2. Definition, theoretical rationale, and clinical values based on interval growth threshold of 2 mm in SSN. The definition of growth (a & b) has been explained above. PSN, part-solid nodule; SSN, subsolid nodule.
2.2. SSNs Interval Growth with an Increase of ≥5 mm
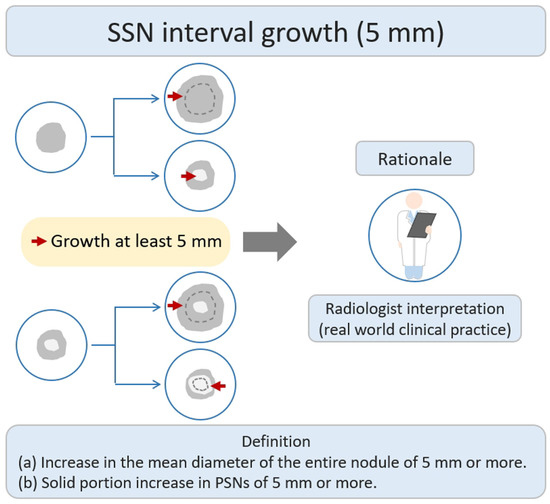
According to a previous literature review, some studies have defined nodule growth based on a growth threshold of ≥5 mm [21]. The main research rationale was that the growth threshold of 5 mm was the obvious or substantial SSNs interval growth during the follow-up period of CT scans through a visual assessment by radiologists or clinical physicians (Figure 3). Based on the nodule growth threshold of 5 mm, clinicians and radiologists can easily evaluate and compare the growth changes of nodules visually before and after the CT; defining an interval growth threshold of 5 mm is clinically feasible for clinical practice in the real-world setting. Tang et al. investigated the natural course of SSN in terms of substantial SSN growth based on the definition of an obvious increase of ≥5 mm in SSNs or solid portion in PSN from the baseline CT scan to detect substantial interval growth during interval CT scans [21]. Tang et al. demonstrated that the PSN group had a significantly higher growth rate than the GGN group in terms of substantial SSN growth. PSN group had an estimated 67.3% growth rate during the 5-year follow up. GGN group had an estimated 10.6% growth rate during the follow up.
Figure 3. Definition, theoretical rationale, and clinical value based on interval growth threshold of 5 mm in SSN. The definition of growth (a & b) has been explained above. PSN, part-solid nodule; SSN, subsolid nodule.
The mean growth time for GGNs to reach a growth threshold of 5 mm was 9.426 years, whereas the PSN group had a mean growth time of 3.960 years to reach the threshold. Compared with a growth threshold of 2 mm, a growth threshold of 5 mm is more suitable for time-series clinical or radiologic evaluation of interval growth in SSNs. For example, one 3 mm GGN grows to 6 mm after 6 years, and such a GGN lesion meets the growth threshold of only 2 mm. A 6 mm GGN is very likely to be a pre-cancerous lesion or carcinoma in situ according to the pathological classification of the lung adenocarcinoma spectrum (Figure 4) [40].
2.3. SSNs Interval Growth with Clinical Stage Shift
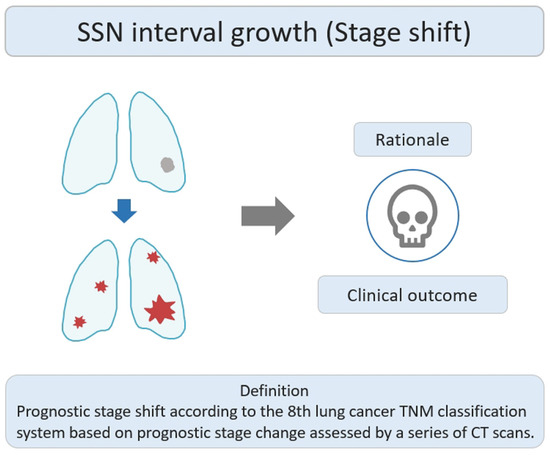
Stage-shift growth refers to the change in the prognostic stage based on the 8th lung cancer TNM classification system described in the previous relevant studies, assessed through CT scans [43]. It primarily reflects the transition between different stages (e.g., from II to III or 0 to I) and is influenced by the AJCC 8th edition of TNM staging, which considers the impact of interval growth progression on lung cancer survival prognosis. The clinical stage shift as the nodule growth threshold can be used as an important clinically personalized lung cancer prognostic indicator. Clinically, if the interval growth of nodules reaches this threshold, it may lead to a worse prognosis in patients with SSNs. The study rationale for the research lies in using the growth threshold of stage shift to identify the interval growth of SSNs and its correlation with prognostic clinical outcomes, as shown in Figure 5. Therefore, surgical interventions or clinical treatment strategies should be implemented promptly to avoid delayed diagnosis and management. Several studies have investigated the natural course of SSNs based on the definition of stage-shift interval growth from a baseline CT scan to detect stage-shift growth during interval CT scans [21,27].
Figure 5. Definition, theoretical rationale, and clinical values based on interval growth threshold of stage shift in SSN. The visual illustration entails a single lung nodule’s evolution (gray color) into advanced lung cancer. Concurrently, numerous lung nodules (red color) emerge, indicating metastases and prompting a shift in the disease stage. CT, computed tomography; SSN, subsolid nodule.
The mean growth time for GGNs to reach the growth threshold of the stage shift was 12.168 years, whereas the PSN group had a mean growth time of 7.198 years to reach the threshold point. Based on the interval growth threshold of stage shift in SSNs, clinicians and radiologists can identify high-risk SSNs based on initial CT parameters or clinical risk factors. By assessing the CT imaging characteristics and clinical profiles, they can predict further prognostic growth of these nodules. This information helps in determining the appropriate management strategy for patients with SSNs in order to identify any potential progression to invasive lung cancer associated prognostic outcome or stage-shift change. It also observed that certain clinical scenarios are particularly prone to rapidly worsening prognoses in patients presented with atypical peri-fissure SSNs [44]. Since atypical peri-fissure SSNs may be regarded as atypical peri-fissure nodules clinically, it is considered clinically benign without close follow up. However, since the lesion is close to the pleura surface or inter-fissure space, it is more likely to spread or metastasize along the inter-fissure space clinically [45,46].
2.4. SSNs Interval Growth with Volumetric Assessment
Previous studies have used volumetric measurements to assess the interval growth change in SSNs [47,48,49,50,51,52,53]. Generally, the nodular volume can be measured in two ways. One is to measure the longest nodular diameter to calculate the volume. The other method involves segmenting and delineating the nodules to calculate the volume [54].
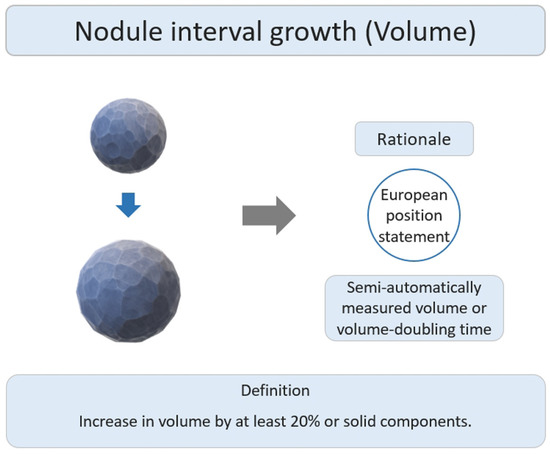
The main research rationale was that the European position statement recommended lung cancer screening follow up based on semi-automatically measured volume or volume-doubling time assessment of solid nodules (Figure 7) [55]. Several studies have reported the interval growth of pulmonary SSNs as a growth threshold of 20–30% volumetric increase for growth evaluation [47,48,49,50,51,52]. Previous studies have demonstrated that diameter-based assessments may overestimate the actual growth, as compared to growth assessments based on volume-based measurements [54].
Figure 7. Definition, theoretical rationale, and clinical value based on interval growth threshold of volumetric assessment in subsolid nodules.
2.5. SSNs Interval Growth with Radiomic Assessment
Previous studies have demonstrated that radiomic assessment has achieved a good diagnostic performance in SSN interval growth pattern [59,60,61,62]. Gao et al. showed that the combined clinical and radiomic model showed good performance with an area under the curve (AUC) of 0.801 in predicting the 2 mm growth threshold of GGNs [59]. Furthermore, Sun et al. demonstrated that the radiomics model outperformed conventional radiographic parameters in GGN interval growth prediction [60]. Limited studies have also demonstrated radiomic features associated with SSN nodules with a high growth rate or shorter volume doubling time (VDT), especially margin-related radiomic features with higher volume-based doubling times in lung adenocarcinoma lesions manifesting as SSNs [61,62].
This entry is adapted from the peer-reviewed paper 10.3390/diagnostics13162674
This entry is offline, you can click here to edit this entry!