Your browser does not fully support modern features. Please upgrade for a smoother experience.
Please note this is an old version of this entry, which may differ significantly from the current revision.
Structural health monitoring (SHM) involves the control and analysis of mechanical systems to monitor the variation of geometric features of engineering structures. Damage processing is one of the issues that can be addressed by using several techniques derived from image processing. There are two types of SHM: contact-based and non-contact methods. Sensors, cameras, and accelerometers are examples of contact-based SHM, whereas photogrammetry, infrared thermography, and laser imaging are non-contact SHM techniques.
- structural health monitoring
- crack analysis
- image processing
- machine learning
- image enhancement
1. Introduction
The process of observing structures like buildings, bridges, and even aircraft through various sensors and technologies is commonly referred to as structural health monitoring (SHM). The key aim is to recognize any change that has occurred in the structure, making sure that the structure remains secure and functioning over an extended period. Cracks are a common occurrence. Cracks are fractures or gaps that develop within materials like metals, concrete, or ceramics and are one of the critical concerns in SHM. A variety of factors can cause these fractures, including excessive stress, environmental impacts, material flaws, or natural wear. Detecting and monitoring cracks is a fundamental aspect of SHM. By utilizing SHM techniques to detect early signs of cracks, engineers and researchers can intervene promptly and implement necessary maintenance, contributing to the overall longevity and safety of the structure.
Crack incidence and propagation are two essential aspects that influence the structure’s performance [1]. When a structure is under load, and the stress level surpasses a specific threshold, the phenomenon of crack initiation occurs and propagation occurs due to an increase in the applied load. Crack propagation can lead to a deterioration in performance and even failure of the structure [2]. Hence, crack propagation analysis is a crucial issue in ensuring the quality and reliability of structures. As a result, many crack detection and propagation analysis techniques have been studied and developed throughout the previous decades in the domain of SHM and non-destructive assessments.
The conventional approach to contact detection necessitates the employment of sensors that are directly coupled with the structure to evaluate dynamic reactions, for instance, accelerometers, strain gauges, and fiber optic sensors, among others [3]. Nonetheless, various challenges abound. One such challenge is that wired contact sensors necessitate a time-consuming and labor-intensive installation process and require extensive maintenance to ensure long-term monitoring and upkeep [4]. Moreover, the magnitude of the structure and its intricate shape and dimensions exacerbate the situation [5][6].
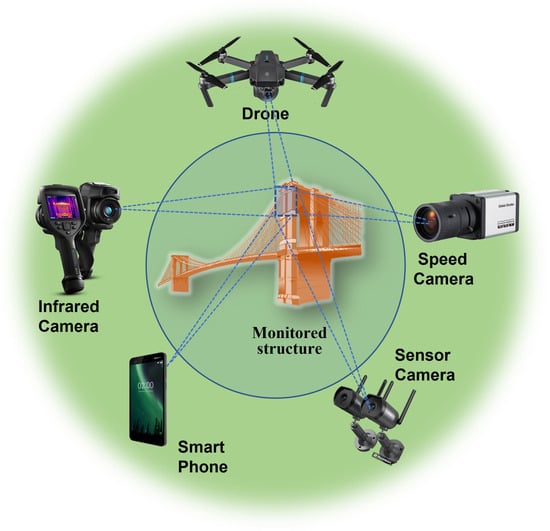
In the past few years, there has been a significant focus on the advancement of technologies that revolve around the use of alternative approaches. These include cameras, unmanned aerial vehicles, and mobile phones tailored for structural health monitoring (SHM) [7]. Recently, there has been notable progress in the development of affordable vision-sensing technology. Through the application of image and video analysis, it has become feasible to perform high-quality condition assessments of structures from remote locations [8].

2. Crack Detection Based on Image Processing Techniques
Crack detection based on image processing techniques relies on images or visual data to detect and locate cracks or fractures in various materials or structures. This approach utilizes computer algorithms and methods to analyze the visual information captured through images and then determines the presence, size, shape, and location of cracks within the material or object. Various methods of image processing are Canny edge detection, Otsu method, histogram equalization method, morphological operation, segmentation, and Sobel edge detection method. The different image processing techniques utilized to detect cracks are covered in this section [9]. Figure 1 provides the main structure for a crack detection method based on image processing. First, the high-resolution images are collected, which are captured by the camera or another imaging device [10]. The images are then preprocessed, where resizing the image, denoising, segmentation, morphology (smoothing edges), and other techniques for mitigating shadows in images may be employed. In certain instances, grayscale or binary conversion may be necessary for crack detection. The outcome derived from the preprocessing stage is subsequently implemented in the process of detecting cracks. This process involves techniques of image processing methodologies such as edge detection, segmentation, or pixel analysis to accentuate or divide the fractured region within the image. The determination of parameters necessitates the computation of distinct characteristics of the identified crack, including its depth, length, and width. These measures serve as aids in the process of decision-making concerning the seriousness of a crack [11].

Figure 1. The architecture of image-processing-based crack detection.
2.1. Image Acquisition
The process of collecting or obtaining digital pictures from different sources such as cameras, scanners, or other imaging equipment is referred to as image acquisition. The process involves converting real-world visual information into a digital format that computers can understand and manipulate. Depending on the equipment used, different factors such as exposure duration, focus, resolution, color settings, and more can be changed throughout the image capture process. After images are captured, they may be saved, analyzed, and improved by using a range of image processing techniques. Digital images may be obtained in a variety of ways, including utilizing Unmanned Aerial Systems (UAS) or a digital camera, as mentioned in [12][13][14][15][16]; accessing existing datasets [12]; or using a smart mobile phone. Figure 2 shows different types of image acquisition.

Figure 2. Different types of image acquisition.
2.2. Image Preprocessing
Image quality often degrades for several reasons, including varying lighting conditions such as sunny or cloudy skies, random textures, uneven lighting, irregular shadows, and watermarks. These aspects can have a substantial impact on the accuracy of crack identification using image processing techniques. Image preprocessing primarily consists of lowering the negative impacts of those influences, which might increase image processing efficacy. Preprocessing is a significant step in image processing because it enhances the quality of the input images and reduces noise, making subsequent processing stages more accurate in recognizing and analyzing fractures in structures. The preprocessing aims are to increase contrast, minimize noise, and optimize the picture for feature extraction and analysis.
2.3. Edge Detection Methods for Crack Detection
The term “edge” refers to the region of significant transition in image intensity or contrast. The detection of regions that possess strong intensity contrasts is commonly known as edge detection. It is plausible for a particular pixel to exhibit variability, leading to a possible misconception of it as an edge. This can occur in conditions with poor lighting or high levels of noise, both of which can display features similar to those of an edge. Therefore, it is imperative to exercise greater caution when identifying variations that may appear as edge points (pixels) [17]. The utilization of edge detection techniques enables their application in the detection of fractures. The Sobel operator, Roberts operator, Prewitt operator, and Canny operator are among the frequently used edge detection operators. The effects of these varied operators on edges of the same type differ significantly. The categorization of edge detection algorithms consists of two unique classifications, namely, Gradient-based (first derivative) and Gaussian-Based (second derivative) [18].
2.4. Traditional Segmentation Methods
Segmenting images into multiple parts holds immense value in the field of digital image processing. These segments, which are also known as image objects, are essentially sets of pixels that are characterized by specific features. The primary objective of segmentation is to simplify and/or alter the representation of an image to a more pertinent and simpler form for examination. The detection of objects and boundaries in images, such as curves and lines, is a usual application of image segmentation. Picture segmentation, on the other hand, involves assigning specific properties to pixels with the same label, thereby labeling every pixel in an image.
Thresholding-Based Segmentation
The thresholding-based segmentation process can be regarded as the process of separating foreground from background. The following algorithms could be considered as thresholding-based segmentation approaches.
- (a)
-
Global thresholding
Global thresholding is a fundamental image segmentation technique used to distinguish objects or regions of interest from the background in a grayscale picture. It is also known as global threshold segmentation or simple thresholding. It entails deciding on a single threshold value that divides pixels into two groups: foreground and background.
Shen [19] presented a method to detect road cracks from video images. Through the varied object recognition technique, the crack image was selected from moving video to track the cracks, for which the skeleton extraction algorithm was used. This algorithm grayscales the image and thresholds it using global thresholds. The image was then segmented and identified using MATLAB Version: 9.7.0 (R2019b) Update 4.
- (b)
-
Otsu thresholding
Otsu thresholding is a technique for automatically determining an optimum threshold value for picture segmentation. It seeks a threshold that reduces the intra-class variation of foreground and background pixels.
Crack detection on an airport runway pavement is frequently impacted by signs and markings; there is even a possibility that these will be mistaken for cracks, leading to lower accuracy. The research in [20] implemented a technique for crack detection that uses twice-threshold segmentation. As a first step, a more precise Otsu threshold segmentation algorithm was used to remove the road markings in the runway image. The second step involved segmenting the image with an improved adaptive iterative threshold segmentation algorithm aiming to obtain the crack image. The final crack image was obtained after the image was denoised. This was followed by denoising the image and acquiring the crack image.
- (c)
-
Adaptive thresholding Segmentation
The adaptive thresholding algorithm (ATA) is a technique employed to differentiate the crucial foreground—specifically, crack and leakage defects—from the background using the disparity in the pixel gray values of each area. This is one of the commonplace conventional approaches for image segmentation.
Senthikumar et al. [21] posited a proficient and precise method for identifying defects in metallic surfaces through an iterative thresholding technique. The proposed approach discerns the defect region, including but not limited to cracks and shrinkages, in the metal surface image by means of binarization via iterative thresholding techniques. The rationale behind the utilization of adaptive double thresholding lies in obtaining a binarized image that is capable of discriminating between the regions of the image that are affected by cracks and those that are not. The adaptive thresholding method adjusts the threshold value based on the local characteristics of the image, which can enhance the detection accuracy of cracks.
- (d)
-
Region-based Segmentation
In region-growing segmentation methods, pixels with similar features are grouped together. The study in [22] put forth an enhanced algorithm for directional region growth, which aims to identify cracks. The crack detection algorithm for photovoltaic images using a multiscale pyramid and improved region growing technique involves the following main steps: Firstly, the photovoltaic image is preprocessed, incorporating filtering techniques. A multiscale pyramid decomposition is carried out to proceed to Step 2. Following this, in Step 3, the edges of the processed image are detected and the crack profile is extracted. Subsequently, Step 4 entails optimizing edge information to eliminate suspicious edges. Finally, Step 5 involves the execution of a directed regional growth algorithm to effectively identify and complete cracks. In instances where pavement cracks exhibit desirable continuity and high contrast, the utilization of digital image processing techniques can yield favorable detection outcomes.
2.5. Morphological Operations
Morphological operations are image processing techniques that use the shape or morphology of objects in an image to perform operations. These techniques are commonly used to extract certain elements or improve specific parts of an image.
Erosion and dilation are the two most prevalent morphological procedures. Erosion is the removal of pixels from the limits of objects in a picture, whereas dilation is the addition of pixels to the boundaries of things in an image. These procedures may be used to achieve noise reduction, edge detection, segmentation, and feature extraction, among other things. The morphological operations, erosion and dilation, can be used to eliminate small parts and fill gaps in the binary image. Openings can also be used to remove small parts and smooth out the edges of existing cracks.
Morphological techniques are used to detect surface cracks because regular curve tracing methods fail to detect cracks that are non-continuous [23]. Morphological operations can enhance discontinuities in the image and join the missing pixels, making it easier to detect surface cracks. The combination of edge detection as preprocessing and filtering as postprocessing seem to be an effective way to detect surface cracks effectively. In [16], morphological processing is used to remove small cracks and fill gaps in the detected cracks, which improves the accuracy of crack detection.
2.6. Smartphone
Modern cell phones are packed with features that may be used to efficiently analyze the state of structures. Because of the ubiquity of low-cost cell phones, their mobility, big storage capacity, substantial computing power, and easily customizable software, there has been an emerging trend of employing smartphones in SHM applications. With the ubiquity and availability of low-cost cell phones, it is becoming common to use them for structural monitoring and retrofitting. Smartphones have a high potential for usage in SHM applications for large-scale buildings due to a number of appealing characteristics. Smartphone images can be useful in the field of structural health monitoring (SHM). Built-in cameras in smartphones have grown increasingly capable of shooting high-resolution photographs as smartphone technology has advanced. These pictures may be used in SHM applications to display visual information concerning structural conditions such as fractures, deformations, and other types of damage.
Smartphone photos can be used to estimate the dynamic response parameters or vibration characteristics of a structure in structural health monitoring (SHM). Visual information on the structure’s disbandment or condition may be gained by photographing it using smartphones. Following that, image processing and analysis techniques may be used to extract significant information and highlight places of interest, such as fractures or possible damage.
Images captured by smartphones can also be utilized in machine learning or deep learning algorithms for the classification or detection of cracks. These photos may be used to train algorithms that can automatically detect and categorize fractures in buildings. By feeding photos into these algorithms, they may learn the patterns and attributes associated with fractures, allowing them to identify and categorize cracks in fresh images with greater accuracy.
2.7. Unmanned Aerial Vehicle (UAV)
When the surface is inaccessible or many sensors are required to be mounted, traditional contact-based sensors cause a restriction in the cost of contact-based sensors. A UAV, or drone, has lately gained popularity as a portable option in the realm of non-contact measuring technology. With rapid advancements in UAV technology for structural health monitoring, such research outfits them with lightweight, high-resolution cameras to record photographs of the buildings’ health. Drones are often created without multiple technologies, such as several types of cameras and a Global Positioning System (GPS) to capture data during flight and analyze photos subsequently via ground control centers. UAVs are used in a variety of engineering applications, including structural health monitoring on highways.
Sankara Srinivasan [24] developed a novel algorithm for detecting cracks, which utilizes the Hat-transform in combination with HSV thresholding. By merging the outcomes of both filters, significant advancements in image quality were seen. Their approach was founded on a mathematical morphological technique, and their investigation demonstrated that the bottom-hat transform was more effective in identifying fractures than the top-hat transform. Subsequently, the former approach was paired with HSV thresholding to obtain highly accurate crack detection outcomes. The scientists additionally presented a groundbreaking idea in their investigation, which involved utilizing a drone to detect fractures in real-time. Besides, they devised a MATLAB graphical user interface (GUI) that enabled them to promptly identify and treat fractures, leading to cost savings.
3. The Role of Machine Learning Algorithms Based on Vision for Crack Detection
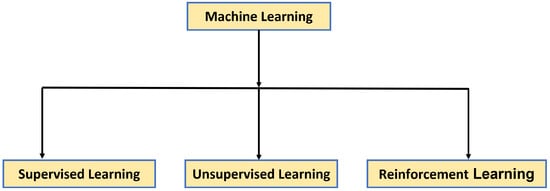
Machine learning is a subfield of artificial intelligence (AI) and computer science that enables software programs to improve their predictive accuracy without explicitly programming them to do so. As seen in Figure 3, machine learning comes in a variety of flavors. The expression “supervised learning” pertains to the procedure through which an algorithm acquires the ability to predict data from input data, and this form of learning encompasses input and output data. The system attempts to learn through reinforcement learning by interacting with the environment and rewarding good behavior while penalizing undesirable behavior. In recent years, machine learning approaches [25] have gained popularity. These techniques include support vector machines [26][27], random forest, random [28] structured forest, and neural networks [29][30].

Figure 15. Machine learning types [31].
3.1. Support Vector Machine (SVM)
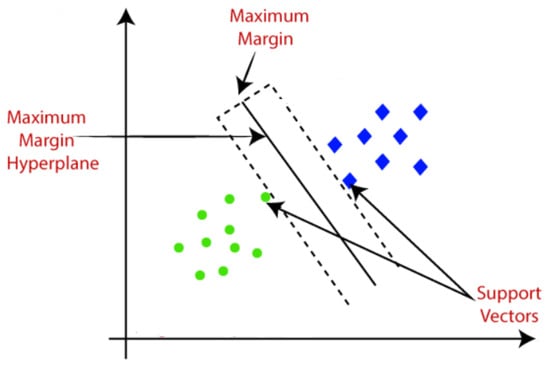
The Support Vector Machine (SVM) algorithm aids in identifying the optimal line or decision boundary, which is otherwise referred to as a hyperplane. The SVM algorithm also identifies the closest points to the lines from both classes, known as support vectors. The margin is the distance between the vectors and the hyperplane, and the objective of the SVM is to maximize this distance. The optimal hyperplane is the hyperplane with the maximum margin (see Figure 4).

Figure 4. Support Vector Machine [32].
3.2. Decision Tree Algorithm
Decision tree classifiers are utilized to create a hierarchical framework like a tree, wherein the pre-eminent characteristic is designated as the primary node while the other attributes are denoted as the branches of the tree in order to determine the ultimate classification [33]. The determination of the entropy of the system was followed by the design of a hierarchy of characteristics that aim to decrease entropy. The use of decision trees was predominantly employed as an aid to decision-making. Conversion of the input image to grayscale preceded further analysis.
Wu et al. [34] employed the contourlet transformation method, a technique based on wavelet transformation, subsequent to converting the input image into a grayscale image. After undergoing the contourlet transformation, the image was partitioned into a high-pass image and a low-pass image, which were subsequently subjected to directional filters for processing. The implementation of this technique was expected to yield a smoother detection of edges. The preprocessed images were utilized for the purpose of feature extraction via the application of the co-occurrence matrix and Tamura characteristics. The extracted features were subjected to classification using an array of ensemble techniques, such as AdaBoost, random forest, rotation forest, and RotBoost. The ensemble methods cited herein are utilized to enhance the efficacy of a classifier through the provision of support from multiple other classifiers. Variations in these methods arise from the manner in which decision trees are constructed and the amalgamation of their outcomes. The outcomes of utilizing ensemble techniques are juxtaposed with those of employing neural-network-oriented methodologies. The consequences of utilizing ensemble techniques are side-by-side with those of employing neural network-oriented methodologies.
3.3. k-Nearest Neighbor Algorithm (KNN)
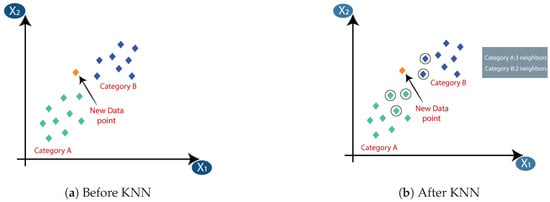
k-nearest neighbors [35] is a simplistic yet highly effective algorithm widely employed in the domain of machine learning to perform classification, pattern recognition, and regression tasks. The KNN model accomplishes this task by identifying neighboring data points through the utilization of Euclidean distance analysis conducted upon individual data points. Figure 5 illustrates the k-nearest neighbor algorithm. The three nearest neighbors are from category A; hence, this new data point must belong to category A.

Figure 5. k-nearest neighbor algorithm (KNN) [36].
3.4. Random Structured Forests
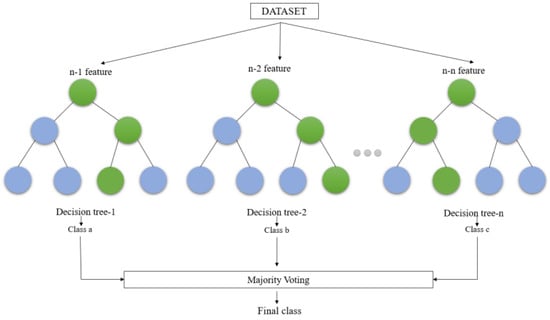
Random structured forests are a type of ensemble model that can be utilized for predicting the nearest neighbor. The fundamental principle underpinning ensemble techniques posits that the amalgamation of multiple models will yield a more robust model. In the realm of linguistic ensembles, the random forest algorithm bears a resemblance to the conventional machine learning decision tree methodology. This method begins with a single input and buckets the data according to the direction the data travel in the tree. The concept of the random forest is taken to the next level through the integration of trees with an ensemble approach. The utilization of a random forest classifier possesses the advantage of a compact runtime, effective management of imbalanced data, and the ability to handle missing data [37].
The random forest creates multiple decision trees by randomly selecting rows and features from the dataset (see Figure 6). Each decision tree learns to make predictions independently. The primary characteristics are denoted by the presence of minimal bias, which suggests that the model may perform well on the training data. However, high variability indicates that it may not be effective in generalizing to new, unseen data. This leads to a significantly more precise and resilient model able to manage diverse tasks including regression and categorization [38].

Figure 6. Generalized structure for the random forest [38].
3.5. Logistic Regression
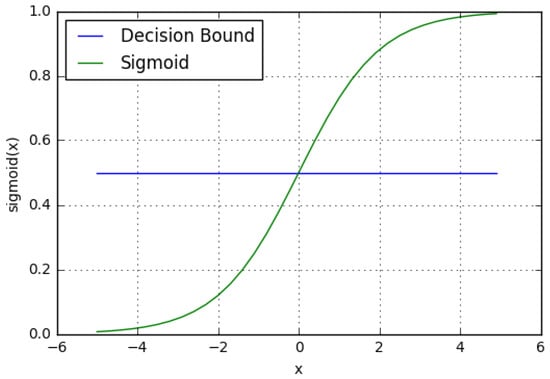
The logistic regression method is used to solve binary classification problems through supervised learning. It is a mathematical model that utilizes the logistic function to describe binary classification. There exist multiple advanced extensions of logistic regression. In essence, logistic regression involves utilizing a regression model to make predictions about whether a specific data point or entry is likely to belong to a designated class. As seen in Figure 7, logistic regression models the data using a sigmoid function with a proper decision boundary [39]. Logistic regression has a number of critical elements including ease of implementation, computational efficacy, training-based efficacy, and regularization ease. Scaling of input features is deemed to be unnecessary. Nevertheless, it is noteworthy that the ability to tackle a nonlinear problem is constrained and is susceptible to the phenomenon of overfitting.

Figure 7. Logistic regression: sigmoid function and decision boundary.
3.6. K-Means Clustering Algorithm
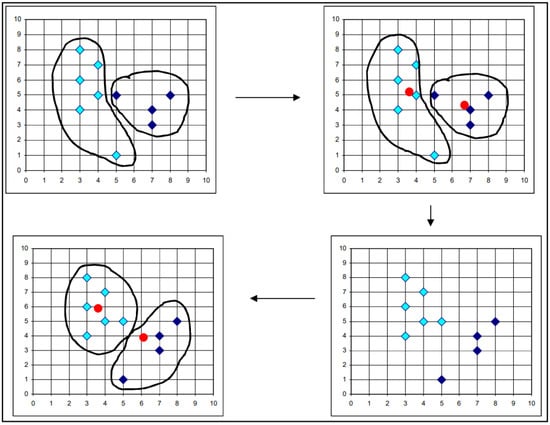
K-means is a type of unsupervised learning technique that is frequently used to perform closest-neighbor clustering. Based on their similarity, the data may be grouped into k clusters. K is an integer, and its value must be known in order for the procedure to work [40]. K-means is the most often used clustering method because it is capable of recognizing the correct cluster of fresh data based on the majority of the distance. The first selection of k-cluster centroids is made randomly; thereafter, all points are assigned to their nearest centroids and the newly constructed group’s centroids are recalculated. Because certain K-means are impacted by centroids, they are particularly susceptible to noise and outliers. One advantage of the K-method is that it is simple to apply and explain as well as effective in computing terms [41]. Figure 8 presents a graphical depiction of the K-means algorithm. The initial step consists of two sets of objects, whose centroids are then determined. The dataset clusters are formed again based on the centroids and the clusters responsible for producing the various dataset clusters are identified. In this manner, clusters are selected until the optimal ones can be ascertained [42].

Figure 8. K-means clustering algorithm process [42].
3.7. Artificial Neural Network
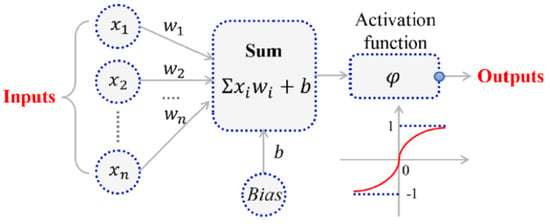
Among various classification techniques, neural networks exhibit the highest level of sophistication. Neural networks are multilayered systems with several nodes in each layer. A basic linear function is executed at each node. By altering the manipulation of the weight and influence of functions found in the nodes and by means of classification, neural networks acquire knowledge from the data provided during their training. Misclassified samples are utilized to determine the error, which is then sent back to the nodes to adjust their influence. Each node in a layer is linked to the nodes in the layer above it. As a result, a completely linked structure is built in order to establish a relationship between each aspect. Figure 9 shows that the active node of a neural network is characterized by several components. These encompass the inputs, labeled as 𝑥1 to 𝑥𝑛; the weights, shown as 𝑤1 to 𝑤𝑛; and the activation function, known as 𝜑. Additionally, the sum of the weighted input is denoted as ‘Sum’ with Bias b, while the output activation function is indicated as ‘Outputs’.

Figure 9. The architecture of the Artificial Neural Network (ANN) [43].
3.8. Deep Learning
Deep learning, a field within machine learning, employs a diverse array of nonlinear transformations. Its algorithms are capable of comprehending the interpretation of incoming data through various processing layers with sophisticated architecture. Elaborate artificial intelligence models are represented by convolutional neural networks (CNNs), deep autoencoder structures, and recurrent neural networks (RNNs). The strategies have been extensively employed across various industries, such as voice recognition and machine learning of natural language.
4. Integration of Image Processing Techniques and Dynamic Response Measurements
4.1. Motion Magnification
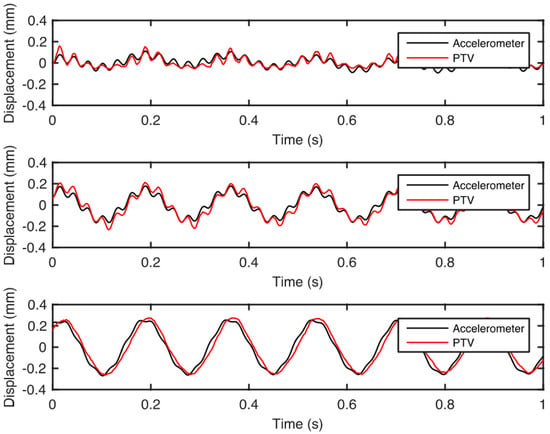
Zimmermann et al. [44] aimed to validate the applicability of a non-contact system, specifically a camera. The previously mentioned was achieved through the examination of the displacement–time records of the primary and motion-magnified recordings utilizing a particle tracking velocimetry (PTV) computation. Initially, the displacement data obtained from PTV underwent a preliminary calibration process by applying a correction factor that relates the spatial distance of the video in pixels to a known reference spatial distance of the tracked object. The structure’s natural frequencies were obtained by analyzing the power spectral density plots, and the mode shapes were extracted through subspace identification algorithms. Finally, the natural frequencies were utilized to determine the spectral range necessary for the motion magnification algorithm. The obtained signals of displacement response via PTV exhibit a strong correlation to the signals inferred through accelerometers across all three reference locations, as evidenced by the observations made in Figure 10.

Figure 10. Comparison of displacements derived via accelerometers and PTV for three reference locations [44].
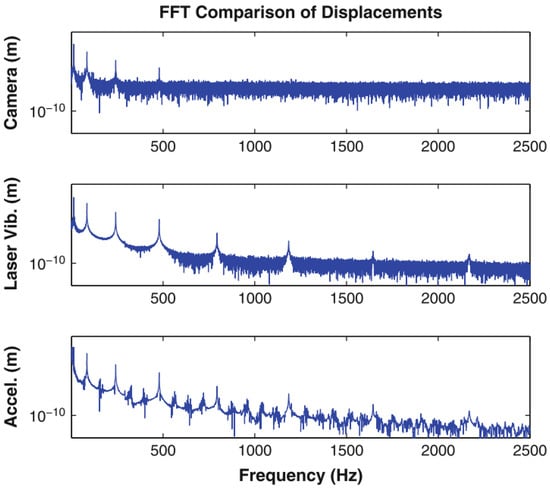
In real-world applications, the cost-effectiveness of this approach has made it a popular option for data acquisition. In the accelerometer plane, the width of the video frame was 104 mm. The cantilever beam underwent an impact from a hammer, and the resulting vibration was measured for comparative analysis. The time series of velocity obtained from the laser vibrometer was integrated to ascertain displacement, which was then cross-verified with the displacements derived from the camera measurements of the optical flow of the accelerometer movement. As there was no time synchronization between the camera and laser vibrometer datasets, the time series had to be manually aligned in the data analysis process. The laser vibrometer, accelerometer, and camera-derived displacement data were subjected to Fast Fourier Transform (FFT) and integrated to obtain displacement, thereby enabling a direct comparison of the frequency peaks and noise floors (see Figure 11) [45].

Figure 11. Frequency space comparison between displacements derived from the camera, laser vibrometer, and accelerometers [45].
4.2. Multithresholding Technique
Multithresholding is a method utilized for segmenting images into various segments based on their gray levels. In this approach, a number of thresholds are chosen for a certain image, and the image is segmented into several brightness zones corresponding to various objects and the backdrop.
A video camera was robustly implanted for capturing the frequency of small signals having a low amplitude. The presented model requires a video camera to capture videos at a proper frame rate to measure the frequency of vibration using multilevel thresholding. The normal camera utilized in the model can robustly measure the vibration occurring in the horizontal or vertical direction of the camera sensor equipped with AVI–JPEG compression. Ferrer et al. [46] put forward the proposition of searching for subpixel movements as a means of detecting changes that may only be perceptible in small bright sparkles, middle grays, or dark areas. Consequently, the identification of the specific gray levels that will be affected remains elusive. Hence, prognosticating the specific gray levels that may be impacted becomes a challenging task. Rather than constructing prognosticative models concerning alterations in illumination resulting from movement, the investigator has suggested scrutinizing pixel alterations at various levels simultaneously. The low resolution and ample amount of noise did not affect the performance of the proposed method, which robustly measures the vibration of real-world objects like bridges, loudspeakers, and forks. The presented technique proved its robustness compared with the relevant methods.
4.3. Edge Detection Techniques
Patsias and Staszewskiy [47] applied wavelet transform for the purpose of damage detection. The study presents a novel damage detection method based on optically measured mode shape data. To demonstrate the efficacy of the previous approach, they utilize a rudimentary experiment employing a cantilever beam. The proposed methodology involves analyzing the captured image sequence using a wavelet transform. This includes calculating the argument and magnitude images based on the partial derivatives in the horizontal and vertical directions. The final edge representation is then obtained via a threshold operation. The procedure is reiterated for all the images and the displacement of the cantilever is evaluated in terms of the distance from the clamped end, employing a previously established routine. The displacement data that were plotted underwent analysis to derive the corresponding power spectral density (PSD). The natural frequencies that corresponded to the first four mode shapes were accurately identified and distinctly marked.
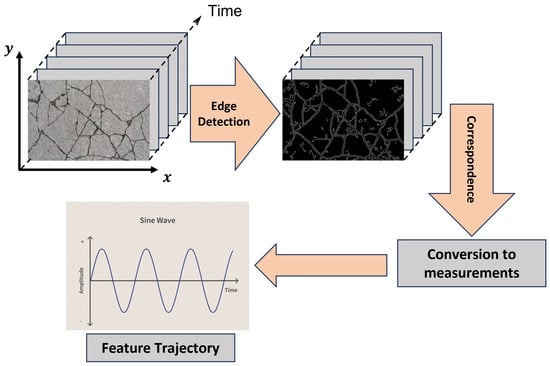
Figure 12 depicts the acquisition of an image sequence using sets of images. The sequence of images is subsequently utilized to construct the trajectories of the scrutinized features, also referred to as markers. Prior to this, an identification routine was executed to ascertain the coordinates of the markers. The edge contours were derived from these image sequences, capturing the dynamics of the structure’s motion. By applying a wavelet-based edge detection method to each image, the edge features were effectively highlighted. Furthermore, the process established a correlation between the various images, ensuring their coherence. To enhance precision, the measurements were converted from pixels to real-world measurements (mm).

Figure 12. The feature-based image sequence analysis was performed.
4.4. Target Tracking
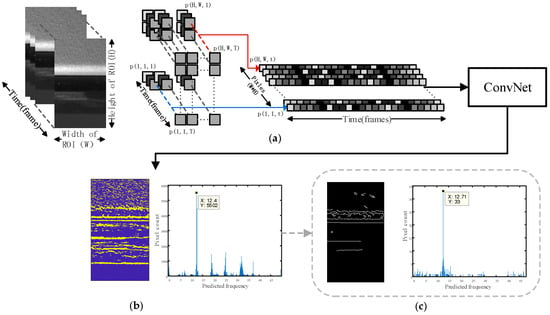
Liu and Yang [48] suggested a method using neural networks that have been recommended as methods for robust vibration frequency prediction. The networks are capable of accurately and reliably predicting the vibration frequency by means of image sequences obtained from a single camera. In the suggested image sequence analysis, the video is read as an image sequence to target the region of interest (ROI) and saved as separate pixel brightness vibration signals. The time domain data obtained from vibration signals are used to create frequency domain data. Figure 13 shows the implementation pipeline for frequency prediction.

Figure 13. Implementation pipeline of the proposed method: (a) read in the ROI video as an image sequence and save as separate pixel brightness variation signals, then feed in the ConvNet; (b) network output prediction result visualization; (c) optional edge enhancement operation [48].
This entry is adapted from the peer-reviewed paper 10.3390/electronics12183862
References
- Yao, Y.; Tung, S.T.E.; Glisic, B. Crack detection and characterization techniques—An overview. Struct. Control Health Monit. 2014, 21, 1387–1413.
- Dong, C.Z.; Catbas, F.N. A review of computer vision–based structural health monitoring at local and global levels. Struct. Health Monit. 2021, 20, 692–743.
- Sony, S.; Laventure, S.; Sadhu, A. A literature review of next-generation smart sensing technology in structural health monitoring. Struct. Control Health Monit. 2019, 26, e2321.
- Flah, M.; Suleiman, A.R.; Nehdi, M.L. Classification and quantification of cracks in concrete structures using deep learning image-based techniques. Cem. Concr. Compos. 2020, 114, 103781.
- LeBlanc, B.; Niezrecki, C.; Avitabile, P.; Chen, J.; Sherwood, J. Damage detection and full surface characterization of a wind turbine blade using three-dimensional digital image correlation. Struct. Health Monit. 2013, 12, 430–439.
- Li, J.; Xie, X.; Yang, G.; Zhang, B.; Siebert, T.; Yang, L. Whole-field thickness strain measurement using multiple camera digital image correlation system. Opt. Lasers Eng. 2017, 90, 19–25.
- Dabous, S.A.; Feroz, S. Condition monitoring of bridges with non-contact testing technologies. Autom. Constr. 2020, 116, 103224.
- Feng, D.; Feng, M.Q.; Ozer, E.; Fukuda, Y. A vision-based sensor for noncontact structural displacement measurement. Sensors 2015, 15, 16557–16575.
- Scholar, P. Review and analysis of crack detection and classification techniques based on crack types. Int. J. Appl. Eng. Res 2018, 13, 6056–6062.
- Mohan, A.; Poobal, S. Crack detection using image processing: A critical review and analysis. Alex. Eng. J. 2018, 57, 787–798.
- Munawar, H.S.; Hammad, A.W.; Haddad, A.; Soares, C.A.P.; Waller, S.T. Image-based crack detection methods: A review. Infrastructures 2021, 6, 115.
- Ali, R.; Gopal, D.L.; Cha, Y.J. Vision-based concrete crack detection technique using cascade features. In Proceedings of the Sensors and Smart Structures Technologies for Civil, Mechanical, and Aerospace Systems, Denver, CO, USA, 5–8 March 2018; Volume 10598, pp. 147–153.
- Dorafshan, S.; Thomas, R.J.; Maguire, M. Benchmarking image processing algorithms for unmanned aerial system-assisted crack detection in concrete structures. Infrastructures 2019, 4, 19.
- Han, H.; Deng, H.; Dong, Q.; Gu, X.; Zhang, T.; Wang, Y. An advanced Otsu method integrated with edge detection and decision tree for crack detection in highway transportation infrastructure. Adv. Mater. Sci. Eng. 2021, 2021, 9205509.
- Wang, P.; Huang, H. Comparison analysis on present image-based crack detection methods in concrete structures. In Proceedings of the 2010 3rd International Congress on Image and Signal Processing, Yantai, China, 16–18 October 2010; Volume 5, pp. 2530–2533.
- Liu, X.; Ai, Y.; Scherer, S. Robust image-based crack detection in concrete structure using multi-scale enhancement and visual features. In Proceedings of the 2017 IEEE International Conference on Image Processing (ICIP), Beijing, China, 17–20 September 2017; pp. 2304–2308.
- Hussain, Z.; Agarwal, D. A comparative analysis of edge detection techniques used in flame image processing. Int. J. Adv. Res. Sci. Eng. IJARSE 2015, 4, 3703–3711.
- Sia, J.S.Y.; Tan, T.S.; Yahya, A.B.; Tiong, M.F.T.; Sia, J.Y.X. Mini Kirsch Edge Detection and Its Sharpening Effect. Indones. J. Electr. Eng. Inform. IJEEI 2021, 9, 228–244.
- Shen, G. Road crack detection based on video image processing. In Proceedings of the 2016 3rd International Conference on Systems and Informatics (ICSAI), Shanghai, China, 19–21 November 2016; pp. 912–917.
- Peng, L.; Chao, W.; Shuangmiao, L.; Baocai, F. Research on crack detection method of airport runway based on twice-threshold segmentation. In Proceedings of the 2015 Fifth International Conference on Instrumentation and Measurement, Computer, Communication and Control (IMCCC), Qinhuangdao, China, 18–20 September 2015; pp. 1716–1720.
- Senthikumar, M.; Palanisamy, V.; Jaya, J. Metal surface defect detection using iterative thresholding technique. In Proceedings of the Second International Conference on Current Trends in Engineering and Technology-ICCTET 2014, Coimbatore, India, 8 July 2014; pp. 561–564.
- Song, M.; Cui, D.; Yu, C.; An, J.; Chang, C.I.; Song, M. Crack detection algorithm for photovoltaic image based on multi-scale pyramid and improved region growing. In Proceedings of the 2018 IEEE 3rd International Conference on Image, Vision and Computing (ICIVC), Chongqing, China, 27–29 June 2018; pp. 128–132.
- Shivaprasad, K.; Vishwanath, M.; Narasimha, K. Morphology based surface crack detection. J. Adv. Res. Sci. 2015, 1, 15–20.
- Sankarasrinivasan, S.; Balasubramanian, E.; Karthik, K.; Chandrasekar, U.; Gupta, R. Health monitoring of civil structures with integrated UAV and image processing system. Procedia Comput. Sci. 2015, 54, 508–515.
- Cao, J.; Zhang, K.; Yuan, C.; Xu, S. Automatic road cracks detection and characterization based on mean shift. Jisuanji Fuzhu Sheji Yu Tuxingxue Xuebao J. Comput.-Aided Des. Comput. Graph. 2014, 26, 1450–1459.
- Hu, Y.; Zhao, C.X.; Wang, H.N. Automatic pavement crack detection using texture and shape descriptors. IETE Tech. Rev. 2010, 27, 398–405.
- Jahanshahi, M.R.; Masri, S.F.; Padgett, C.W.; Sukhatme, G.S. An innovative methodology for detection and quantification of cracks through incorporation of depth perception. Mach. Vis. Appl. 2013, 24, 227–241.
- Prasanna, P.; Dana, K.J.; Gucunski, N.; Basily, B.B.; La, H.M.; Lim, R.S.; Parvardeh, H. Automated crack detection on concrete bridges. IEEE Trans. Autom. Sci. Eng. 2014, 13, 591–599.
- Lee, B.Y.; Kim, Y.Y.; Yi, S.T.; Kim, J.K. Automated image processing technique for detecting and analysing concrete surface cracks. Struct. Infrastruct. Eng. 2013, 9, 567–577.
- Cord, A.; Chambon, S. Automatic road defect detection by textural pattern recognition based on AdaBoost. Comput.-Aided Civ. Infrastruct. Eng. 2012, 27, 244–259.
- Syahrian, N.M.; Risma, P.; Dewi, T. Vision-based pipe monitoring robot for crack detection using canny edge detection method as an image processing technique. Kinet. Game Technol. Inf. Syst. Comput. Netw. Comput. Electron. Control. 2017, 2, 243–250.
- Salehi, H.; Biswas, S.; Burgueño, R. Data interpretation framework integrating machine learning and pattern recognition for self-powered data-driven damage identification with harvested energy variations. Eng. Appl. Artif. Intell. 2019, 86, 136–153.
- Kotsiantis, S.B. Decision trees: A recent overview. Artif. Intell. Rev. 2013, 39, 261–283.
- Wu, W.; Liu, Z.; He, Y. Classification of defects with ensemble methods in the automated visual inspection of sewer pipes. Pattern Anal. Appl. 2015, 18, 263–276.
- Cover, T.; Hart, P. Nearest neighbor pattern classification. IEEE Trans. Inf. Theory 1967, 13, 21–27.
- Uddin, S.; Haque, I.; Lu, H.; Moni, M.A.; Gide, E. Comparative performance analysis of K-nearest neighbour (KNN) algorithm and its different variants for disease prediction. Sci. Rep. 2022, 12, 6256.
- Kirasich, K.; Smith, T.; Sadler, B. Random forest vs logistic regression: Binary classification for heterogeneous datasets. SMU Data Sci. Rev. 2018, 1, 9.
- Binte Kibria, H.; Matin, A. The Severity Prediction of The Binary And Multi-Class Cardiovascular Disease–A Machine Learning-Based Fusion Approach. arXiv 2022, arXiv:2203.04921.
- Ibrahim, I.; Abdulazeez, A. The Role of machine learning algorithms for diagnosing diseases. J. Appl. Sci. Technol. Trends 2021, 2, 10–19.
- Park, K.; Torbol, M. Visual-based laser speckle pattern recognition method for structural health monitoring. In Proceedings of the Sensors and Smart Structures Technologies for Civil, Mechanical, and Aerospace Systems 2017, Portland, OR, USA, 25–29 March 2017; Volume 10168, pp. 114–120.
- Lei, B.; Wang, N.; Xu, P.; Song, G. New crack detection method for bridge inspection using UAV incorporating image processing. J. Aerosp. Eng. 2018, 31, 04018058.
- Shukla, S.; Naganna, S. A review on K-means data clustering approach. Int. J. Inf. Comput. Technol. 2014, 4, 1847–1860.
- Wang, X.; Liu, Y.; Xin, H. Bond strength prediction of concrete-encased steel structures using hybrid machine learning method. Structures 2021, 32, 2279–2292.
- Zimmermann, M.; Gülan, U.; Harmanci, Y.E.; Chatzi, E.N.; Holzner, M. Structural health monitoring through video recording. In Proceedings of the 8th European Workshop on Structural Health Monitoring (EWSHM 2016), Bilbao, Spain, 5–8 July 2016; pp. 5–8.
- Chen, J.G.; Wadhwa, N.; Cha, Y.J.; Durand, F.; Freeman, W.T.; Buyukozturk, O. Structural modal identification through high speed camera video: Motion magnification. In Topics in Modal Analysis I, Volume 7: Proceedings of the 32nd IMAC, A Conference and Exposition on Structural Dynamics, Orlando, FL, USA, 3–6 February 2014; Springer: Berlin/Heidelberg, Germany, 2014; pp. 191–197.
- Ferrer, B.; Espinosa, J.; Roig, A.B.; Perez, J.; Mas, D. Vibration frequency measurement using a local multithreshold technique. Opt. Express 2013, 21, 26198–26208.
- Patsias, S.; Staszewskiy, W. Damage detection using optical measurements and wavelets. Struct. Health Monit. 2002, 1, 5–22.
- Liu, J.; Yang, X. Learning to see the vibration: A neural network for vibration frequency prediction. Sensors 2018, 18, 2530.
This entry is offline, you can click here to edit this entry!
