Your browser does not fully support modern features. Please upgrade for a smoother experience.
Please note this is an old version of this entry, which may differ significantly from the current revision.
Subjects:
Behavioral Sciences
To monitor adherence to diets and to design and evaluate nutritional interventions, it is essential to obtain objective knowledge about eating behavior. In most research, measures of eating behavior are based on self-reporting, such as 24-h recalls, food records (food diaries) and food frequency questionnaires. Self-reporting is prone to inaccuracies due to inaccurate and subjective recall and other biases. Recording behavior using nonobtrusive technology in daily life would overcome this.
- eating
- drinking
- daily life
- sensors
- behavior
1. Introduction
As stated by the World Health Organization (WHO) “Nutrition is coming to the fore as a major modifiable determinant of chronic disease, with scientific evidence increasingly supporting the view that alterations in diet have strong effects, both positive and negative, on health throughout life” [1]. It is therefore of key importance to find efficient and solid methodologies to study eating behavior and food intake in order to help reduce potential long-term health problems caused by unhealthy diets. Past research on eating behaviors and attitudes relies intensively on self-reporting tools, such as 24-h recalls, food records (food diaries) and food frequency questionnaires (FFQ; [2,3,4]). However, there is an increasing understanding of the limitations of this classical approach to studying eating behaviors and attitudes. One of the major limitations of this approach is that self-reporting tools rely on participants’ recall, which may be inaccurate or biased (especially when studying the actual amount of food or liquid intake [5]). Recall biases can be caused by demand characteristics, which are cues that may indicate the study aims to participants, leading them to change their behaviors or responses based on what they think the research is about [6], or more generally by the desire to comply with social norms and expectations when it comes to food intake [7,8].
There is growing interest in identifying technologies able to improve the quality and validity of data collected to advance nutrition science. Such technologies should enable eating behavior to be measured passively (i.e., without requiring action or mental effort on the part of the users), objectively and reliably in realistic contexts. To maximize the efficiency of real-life measurement, it is vital to develop technologies that capture eating behavior patterns in a low-cost, unobtrusive and easy-to-analyze way. For real-world practicality, the technologies should be comfortable and acceptable so that they can be used in naturalistic settings for extended periods while respecting the users’ privacy.
2. Technology to Automatically Record Eating Behavior
2.1. Eating and Drinking Activity Detection
For “eating/drinking activity detection”, many systems have been reported that measure eating- and drinking-related motions. In particular, many papers reported measuring these actions using motion sensors such as inertial sensor modules (i.e., inertial measurement units or IMUs). IMUs typically consist of various sensors such as an accelerator, gyroscope and magnetometer. These sensors are embedded in smartphones and wearable devices such as smartwatches. In [16], researchers collected IMU signals with off-the-shelf smartwatches to identify hand-based eating and drinking-related activities. In this case, participants wore smartwatches on their preferred wrists. Other studies have employed IMUs worn on the wrist, upper arm, head, neck and combinations thereof [17,18,19,20]. IMUs worn on the wrist or upper arms can collect movement data relatively unobtrusively during natural eating activities such as lifting food or bringing utensils to the mouth. Recent research has also improved IMUs that are attached to the head or neck, combining sensors with glasses or necklaces so that they are less bulky and users are not aware that they are being worn. Besides IMUs, proximity sensors, piezoelectric sensors and radar sensors are also used to detect hand-to-mouth gestures or jawbone movements [21,22,23]. Pressure sensors are used to measure eating activity as well. For instance, in [24], eating activities and the amount of consumed food are measured by a pressure-sensitive tablecloth and tray. These devices provide information on food-intake-related actions such as cutting, scooping, stirring or the identification of the plate or container on which the action is executed and allow the tracking of weight changes of plates and containers. Microphones, RGB-D images and video cameras are also used to detect eating and drinking-related motions.
2.2. Bite, Chewing or Swallowing Detection
Motion sensors and video are used to detect bites (count). For instance, OpenPose is an off-the-shelf software that analyzes bite counts from videos [29]. To assess bite weight, weight sensors and acoustic sensors have been used [30,31]. In [30], the bite weight measurement also provides the estimation of a full portion.
Chewing or swallowing is the most well-studied eating- and drinking-related activity, as reflected by the number of papers focusing on such activities (31 papers). Motion sensors and microphones are frequently employed for this purpose. For instance, in [32], a gyroscope is used for chewing detection, an accelerometer for swallowing detection and a proximity sensor to detect hand-to-mouth gestures. Microphones are typically used to register chewing and swallowing sounds. In most cases, commercially available microphones are applied, while the applied detection algorithms are custom-made. Video, electroglottograph (EGG) and electromyography (EMG) devices are also used to detect chewing and swallowing. EGG detects the variations in the electrical impedance caused by the passage of food during swallowing, while EMG in these studies monitors the masseter and temporalis muscle activation for recording chewing strokes. The advantages of EGG and EMG are that they can directly detect swallowing and chewing while eating and are not, or are less, affected by other body movements compared to motion sensors. However, EMG devices are not wireless and EGG sensors need to be worn around the face, which is not optimal for use in everyday eating situations.
2.3. Portion Size Estimation
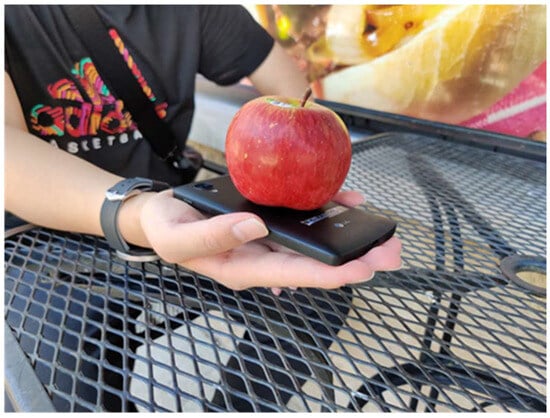
Portion size is estimated mainly by using weight sensors and food image analysis. Regarding weight sensors, the amount of food consumed is calculated by comparing the weights of plates before and after eating. An open-source system consisting of a wireless pocket-sized kitchen scale connected to a mobile application has been reported in [33]. As shown in Figure 3, a system turning an everyday smartphone into a weighing scale is also available [34]. The relative vibration intensity of the smartphone’s vibration motor and its built-in accelerometer are used to estimate the weight of food that is placed on the smartphone. Off-the-shelf smartphone cameras are typically used for volume estimation from food images. Also, several studies use RGB-D images to get more accurate volume estimations from information on the height of the target food. For image-based approaches, AI-based algorithms are often employed to calculate portion size. Some studies made prototype systems applicable to real-life situations. In [35], acoustic data from a microphone was collected along with food images to measure the distance from the camera to the food. This enables the food in the image to be scaled to its actual size without training images and reference objects. However, in other cases, image processing mostly uses a reference for comparing the food size.
Figure 3. VibroScale (reproduced from [34] with permission).
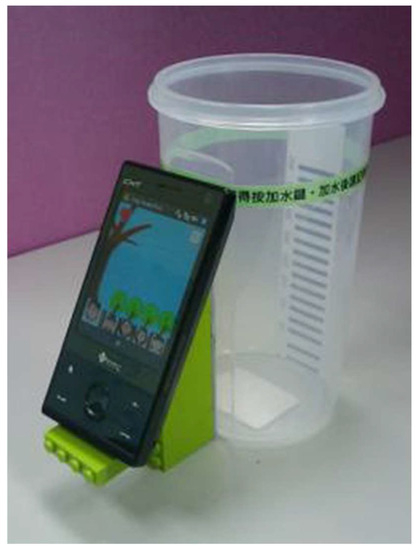
For estimating portion size in drinks, several kinds of sensors have been tested. An IMU in a smartwatch was used to estimate drink intake volume from sip duration [38]. Also, in [39], liquid sensors such as a capacitive sensor and a conductivity sensor were used to monitor the filling levels in a cup. Some research groups developed so-called smart fridges that automatically register food items and quantities. In [40], image analysis of a thermal image taken by an infrared (IR) sensor embedded in a fridge provides an estimation of a drink volume. Another study proposed a system called the Playful Bottle system [41], which consists of a smartphone attached to a common drinking mug. Drinking motions such as picking up the mug, tilting it back and placing it on the desk are detected by the phone’s accelerometer. After the drinking action is completed and the water line becomes steady, the phone’s camera captures an image of the amount of liquid in the mug (Figure 4).
Figure 4. Playful Bottle system (reproduced from [40] with permission).
2.4. Sensor Location
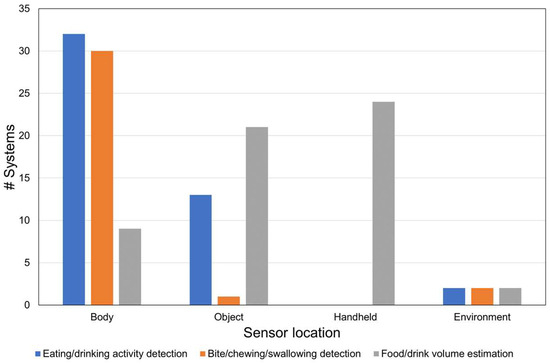
Figure 5 indicates where sensors are typically located per objective. The locations of the sensors are classified as body-attached (e.g., ear, neck, head, glasses), embedded in objects (e.g., plates, cutlery) and the environment (e.g., distant camera, magnetic trackers). For eating/drinking activity detection, sensors are mostly worn on the body, followed by embedded in the objects. Body-worn sensors are also used for bite/chewing/swallowing detection. On the other hand, for portion size estimation, object-embedded and handheld sensors are mainly chosen depending on the measuring targets
Figure 5. Sensor placement per objective.
This entry is adapted from the peer-reviewed paper 10.3390/s23187757
This entry is offline, you can click here to edit this entry!