The incidence of pancreatic cystic lesions (PCLs) has been rising due to improvements in imaging. Of these, intraductal papillary mucinous neoplasms (IPMNs) are the most common and are thought to contribute to almost 20% of pancreatic adenocarcinomas. All major society guidelines for the management of IPMNs use size defined by maximum diameter as the primary determinant of whether surveillance or surgical resection is recommended. However, there is no consensus on how these measurements should be obtained or whether a single imaging modality is superior. Furthermore, the largest diameter may fail to capture the complexity of PCLs, as most are not perfectly spherical.
1. Introduction
Despite recent advances in cancer detection and management strategies, pancreatic cancer remains among the deadliest worldwide. In the United States, pancreatic cancer is responsible for 8.2% of all cancer deaths and has an estimated 5-year survival of 11.5 percent [
1]. The global incidence is projected to increase to 18.6 per 100,000 by the year 2050, which poses a significant public health burden [
2]. There are numerous well-established risk factors for developing pancreatic cancer, including cigarette smoking, family history, age, and male sex. However, due to the lack of effective screening methods, the only populations recommended to undergo any type of screening are those with a significant family history or those with a high-risk genetic screen. For this reason, the effective management of premalignant pancreatic lesions is crucial in both slowing the incidence of cases and improving mortality.
Pancreatic cystic lesions (PCLs) represent a significant portion of premalignant pancreatic lesions and contribute to nearly 20% of pancreatic adenocarcinomas [
3]. PCLs are classified as mucinous and non-mucinous. Mucinous PCLs, which include intraductal papillary mucinous neoplasms (IPMNs) and mucinous cystic neoplasms (MCNs), have the potential to progress to pancreatic adenocarcinoma. The surveillance of mucinous PCLs poses a promising opportunity to advance the detection and prevention of pancreatic cancer. Improvements in cross-sectional imaging and its increased utilization in an aging population have contributed to a marked increase in the incidence of PCLs [
4]. Due to the heterogeneous nature of these lesions, the challenge lies in accurately classifying them in order to guide management.
Among neoplastic PCLs, IPMNs are the most common. The point prevalence of IPMNs in those above age 60 is ~1 in 100 subjects [
5,
6]. While many IPMNs are discovered incidentally and are asymptomatic, rarely, they can cause symptoms, including abdominal pain, pancreatitis, and jaundice. They also have a significant malignant potential, with a mean malignancy rate of 61% in main-duct IPMNs (MD-IPMNs) when the duct diameter is ≥10 mm and a malignancy rate of 25.5% in branch-duct IPMNs (BD-IPMNs) when the cyst diameter is ≥4 cm [
7]. Specifically, the risk of malignant transformation of BD-IPMNs is 18–25% at 3–4 cm and >25% at ≥4 cm diameter [
8,
9].
The early detection of high-risk BD-IPMNs is crucial, as the 5-year survival after the surgical resection of IPMNs with invasive cancers ranges from 31 to 60%, compared to 90 to 100% in noninvasive IPMNs [
10]. Unfortunately, there are significant limitations in the imaging methods used to identify and risk-stratify BD-IPMNs. Guidelines from multiple professional societies use PCL size to assess the risk of malignant transformation to determine the appropriate surveillance or intervention [
9,
11,
12,
13,
14,
15,
16]. However, these guidelines are difficult to apply since various imaging modalities, including computed tomography (CT) scan, magnetic resonance imaging (MRI)/magnetic resonance cholangiopancreatography (MRCP), and endoscopic ultrasound (EUS), often provide discordant measurements. Therefore, consensus regarding optimal imaging modality and best practices in collecting measurements is needed to ensure that BD-IPMNs are appropriately managed.
2. Current Guidelines Regarding Pancreatic Cystic Lesion Measurement
There are five sets of guidelines from major societies regarding the management of PCLs. Each set of guidelines seeks to establish high-risk features summarized in
Table 1 that should prompt closer follow-up or surgical evaluation. While these features vary, PCL size is the one factor uniformly cited by all guidelines. The American College of Gastroenterology (ACG), the American College of Radiology (ACR), the American Gastrointestinal Association (AGA), and the International Association of Pancreatology (IAP) established a diameter of at least 3 cm as indicative of increased risk for advanced neoplasia, whereas the European evidence-based guidelines use a cutoff of 4 cm in diameter. Some of these guidelines, specifically the European and IAP/Fukuoka guidelines, provide management recommendations for specific types of PCLs, whereas the ACG and AGA guidelines offer general strategies for PCL surveillance and management regardless of subtype. The revised 2017 IAP/Fukuoka guidelines are commonly used as they provide specific operative criteria for MD- and BD-IMPNs. According to IAP/Fukuoka guidelines, high-risk stigmata are defined as obstructive jaundice, main pancreatic duct >10 mm, and enhancing mural nodule >5 mm. Surgical resection is strongly recommended for both MD- and BD-IPMNs with any high-risk stigmata. Size-guided surveillance imaging is recommended for BD-IPMNs that are <3 cm and without other worrisome or high-risk features [
9].
Table 1. Summary of available pancreatic cyst management guidelines and their characterizations of high-risk pancreatic cysts.
Despite the consistent use of PCL size as one of the primary determinants of surveillance and management recommendations for BD-IPMNs, there is inconsistent evidence to support this. The two major considerations in cyst measurement are baseline size and incremental growth, where a rate of growth greater than 5 mm every 2 years is regarded as a worrisome feature [
9]. However, the consistent implementation of these recommendations is impaired by insufficient consensus on imaging protocols and measurement techniques. The ACR guidelines are the only ones to specifically discuss CT and MRI protocols.
3. Methods of Measuring PCL Size
3.1. CT, MRI, and EUS
As noted in most of the PCL management guidelines, the three most common imaging modalities for detecting and diagnosing pancreatic cysts are CT, MRI, and EUS. Each modality comes with its own risks and benefits. While MRI can provide the high contrast definition of soft tissue without exposing patients to radiation, it is more time-consuming and expensive than CT [
17]. CT is more widely available and time efficient, but it exposes patients to repeated doses of radiation throughout the pancreatic cyst surveillance period. EUS provides the high-resolution imaging of pancreatic cysts with the option to utilize fine needle aspiration (FNA) during the procedure to further assist with the diagnosis of the cyst. However, it is by far the most invasive method of the three [
17]. Several studies that measured PCLs were assessed to investigate the differences in imaging modality and size measurement methodology. To account for recent advances in imaging technologies, only studies conducted within the past 15 years were reviewed.
3.2. Maximum Diameter—Variation between Imaging Modalities
Du et al. compared the difference in cyst size measurement and cyst characteristic appearance across CT, MRI, and EUS; (
n = 68). They used cyst diameter as the definition of cyst size. While there were no major discrepancies in size, EUS was superior in identifying specific characteristics, such as intracystic nodules, wall thickness, and septations [
18]. Similarly, Boos et al. compared incidental pancreatic cyst size measurement (defined by maximal diameter) between CT and MRI and reported a mean absolute size discrepancy of 2.1 ± 1.8 mm (
n = 267; median 1.5 mm, range 0–9 mm). This study also determined that the larger the cyst size, the larger the absolute size discrepancy between the imaging modalities [
19]. Moreover, CT did not correctly identify incidental PCLs by rate of 22% when compared to MRI.
3.3. Maximum Diameter—Imaging vs. Histopathology
Lee et al. assessed the PCLs of patients who had all CT, MRI, and EUS images taken within three months prior to surgical resection (
n = 34). The authors measured the maximum dimension of the pancreatic cyst in two axes—cross-sectional and coronal—in all three imaging modalities. The larger of the two measurements was selected to define cyst size in the analysis. Of the three imaging modalities, EUS had the widest range of 95% limits of agreement (−17.43 to +23.87) and very good reliability with an intraclass correlation coefficient of 0.84 (95% CI 0.58–0.94) for mucinous lesions. EUS was specifically found to underestimate the size of PCLs located in the pancreatic tail when compared to CT and MRI [
20]. The authors concluded that EUS findings should be interpreted with caution, particularly when the lesion is located in the tail of the pancreas and is relatively large in size.
Maimone et al. compared the cyst size measurements of 175 patients who underwent some combination of CT, MRI, and EUS imaging prior to surgical resection. They defined cyst size as the single largest cyst diameter. The median size differences between each combination of imaging modalities were: 4 mm (0–25 mm) between EUS and CT, 4 mm (0–17 mm) between EUS and MRI, and 3 mm (2–20 mm) between CT and MRI. Histopathologic data from resection were then compared to 12 EUS, 13 CT, and 8 MRI measurements. The median size differences were: 9.5 mm (0–20 mm) between EUS and pathology, 5 mm (0–21 mm) between CT and pathology, and 5.5 mm (2–44 mm) between MRI and pathology [
21]. In this study, the authors noted that there was significant variation in the size estimates of PCLs when assessed using different imaging modalities. Therefore, they recommended the use of a single imaging modality for surveillance to ensure consistency in size measurements.
Two additional studies also compared PCL size data obtained from imaging to surgically resected pathology specimens. Leeds et al. compared the maximum diameters of cysts measured with CT and EUS to the measurements of surgically resected pathology specimens in 70 patients. Measurements included maximum diameter in the axial, sagittal, and coronal planes. There were no significant differences found between measurements obtained via either imaging modality when compared to pathology [
22]. Huynh et al. similarly used a small sample size of 57 IPMNs (3 MD, 41 BD, 13 mixed) to compare the three imaging modalities on the strength of their size measurement correlation to the pathological cyst size. Each of the three imaging modalities was used to measure the maximum long-axis cyst diameter, which was later compared to the post-operative pathological cyst maximum diameter. Unlike Leeds et al., this study revealed that CT and MRI significantly overestimated the IPMN size measurement when compared to pathological cyst measurement, while EUS best predicted the pathological cyst size, especially for those smaller than 3 cm [
23]. The authors speculated that the differences in cyst size measurement across different imaging modalities could be attributed to the difference in cyst size in coronal and axial views of CT and MRI as opposed to oblique angle views on EUS. Aside from investigating their hypothesis, the authors additionally commented on the lack of standardized protocol in radiographic and pathological pancreatic cyst size measurement.
3.4. Diameter and Volume Estimation—Imaging vs. Histopathology
Literature evidence from the last decade suggests that the three-dimensional growth pattern of PCLs is uneven and may not be accurately estimated when only one or two dimensions are obtained in imaging studies [
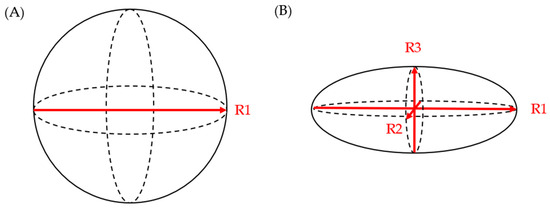
24]. Chalian et al. compared PCL volumes obtained from CT imaging to the volume of fluid aspirated during EUS. The CT measurement of cyst volume was measured using (a) software-assisted CT volumetry and (b) spherical and ellipsoid volume calculation formulas (spherical volume = π × R1
3/6; ellipsoid volume = R1 × R2 × R3 × π/6 (R1: longest diameter on axial plane; R2: longest diameter on coronal plane; R3: longest diameter on sagittal plane)) (
Figure 1). Whether a cyst was spherical or ellipsoid was determined using an elongation value, 1 − aspect ratio, or 1 − (width/length), where cysts that are spherical had an elongation value closer to 0 and those that were ellipsoid had an elongation value closer to 1. Of the 14 fully aspirated PCLs, the mean aspirated cyst volume was 2.05 ± 1.56 mL. The mean volume measured via CT volumetry was 2.27 ± 1.54 mL, while the ellipsoid volume (formula) yielded a mean volume of 2.94 ± 2.06 mL, and the spherical volume (formula) resulted in a mean volume of 3.78 ± 2.47 mL. Although software-assisted CT volumetry was the most accurate method, the utilization of the ellipsoid volume (formulas) was found to be preferable over the spherical volume (formulas) [
25].
Figure 1. (A) spherical volume = π × R13/6; (B) ellipsoid volume = R1 × R2 × R3 × π/6.
This entry is adapted from the peer-reviewed paper 10.3390/jcm12185871