Apolipoprotein(a) (apo(a)) is the protein component that defines lipoprotein(a) (Lp(a)) particles and is encoded by the LPA gene. The apo(a) is extremely heterogeneous in size due to the copy number variation (CNV) in the kringle IV type-2 (KIV-2) domains. Lp(a) concentrations in the blood vary by more than a thousand-fold between individuals, ranging from less than 0.1 to more than 300 mg/dL, depending on the size of apo(a) that is encoded by the LPA gene. The KIV-2 copy number ranges from 1 to >40, and the CNV of KIV-2 shows a >95% heterozygosity in most populations. Screening patients for elevated Lp(a) is strongly encouraged as an effective tool to identify individuals requiring more aggressive lipid-lowering therapy to reduce the CVD risk. Lp(a) levels above 50 mg/dL are correlated with an increased risk for the development of CVD.
1. Introduction
During the past decades, the attention on Lipoprotein(a) (Lp(a)) has exponentially grown. Lp(a) is a form of a low-density lipoprotein (LDL) and is an established and genetically determined risk factor for atherosclerosis, coronary artery disease (CAD), stroke, and aortic stenosis [
1,
2]. Moreover, high plasma levels of Lp(a) nearly double the risk of developing peripheral artery disease [
3]. Mendelian studies also associate a high Lp(a) with a mildly though significantly higher risk of developing atrial fibrillation. The pathophysiological link between these two conditions, however, has yet to be clarified [
4].
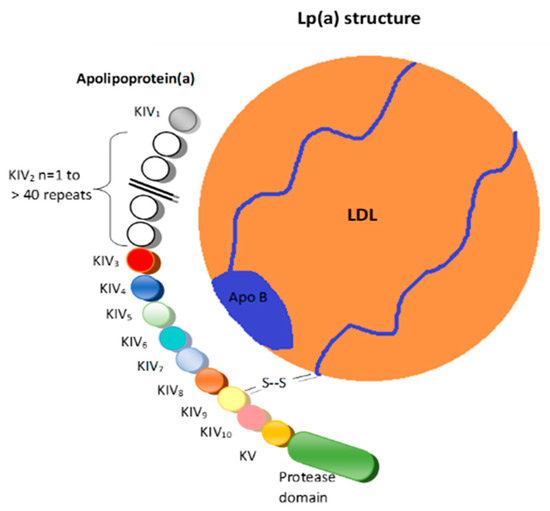
Structurally, Lp(a) is a variant of LDL with an apolipoprotein(a) (apo(a)) that is bound to the apolipoprotein B100 (
Figure 1) [
6].
Figure 1. Lipoprotein(a). LDL = Low-density lipoprotein; K = Kringle; Apo B = Apolipoprotein B 100; S-S = Disulfide bridge.
These two structures are linked by a disulfide bridge and are assembled in the cell membranes of hepatocytes [
7].
The plasma levels of Lp(a) are largely mediated by the LPA gene locus on chromosome 6q22-23, with small or negligible effects resulting from diet [
8,
9]. The levels of Lp(a) in plasma are determined by the rate of entry of these particles into the circulation (i.e., the production rate) and the efficiency of their removal (i.e., fractional clearance rate) [
10].
There is an inverse relationship between the plasma concentrations of Lp(a) and the isoform of apo(a) [
11]. The variation in the apo(a) isoform is induced by the different numbers of kringle IV type-2 (KIV-2) repeats in the LPA gene, which leads to variable levels of Lp(a) in the general population [
12]. Individuals with fewer kringle repeats have smaller Lp(a) particles but higher serum levels of Lp(a). In addition, the larger the isoforms of apo(a), the greater the accumulation of its intracellular precursor in the endoplasmic reticulum. The short alleles of the KIV-2 copy number variation (CNV) have been shown to be associated with an increased risk of coronary heart disease (CHD) in almost all populations [
13].
Small isoforms of Lp(a) are linked to elevated serum Lp(a) levels, and thus, to an increased risk of coronary artery disease. Thus, screening for genetic factors of Lp(a) is expected to have added value and proves to be cost-effective in primary prevention, whereas the monitoring of serum Lp(a) levels could improve the prediction of the clinical risk of atherosclerotic damage in patients with ASCVD [
36,
37].
Several laboratory techniques can be employed to assess the size of the KIV-2 CNV. In the following sections, the pulsed-field gel electrophoresis (PFGE)/Southern blot, the quantitative polymerase chain reaction (qPCR), the fiber fluorescence in situ hybridization (fiber-FISH), and the Western blot (using apo(a) specific antibodies) will be explored.
2. Genotyping Techniques
The KIV-2 CNV size polymorphisms can be analyzed to characterize the genetic architecture of Lp(a) [
38]. Identifying single nucleotide polymorphisms (SNPs) in the LPA gene has a prognostic significance. The most recent evidence from population studies support the role of some SNIPs (rs6415084 and rs12194138) in predicting future ASCV events independently of the concentration of Lp(a) in the blood [
39].
Among the experimental procedures based on deoxyribonucleic acid (DNA) analysis, the largely used PFGE/Southern blot, qPCR, and fiber-FISH will be reviewed thereafter.
2.1. Pulsed-Field Gel Electrophoresis (PFGE)/Southern Blot
Variations in the number of LPA KIV2 repeats can be estimated via immunoblotting electrophoresis or the pulsed-field electrophoresis of unamplified genomic DNA. Immunoblotting electrophoresis is used to detect apo(a) protein isoforms [
40], whereas the pulsed-field electrophoresis of unamplified genomic DNA is used to detect variations in the LPA gene [
41]. These experimental methods are both technically challenging, laborious, and time-consuming. In addition, they require high-quality genetic material and larger amounts of starting DNA than the Southern blot.
APO(a) polymorphisms can be examined via PFGE DNA by means of the use of various restriction enzymes (SwaI, KpnI, KspI, SfiI, and NotI) and an apo(a) kringle-IV-specific probe [
42]. According to previous evidence, these enzymes ensure similar results by detecting the same polymorphism in the KIV repeat domain of apo(a) [
40]. A PFGE analysis using the KpnI restriction enzyme was found to be able to identify 26 different alleles in unrelated individuals (with sizes ranging from 32 kilobases (kb) to 189 kb, progressively increasing by increments of 5.6 kb corresponding to one KIV unit), with a perfect match between the size of apo(a) DNA phenotypes and the size of apo(a) isoforms in plasma [
40]. Unfortunately, PFGE is time-consuming and labor-intensive and can only be performed in reference laboratories with skillful technicians [
43]. Furthermore, by measuring the DNA fragments in kb, the molecular weights of the genomic products cannot be derived directly, but alleles are derived from multiples of 5.6 kb. Finally, the post-translational processing of APO(a) cannot be detected.
2.2. Quantitative Polymerase Chain Reaction (qPCR)
The qPCR is a faster and more sensitive and reliable assay to detect the number of KIV2 repeats in LPA [
44].
One major limitation of the qPCR approach is that it measures the total number of KIV2 repeats instead of the number of KIV2 repeats in each single allele. It follows that qPCR would not always be able to differentiate two different individuals. For instance, an individual who inherited 10 KIV2 repeats from a parent and 20 KIV2 repeats from another parent will exhibit a different biochemical phenotype than another individual who inherited 15 KIV2 repeats from either parent. For the same reason, an individual carrying a null allele would appear to be homozygous for the active allele when using immunoblotting, but qPCR would correctly identify the person as having many KIV2 repeats. Despite these limitations, qPCR is a fast and convenient method to identify the relative total number of KIV2 repeats from genomic DNA samples that have been stored. Moreover, the number of KIV2 repeats in LPA—as assessed using qPCR—has been shown to be correlated with both the size of apo(a) isoforms, as determined via immunoblotting, and the plasma concentration of Lp(a) [
45].
2.3. Fiber Fluorescence In Situ Hybridization (Fiber-FISH)
The fiber-FISH method is the most precise technique available to determine the size of the KIV-2 CNV as it allows one to count, under a fluorescence microscope, the number of KIV-2 copies on individual alleles [
46]. Some unavoidable technical limitations (e.g., the conditions of sample collection, preservation, and storage before analysis) make this method not feasible to handle large sample sizes, although it has historically been used to define standards to be applied in large-scale epidemiologic studies [
23,
24].
The FISH technique uses high-resolution FITC-labeled 4 kb probes that are intron sequences cloned from KIV-2 repeats [
47]. In this way, good linear hybridization signals are obtained on heterozygotes, where there are two different sizes corresponding to different KIV-2 repeat numbers of the respective LPA alleles [
48]. A prerequisite for the accurate counting of KIV-2 repeats is to avoid irregular (discontinuous) hybridization signals. For this purpose, to improve the analysis and obtain more reliable results, the conventional agarose plug method for isolating high-molecular-length DNA can be modified. The number of KIV-2 repeats in each allele can then be accurately determined by counting the FISH signals that appear in a “dotted line” rather than a “beadsona string” pattern under a fluorescence microscope [
49].
3. Phenotyping Techniques
Techniques that allow for protein separation such as Western blotting can be used to assess the apo(a) isoform size and associate the plasma concentrations of Lp(a) with specific alleles of LPA.
Western Blot Using Antibodies for apo(a) (Immunoblotting)
Sodium dodecyl sulfate (SDS) agarose gel electrophoresis followed by immunoblotting can be used to assess the apo(a) isoform size and associate the relative proportion of the total Lp(a) plasma concentration to a specific LPA allele [
49]. This semi-quantitative analysis via densitometry is the most common tool used to assess the specific allele levels of Lp(a) [
48]. However, neither the identification of the unexpressed alleles nor the evaluation of samples with a single band in Western blots is feasible without prior knowledge of the actual size of the KIV-2 CNV of both alleles, which could be null or homozygous in size. For this reason, the most reliable assignment between the allele and Lp(a) concentration is ensured by a combination of KIV-2 CNV genotyping and phenotyping by apo(a) [
50].
SDS-PAGE (PolyAcrylamide Gel Electrophoresis) with polyacrylamide gel at a low percentage (4%) separates the proteins primarily by mass [
51]. However, the high content of carbohydrates in the apo(a) makes it difficult to obtain an accurate molecular weight estimation in SDS-PAGE gels [
52]. As shown by Kamboh et al., SDS-agarose is a more efficient method to assess the apo(a) isoform size, also in consideration of the high molecular weight of apo(a) [
53]. As an effect, larger proteins are separated more easily in a gel that has a lower percentage of acrylamide because the holes in the web are larger. In addition, the increased migration distance between bands running close together even allows for the detection of very small differences (1 mm resolution limit) between them [
54].
This entry is adapted from the peer-reviewed paper 10.3390/ijms241813886