Small peptides are an important component of the vertebrate immune system. They are important molecules for distinguishing proteins that originate from the host versus proteins derived from a pathogenic organism, such as a virus or bacterium. Therefore, these peptides are central to the vertebrate host response to intracellular and extracellular pathogens. Computational models for peptide prediction are based on a narrow sample of data with an emphasis on the position and chemical properties of the amino acids. In prior studies, this approach has led to models with higher predictability as compared to models that rely on the geometrical arrangement of atoms. However, protein structure data from experiment and prediction is a source for building models, and, therefore, knowledge on the role of small peptides in the vertebrate immune system.
- protein structure
- small peptides
- vertebrate immunity
- pathogenic organisms
- adaptive immunity
1. Background
The adaptive immune system of vertebrates is a system of cells and molecules whose role is to distinguish self from non-self. Therefore, a vertebrate host has the potential to detect and clear pathogenic organisms. A major component of this system involves a linear chain of amino acids, the small peptides[1]. The small peptide is of interest since the host immune system relies on it as a marker for a determination on whether a protein originates from itself, or instead of a foreign origin, such as a virus or bacterium[2]. This system can also identify its own cells as foreign if they are genetically altered by a process that leads to the production of non-self molecules[3][4].
These small peptides of interest are formed by cleavage of proteins in the cells of the host, and they form the basis for the cellular processes of immune surveillance, and for identifying pathogens along with cells that operate outside their expected genetic programming[3][5]. However, the adaptive immune system can falsely identify a peptide as originating from non-self in cases where it is a self-peptide, the phenomenon of autoimmunity[6]. An example is where a subset of T cells, named for their development in the thymus, falsely detects small peptides as presented on the surface of cells as originating from non-self, and subsequently signals the immune system to eliminate these cells[7][8][9].
The mechanism for small peptide detection is reliant on a molecular binding between the peptide and a major histocompatibility complex (MHC) receptor that is expressed in the majority of cells of a vertebrate[10]. Further, this mechanism is refined by a process of training the T cell population, which disfavors individual T cells that attack normal cells while favoring the proliferation of those that attack non-self[10]. This is not a deterministic process, however. The dictates of probability are present in biological systems, including in the generation of genetic diversity for the different MHC receptor types, the cleavage process for generating small peptides from a protein, the timeliness of the immune response to molecular evidence of a pathogen, the binding strength of peptides to a MHC receptor, and the requisite sample of peptides for pathogen detection. This system is in contrast to a human designed system, where the structure and function originates by an artificial design, along with low tolerance for this kind of variability.
In prior experimental studies, the sampling of small peptide data has not been uniformly distributed[3][10]. For example, only a small percent of MHC molecules have been studied in regard to their association with small peptides. The problem is the allelic distribution that corresponds to these molecules. While there are about around a dozen genetic loci in clusters that code for a MHC receptor, the number of alleles among these loci is very high as compared to the other genetic loci across the typical vertebrate genome. In the human population, the number of total alleles across the MHC loci is estimated as a value in the thousands[3][11]. These are active genetic sites of evolutionary change and generation of diversity, and unlike the other regions of the genome, has been unhindered at the genetic level by the putative bottleneck that reduced our effective population to mere thousands of individuals[12]. Likewise, studies of these small peptides are generally restricted to human, along with the animal models that serve as their proxy for the study of biomedicine, and livestock[10].
Moreover, there is a preference in scientific analysis that corresponds to MHC class type. The class 1 MHC receptor is generally favored over that of class 2 for modeling the MHC-peptide association, partly because in class 1 MHC some of the amino acids of the peptide are confined within pockets of the MHC molecule[1][3][13][14] (Figure 1). This has led to predictive models of MHC-peptide (pMHC) binding that parameterize the position and chemical types of the amino acids of these peptides[10][15]. These models have exceeded the predictiveness as compared to those solely based on geometrical data of atomic arrangements[3]. However, the geometrical features are expected to provide further insight on pMHC and models for predicting an immunogenic response.
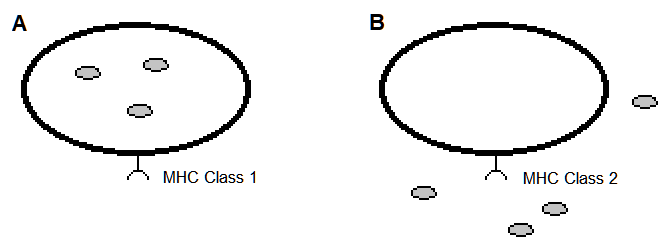
Figure 1. Vertebrate cells expressing an MHC receptor on their cell surface. The hypothetical pathogens are the small filled circles. (A). Nearly all cells express MHC class 1 cell surface receptors that present peptides of an intracellular origin. (B). Many cell types of the immune system express MHC class 2 cell surface receptors that present peptides of an intercellular origin.
Recently, artificial neural networks and related machine language approaches have led to advances in knowledge of protein structure and the potential for modeling the association between proteins and other molecules[10][15][16][17][18]. These methods are capable of highly predictive models that incorporate disparate kinds of data, such as in the use of both geometrical and chemical features in estimating the binding affinity for an MHC receptor to a small peptide[10]. Moreover, they are highly efficient in the case where the modeling is dependent on a very large number of parameters, as in many kinds of biomolecular interactions. Consequently, the deep learning approaches have led to successes in the prediction of protein structure across the many clades of life[19]. These approaches are complemented by the analysis of interpretable metrics for estimating the geometrical similarity among proteins[20][21][22].
Immunogenetics relies on collecting data and building models as expected in the pursuit of scientific knowledge[10][23]. Ideally, this is expected to lead to a meaningful synthesis that is unmired by the collector's fondness for naming schemes and ungrounded collations of terms and studies[24]. The latter perspective resembles the practice of creating the images of science, akin to an art form, while not achieving the aim of extending knowledge by the purposeful modeling of natural phenomena[25].
2. Metrics of Peptide Structure Similarity
2.1. TM-score and the RMSD metric
There are a large number of methods for measurement of the geometrical similarity among proteins[26]. In particular, one method is by the template modeling score (TM-score), which is based on an algorithm, and a performant implementation in code, for measuring the similarity between any two protein molecules[20]. Further, the compiled program from this open source code computes a root-mean-square deviation (RMSD) metric, a similar measure to the TM-score, but, where the latter method is relatively less sensitive to the non-local interactions of a molecular topology, along with the advantage of model invariance to the size of the protein. However, the RMSD metric is also interpretable.
Given a cellular protein, there is empirical support for a range of TM-score values that are meaningful in the context of protein structure similarity, and, likewise, for dissimilarity. A value above 0.5 is considered a significant result of similarity, while a value below 0.17 represents a comparison that is indistinguishable from a comparison of randomly selected proteins[27]. The values for this metric are further bounded by the values of 0 and 1.
The TM-score metric is applicable to the analysis of small peptides. For instance, it is possible to sample protein structure data[19], select all unordered pairs of proteins for comparison, and then find an empirical distribution of values of this metric. This practice may be used to establish significance values for this metric, based on the above sampling procedure. The next subsection describes a method to obtain data for the predictions of the three dimensional structure across biological proteins.
2.2. Peptide Structure Data Files
Predictions of protein structure in PDB formatted files are available across the many forms of cellular life: https://alphafold.ebi.ac.uk/download (Figure 2). These files are stored as an archival file type (.tar), so the "tar" program is useful for extracting the files as contained within the archival file. The archive file sizes are generally large, so an alternative to a conventional web-based retrieval is to use the "curl" program at the command line, which is capable of resuming from a partial file transfer as can result from loss of the network connection. An example below is for the mouse data:
curl -O https://ftp.ebi.ac.uk/pub/databases/alphafold/latest/UP000000589_10090_MOUSE_v4.tar
The above archive file (tar file format) has both PDB and mmCIF formatted file types for each protein. A command line is shown below for restricting the file extraction process to PDB files:
tar -xvf UP000000589_10090_MOUSE_v4.tar *.pdb.gz
As noted above by the "gz" file extension, each PDB formatted file has been compressed to a smaller file size in a binary format (gzip file format), so a decompression operation will lead to a plain text file with the PDB protein structure data (text file format). To decompress these files in a single operation, the "gzip" program is commonly used:
gzip -d *.gz
Since the archive file (tar file format) itself is not compressed, but the data files contained within the archive are compressed, the unarchival operation to extract these files to a directory will use disk space similar to that of the original archive file. However, decompression of the individual compressed data files (gzip file format) will occupy a much larger space on the storage device because each of these data files are compressed by 25% of their original size. Therefore, if the uncompressed data files of interest occupy 4 gigabytes of disk storage, then the decompression operation is expected to result in the use of 16 gigabytes of disk space. Since this example corresponds to a single organism and its protein structure data files, the disk storage requirement is consistent with a desktop computer. However, extending a study to other organisms, or inclusion of protein structure predictions across the Swiss-Prot database, will lead to a very large disk space requirement. The file system of the disk storage is also expected to show robustness to the handling of a very large number of files since the above method can lead to the creating of a few thousand to over a million data files.
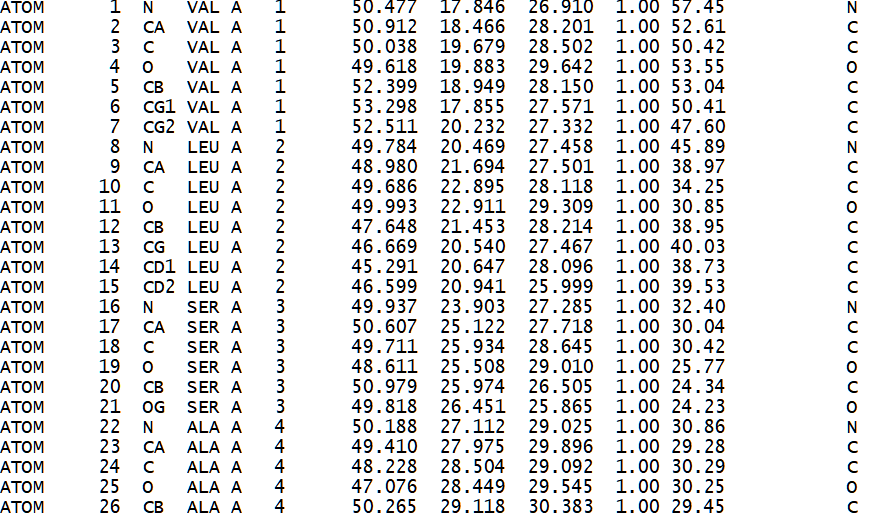
Figure 2. Sample of a PDB formatted file that describes the 3d atomic structure of a hemoglobin molecule (1HV4)[28].
2.2.1. Parsing the PDB Data Files
The PDB formatted data files are expected to conform to the standardized format as described at the following site:
https://www.cgl.ucsf.edu/chimera/docs/UsersGuide/tutorials/pdbintro.html
Each PDB formatted data file can contain more than one model of protein structure. It may also describe more than one protein chain per model. Below is Python computer code for parsing the PDB data files by these features, which then prints out the model and protein chain names for each data file[29]:
import glob
from Bio.PDB.PDBParser import PDBParser

# assign functions
parser = PDBParser()

# input file
for file in glob.glob('./*.pdb'):
    print("file: ", file)

    # retrieve PDB structure
    structure = parser.get_structure(file, file)

    # iterate over models and chains in file
    for model in structure:
        print("model: ", model)
        for chain in model:
           print("chain: ", chain)
Other code samples are available at a GitHub web site for processing PDB data files[29], including a template for splitting a PDB data file into multiple files, where each split file represents a window of 9 amino acid residues. The window is shifted by 1 residue per newly created file, so the procedure is equivalent to sliding a window along the sequence of amino acid residues of a protein, and writing data to a file that corresponds to the window of 9 amino acids and their associated protein structure data. However, this procedure leads to disk space usage that is orders of magnitude more than the disk space occupied by the original PDB formatted data files. The count of files likewise increases by the same factor, while the Python code is not a performant language in processing these file operations, given it is expected to process the code along a single thread, and, furthermore, the code in this example is not necessarily translated by the Python code interpreter as highly efficient machine code, whereas a low level programming language is designed for computational efficiency at the level of machine code.
2.2.2. Format of Data Files for TM-score
Below is another code sample. In this case, it resets the amino acid residue number, an index, of each PDB data file, since by default the TM-score expects that the sequence of residues in each of the two input data files start with the same index numbering scheme:
import os

directory = 'C:/Peptide3d/data'
files = os.listdir(directory)

for file in files:
    if file.endswith('pdb'):
        print(file)
        pdb_file = file

        with open(pdb_file, 'r') as f:
            lines = f.readlines()

        current_residue = None
        start_residue = 1
        current_residue_number = start_residue - 1

        for i, line in enumerate(lines):
            if line.startswith('ATOM'):
                residue = line[22:26]
                if residue != current_residue:
                    current_residue = residue
                    current_residue_number += 1
                lines[i] = line[:22] + str(current_residue_number).rjust(4) \
                 + line[26:]

            if line.startswith('TER'):
                residue = line[22:26]
                if residue != current_residue:
                    current_residue = residue
                lines[i] = line[:22] + \
                 str(current_residue_number).rjust(4) + line[26:]

        with open(pdb_file, 'w') as f:
            f.writelines(lines)
3. Peptide Structure Analysis in Immunogenetics
3.1. Significance Levels for TM-score
The TM-score metric is a powerful tool for measuring the structural similarity among proteins[20]. This metric, along with available protein structure data, can be applied to the study of small peptides. However, the significance levels are not yet established for the expectation on the TM-score values in the case of small peptides. These levels can be estimated by computational analysis of randomly selected pairs of small peptides, such as by a sliding window analysis of protein structure data by residue, as described above, or by simulation of the amino acid sequence of peptides. This knowledge would provide the groundwork for analysis of small peptides as derived from clinical and other empirical data sources, such as in the case of a pathogen that has evolved to escape detection from the immune defenses of members of a host population, allowing for a reference on the expected numbers and types of amino acid changes in a pathogen for evasion of host immunity. The above sections refer to a linearly sampled peptide of the immune system, such as detected by a T cell, but the B cell is a separate question where the effective sampling of amino acids of proteins is according to their geometric proximity, and, therefore, not reliant on a linear arrangement of amino acids for detection of non-self molecules.
3.2. Local versus Global Factors of Protein Structure
A complementary approach is to survey the world of possible small peptides as sampled from the protein structure data and test whether their geometrical structure is more influenced by physical factors at the local level as opposed to the global level of the molecule (Figure 3). The null hypothesis would be that any two small peptides with the same amino acid sequence, but sampled from different non-homologous proteins, would not show similarity in their protein structure, as measured by TM-score[20]. However, this test is based on the prior assumption that the TM-score has a previously established level of significance for rejecting this null hypothesis, and this assumption may be met by the suggestion in an above section. Another assumption is on the availability of small peptide data for this test. For a peptide sequence of 9 amino acids, where there are 20 types of amino acids, the naive probability of finding any two randomly selected matching pairs of these peptides is 1 in 20 to the 9th power, which resolves to 1 in 520 billion pairs. However, sampling smaller peptides, with fewer residues, will lead to finding identical pairs of peptides in a large database of protein structure. This test is also reliant on the utility of the TM-score metric at these peptide lengths. If local factors of protein structure are in fact predictive of the structure of a small peptide, then it is possible to apply this knowledge to prediction of immunogenic peptides in Nature, and the geometrical distance between a known peptide and a predicted peptide is measureable.
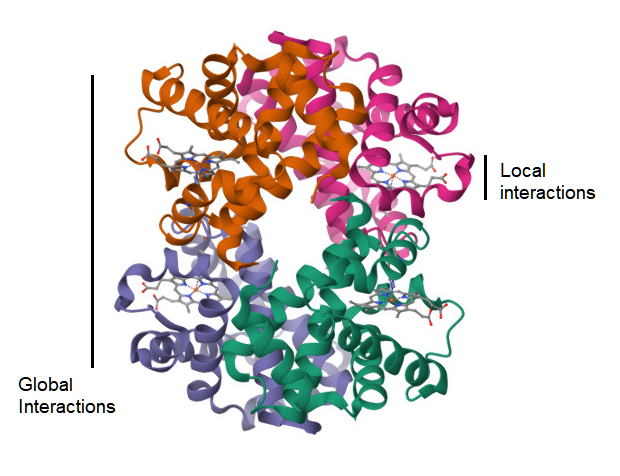
Figure 3. Ribbon diagram of the 3d atomic structure of a hemoglobin molecule (1HV4)[30]. A visualization of the hypothesis on whether the strength of atomic interactions at the local scale is equal to that at the global level.
4. The Immunogenicity of Peptides
As described in the introduction, the applicable immunological models of small peptides are dependent on position and chemical type of amino acids, largely a consequence of the linear structure and restriction in length of these peptides, and their molecular interaction with an MHC receptor (pMHC). Further, it is reasonably established that the formation of an pMHC is highly dependent on the upstream pathways for restriction in peptide length[10]. However, this is an explanation on peptide-MHC binding, but not the subsequent downstream pathway for T cell recognition. Likewise, models have high predictiveness in determining an association between peptide and an MHC receptor[31], but less is known about the downstream immune response[10][32]. However, it is known that the probability is very low for a peptide, as presented on the cell surface by an MHC receptor, to lead to an immune response (Figure 4).
As covered by Nielsen and others[10], the problem is not in the robustness of models of pMHC binding, but in predicting that a peptide as presented on the cell surface is truly immunogenic. For detection of these immunogenic peptides, a model must show high accuracy. Given a model where the error rate from false negatives is set low, ~1 percent, so that the number of potential epitopes is large, and few candidates are absent, then there is a concomitant increase in the false positive error rate in these predictions, leading to a limitation in detection of the true set of epitopes[10][33][34]. Given this rarity of immunogenicity in a sample of peptides, and the factors that lead to this rarity, modelling is limited, while the parameterization of the model is hindered by the presence of unknown factors. With an informative data set, this is a kind of problem that is suitable for a deep learning approach, where the higher order features are captured by the model, including the atomic structure.
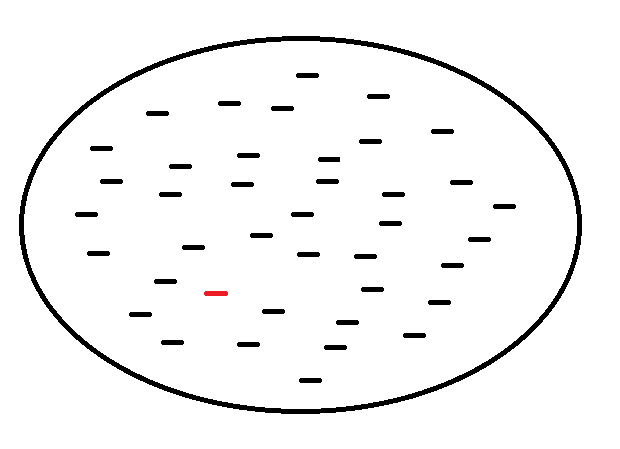
Figure 4. An abstract view of a sample of small peptides, as shown inside the circle, that are known to bind with an MHC receptor on the surface of a vertebrate cell. The red colored peptide is immunogenic, while the other peptides in this sample are not. The expectation is that most peptides, as presented on the cell surface by an MHC receptor, do not lead to an immune response.
5. Evolutionary Strategies by Pathogens
With a sufficiently large collection of data, the deep learning approaches are applicable for modelling the immunological pathways, particularly where traditional approaches, based on a set of interpretable parameters, are inadequate. Since the small peptides are a major determinant of adaptive immunity in the jawed vertebrates, it is essential to broadly sample for data in building models of immunogenicity[10]. Without these models, there is low predictability on the evolution of pathogens, and, therefore, the practioners of the science will tend toward misperceptions of the inner workings of the immunological system.
The above is a view based on making predictions about immunogenic peptides as derived in a pathogen of interest. However, another approach is to compare the evolution of a specific pathogen against data as generated from the highly accurate peptide-MHC binding models[10][31]. This suggestion is for simulation of changes in the genome of the pathogen, and then identifying these changes that weaken the putative association between peptide and MHC receptor. The distribution of amino acid substitutions in these simulations may be compared against prior knowledge of the evolution of a pathogen and its response to host immunity. The comparisons would provide insight into the numbers and types of amino acid changes that are characteristic of the evolutionary response of a pathogen, including a predictiveness on novel variants and their potential for host immune evasion. The assumption for this comparative approach is that the peptide-MHC association is a vulnerable pathway to the evolution of a pathogen and its genetic fitness. Another potential strategy by a pathogen is to target the host pathway that cleaves and forms the small peptides before their association with an MHC receptor. Third, a pathogen may evolve so the resultant peptides in this host are no longer immunogenic, although it is presumed that all three pathways are possible targets by the pathogen in a search for evasion of host immunity. However, the relative frequency of utilization of each of these strategies is unknown.
A confounding factor is in the identification of amino acid substitutions in the pathogen that are a response to host immunity, as substitutions may be caused by other factors, and the genomic signature of the host response can be erased by subsequent evolutionary change. It is possible to discriminate among these evolutionary changes in a pathogen by their association with the forces of natural selection. For instance, nucleotide substitution methods are available to predict if a genomic region has a recent signature of positive selection, and the signature is measured by comparing the rates of nonsynonymous and synonymous substitutions. A nonsynonymous change is defined as a nucleotide change that leads to an amino acid change, while a synonymous change is silent at the amino acid level. These regions identified as evolving by positive selection are ideal candidates for further study on the evolutionary response of a pathogen to a host. In contrast, the simulations are artificially generated so they can control for and model the known confounding factors by a prior set of parameters and their values.
References
- Marek Wieczorek; Esam T. Abualrous; Jana Sticht; Miguel Álvaro-Benito; Sebastian Stolzenberg; Frank Noé; Christian Freund.; Major Histocompatibility Complex (MHC) Class I and MHC Class II Proteins: Conformational Plasticity in Antigen Presentation. Front. Immunol. 2017, 8, 292, .
- Karthik Dhatchinamoorthy; Jeff D. Colbert; Kenneth L. Rock.; Cancer Immune Evasion Through Loss of MHC Class I Antigen Presentation. Front. Immunol. 2021, 12, 636568, .
- Bjoern Peters; Morten Nielsen; Alessandro Sette.; T Cell Epitope Predictions. Annu. Rev. Immunol. 2020, 38, 123-145, .
- Victor H. Engelhard.; Structure of peptides associated with MHC class I molecules. Curr. Opin. Immunol. 1994, 6, 13-23, .
- Thomas Serwold; Federico Gonzalez; Jennifer Kim; Richard Jacob; Nilabh Shastri.; ERAAP customizes peptides for MHC class I molecules in the endoplasmic reticulum. Nat. 2002, 419, 480-483, .
- Argyrios N Theofilopoulos; Dwight H Kono; Roberto Baccala.; The multiple pathways to autoimmunity. Nat. Immunol. 2017, 18, 716-724, .
- K. Maude Ashby; Kristin A. Hogquist.; A guide to thymic selection of T cells. Nat. Rev. Immunol. 2023, null, 1-15, .
- Jason T. George; David A. Kessler; Herbert Levine.; Effects of thymic selection on T cell recognition of foreign and tumor antigenic peptides. Proceedings of the National Academy of Sciences 2017, 114, E7875-E7881, .
- Dorinda A. Smith; Dori R. Germolec.; Introduction to Immunology and Autoimmunity. Environ. Heal. Perspect. 1999, 107, 661, .
- Morten Nielsen; Massimo Andreatta; Bjoern Peters; Søren Buus.; Immunoinformatics: Predicting Peptide–MHC Binding. Annu. Rev. Biomed. Data Sci. 2020, 3, 191-215, .
- Jacek Radwan; Wiesław Babik; Jim Kaufman; Tobias L. Lenz; Jamie Winternitz.; Advances in the Evolutionary Understanding of MHC Polymorphism. Trends Genet. 2020, 36, 298-311, .
- Jorde, L.B.; Genetic variation and human evolution. American Society of Human Genetics 2003, 7, 28-33, .
- P. J. Bjorkman; M. A. Saper; B. Samraoui; W. S. Bennett; J. L. Strominger; D. C. Wiley; Structure of the human class I histocompatibility antigen, HLA-A2. Nat. 1987, 329, 506-512, .
- Dinler A. Antunes; Didier Devaurs; Mark Moll; Gregory Lizée; Lydia E. Kavraki.; General Prediction of Peptide-MHC Binding Modes Using Incremental Docking: A Proof of Concept. Sci. Rep. 2018, 8, 4327, .
- Shutao Mei; Fuyi Li; AndrÉ Leier; Tatiana T Marquez-Lago; Kailin Giam; Nathan P Croft; Tatsuya Akutsu; A Ian Smith; Jian Li; Jamie Rossjohn; et al. A comprehensive review and performance evaluation of bioinformatics tools for HLA class I peptide-binding prediction. Briefings Bioinform. 2020, 21, 1119-1135, .
- Muhammad Saqib Sohail; Syed Faraz Ahmed; Ahmed Abdul Quadeer; Matthew R. McKay; In silico T cell epitope identification for SARS-CoV-2: Progress and perspectives. Adv. Drug Deliv. Rev. 2021, 171, 29-47, .
- Ehsan Raoufi; Maryam Hemmati; Samane Eftekhari; Kamal Khaksaran; Zahra Mahmodi; Mohammad M. Farajollahi; Monireh Mohsenzadegan.; Epitope Prediction by Novel Immunoinformatics Approach: A State-of-the-art Review. Int. J. Pept. Res. Ther. 2019, 26, 1155-1163, .
- Philip Bradley.; Structure-based prediction of T cell receptor:peptide-MHC interactions. eLife 2023, 12, e82813, .
- John Jumper; Richard Evans; Alexander Pritzel; Tim Green; Michael Figurnov; Olaf Ronneberger; Kathryn Tunyasuvunakool; Russ Bates; Augustin Žídek; Anna Potapenko; et al. Highly accurate protein structure prediction with AlphaFold. Nat. 2021, 596, 583-589, .
- Yang Zhang; Jeffrey Skolnick; Scoring function for automated assessment of protein structure template quality. Proteins: Struct. Funct. Bioinform. 2004, 57, 702-710, .
- Adam Zemla.; LGA: a method for finding 3D similarities in protein structures. Nucleic Acids Res. 2003, 31, 3370-3374, .
- Julia Koehler Leman; Pawel Szczerbiak; P. Douglas Renfrew; Vladimir Gligorijevic; Daniel Berenberg; Tommi Vatanen; Bryn C. Taylor; Chris Chandler; Stefan Janssen; Andras Pataki; et al. Sequence-structure-function relationships in the microbial protein universe. Nat. Commun. 2023, 14, 1-11, .
- Randi Vita; James A. Overton; Jason A. Greenbaum; Julia Ponomarenko; Jason D. Clark; Jason R. Cantrell; Daniel K. Wheeler; Joseph L. Gabbard; Deborah Hix; Alessandro Sette; et al. The immune epitope database (IEDB) 3.0. Nucleic Acids Res. 2014, 43, D405-D412, .
- Kristin Johnson; Natural history as stamp collecting: a brief history. Arch. Nat. Hist. 2007, 34, 244-258, .
- Michael Frede. Plato’s Sophist on False Statements; In The Cambridge Companion to Plato; Richard Kraut, Eds.; Cambridge University Press: Cambridge, United Kingdom, 1992; pp. 397-424.
- S A Bero; A K Muda; Y H Choo; N A Muda; S F Pratama; Similarity Measure for Molecular Structure: A Brief Review. null 2017, 892, 012015, .
- Jinrui Xu; Yang Zhang; How significant is a protein structure similarity with TM-score = 0.5?. Bioinform. 2010, 26, 889-895, .
- 1HV4 . RCSB Protein Data Bank. Retrieved 2023-9-6
- Python code to help process files of 3d protein structure (PDB format) . GitHub (accessed on 19 August 2023). Retrieved 2023-8-21
- Yuhe Lianga; Ziqian Huaa; Xue Liang; Qian Xu; Guangying Lua; The crystal structure of bar-headed goose hemoglobin in deoxy form: the allosteric mechanism of a hemoglobin species with high oxygen affinity. J. Mol. Biol. 2001, 313, 123-137, .
- Hong Huang Lin; Surajit Ray; Songsak Tongchusak; Ellis L Reinherz; Vladimir Brusic; Evaluation of MHC class I peptide binding prediction servers: Applications for vaccine research. BMC Immunol. 2008, 9, 8-8, .
- Morten Nielsen; Claus Lundegaard; Peder Worning; Sanne Lise Lauemøller; Kasper Lamberth; Søren Buus; Søren Brunak; Ole Lund; Reliable prediction of T-cell epitopes using neural networks with novel sequence representations. Protein Sci. 2003, 12, 1007-1017, .
- Sinu Paul; Nathan P. Croft; Anthony W. Purcell; David C. Tscharke; Alessandro Sette; Morten Nielsen; Bjoern Peters; Benchmarking predictions of MHC class I restricted T cell epitopes in a comprehensively studied model system. PLOS Comput. Biol. 2020, 16, e1007757, .
- Jonathan W. Yewdell; Jack R. Bennink; IMMUNODOMINANCE IN MAJOR HISTOCOMPATIBILITY COMPLEX CLASS I–RESTRICTED T LYMPHOCYTE RESPONSES. Annu. Rev. Immunol. 1999, 17, 51-88, .