Your browser does not fully support modern features. Please upgrade for a smoother experience.
Please note this is an old version of this entry, which may differ significantly from the current revision.
Accurate lithological mapping is essential in geological surveys and mineral resource exploration. Remote sensing (RS) technology has significantly contributed to geological exploration and mineral resource assessment. Various approaches have been identified to address vegetation obstruction in lithological RS.
- lithology mapping
- machine learning
- deep learning
- remote sensing
- vegetated area
1. Selection and Impact of Data Source
1.1. RS Data Sources
Multispectral data offers significant advantages for lithological classification, including comprehensive spectral information, higher spatial resolution, diverse feature extraction methods, and varied options for band combination. However, data selection should align with the study’s specific characteristics. Lower spatial resolution may reduce classification accuracy and detail retention [1]. Higher spatial resolution provides detailed vegetation and surface information, aiding in lithological distinction. However, increasing spatial resolution can introduce challenges such as mixed pixel problems and data noise [2], which may lead to a decrease in classification accuracy [3]. As the resolution increases, the reduction in pixel area leads to more complex object boundaries and a rise in mixed pixel occurrences. Additionally, pixels that have not been assigned to a specific class are categorized only when their likelihood of belonging to a certain class outweighs that of alternative classes. Nevertheless, as resolution further escalates, the diminishing pixel area and subtle distinctions between objects amplify the challenges posed by data noise, thus ultimately affecting the accuracy of classification. Moreover, multispectral data offers a broader range of spectral information, but the lower spectral resolution between bands can lead to spectral overlap and difficulties in distinguishing different lithological features.
Hyperspectral data is particularly appropriate to SMA and advanced ML algorithms as it offers higher spectral resolution, enabling more accurate estimation of rock and mineral content within finer spectral ranges [4]. Hyperion demonstrates the highest accuracy (0.92) in lithological classification compared to ASTER and Landsat 8 (see Table 1) [5]. However, hyperspectral data presents challenges of large volumes, complex processing, noise, and errors. Surface coverings like vegetation, water bodies, and clouds affect data acquisition and analysis, influencing lithological classification accuracy [6].
Table 1. The average overall accuracy (%) of cross-validation for classification accuracy assessment, modified from [5]. “Proposed” represents a weighted pooling-based ensemble method proposed by the author.
| Classifier | Hyperion | ASTER | Landsat 8 | Combined |
|---|---|---|---|---|
| MD | 49.02 | 66.82 | 63.55 | |
| SAM | 71.24 | 45.21 | 47.16 | |
| SID | 66.43 | 42.38 | 48.22 | |
| SVM | 87.03 | 64.89 | 60.79 | |
| MAXW | 71.98 | 54.21 | 60.78 | 70.80 |
| Proposed | 91.93 | 75.90 | 67.16 | 93.22 |
Radar data, capable of penetrating clouds and surface vegetation, provides information on subsurface rocks, making it advantageous for heavily vegetated areas or regions with less apparent surface lithological features [7]. Using Sentinel-1 with a 10 m spatial resolution and Discrete Wavelet Transformation, Guo et al. [8] achieved 55.6% accuracy in lithological mapping. However, SAR data has lower spatial resolution and lacks color information compared to optical RS, posing challenges in capturing detail and less accurate rock identification and classification. Integration with other data sources is often necessary for comprehensive analysis [9].
1.2. Data Preprocessing and Integration
RS data preprocessing includes various steps such as radiometric correction, atmospheric correction, geometric correction, data registration, data cropping, resampling, data filtering, and data fusion [3][10][11]. Hyperspectral data requires more advanced preprocessing methods than multispectral data due to its higher spectral resolution and larger data volume. These methods aim to reduce data size, eliminate noise and errors, and correct for spectral mixing effects [5]. In contrast, preprocessing methods for multispectral data are relatively simpler, usually involving basic calibration and noise reduction procedures.
Data integration improves the classification accuracy of geological images by combining complementary information. Existing literature suggests various approaches for data fusion: (1) Integration of different multispectral data: Integrating different sources to enhance spatial resolution and represent surface features more accurately [3][12]; (2) Multispectral RS imagery and terrain data: This fusion enables better extraction of features essential for lithological classification, including color, texture, and surface morphology (refer to Figure 1) [11][13][14]; (3) Multispectral data and airborne geophysical data: This integration provides comprehensive geological information, improving the accuracy and level of detail in lithological zoning [15]; (4) Multispectral RS imagery and geochemical survey data: Combining surface cover types, vegetation indices, lithology, and mineral composition information to enhance lithological classification (refer to Figure 2) [2]; (5) Hyperspectral and multispectral imagery: This technique improves spatial and spectral resolution, reduces noise and errors, thereby increasing the accuracy and reliability of lithological identification [5]; (6) Hyperspectral RS and terrain data: Integrating these datasets enhances the detection capability of ground objects, particularly in areas with complex terrain and dense vegetation cover [11]; (7) SAR and terrain data: This fusion approach provides a comprehensive description of terrain and subsurface features, leading to improved accuracy in lithological classification [7].
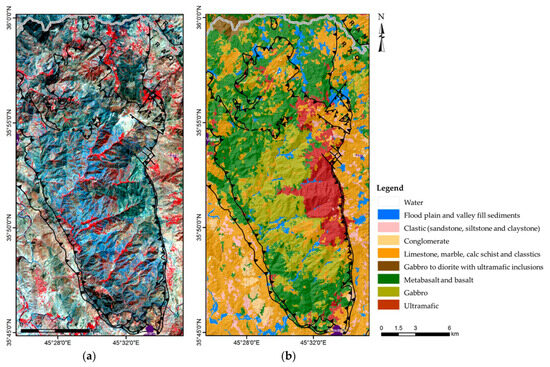
Figure 1. (a) Thrust fault overlapping ASTER data (b) discriminated classes from combined derived from ASTER and DEM data [16].
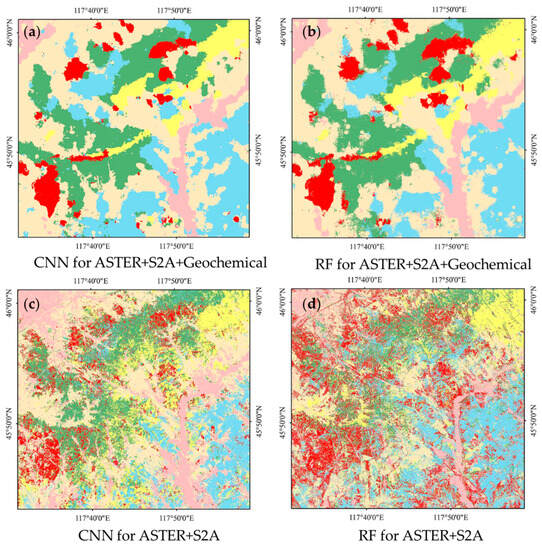
Figure 2. Classification map obtained by (a) CNN based on fused ASTER, Sentinel-2A(S2A), and geochemical survey data, (b) RF based on fused ASTER, RF, and geochemical survey data, (c) CNN based on ASTER and S2A, and (d) RF based on ASTER and S2A, modified from [2].
When conducting data fusion processing, it is crucial to consider challenges such as data inconsistency (varying coordinate systems, resolutions, and spectral ranges), large data volume, and complex data processing tasks (data preprocessing, feature extraction, and data registration) [3].
2. Comparative Analysis of Different Feature Extraction Methods
2.1. Analyze for Dimensionality Reduction/Feature Extraction
Comparing various methods for feature extraction, including PCA, MNF, DWT, and DLAs, requires careful consideration of their respective strengths and limitations. Principal component analysis (PCA) [14] focuses on linear transformations and identifies orthogonal components that capture the maximum variance in the data, reducing dimensionality while preserving crucial information. However, it is sensitive to data distribution and only applicable to linear relationships. Minimum noise fraction (MNF) [4] is designed for noise processing and orders components based on their noise content, enhancing the interpretability of RS images by emphasizing meaningful components. Unlike PCA, the resulting components from MNF transformation [4] may not be orthogonal, implying potential correlations between the transformed axes. Discrete Wavelet Transformation (DWT) [8] in lithological classification offers the extraction of high-frequency and low-frequency components, enhancing classification smoothness and boundary detection. Nonetheless, it has limitations in affecting the high-frequency components of small-sized samples and requires further validation for mapping larger-scale regions. Deep learning algorithms (DLAs) [2] excel in automatic feature learning, high-level information extraction, robustness, and scalability. However, they necessitate substantial data, computational resources, and labeled data, while lacking interpretability and being prone to overfitting. Therefore, careful consideration of the application context and data characteristics is essential when selecting an appropriate method.
2.2. Performance Evaluation and Comparison of Methods for Feature Extraction
This section aims to demonstrate the advantages of feature extraction in lithological mapping within vegetated areas. Comparative analysis of different RS datasets has provided valuable insights into their respective strengths and advantages. For instance, ASTER demonstrated superior performance in lithological identification compared to Sentinel-2, primarily due to its six SWIR bands, while Sentinel-2 excelled in mapping iron-bearing minerals, showcasing the strengths of each dataset [17]. Furthermore, Landsat 8 demonstrated better performance in differentiating lithological units compared to Landsat 7 due to its wider spectral range. However, Landsat 7 exhibited superior capabilities in distinguishing water and clay minerals using specific bands, highlighting the unique advantages of each dataset [18]. Additionally, when comparing ASTER, OLI/Landsat 8, and WorldView-3 datasets, WorldView-3 achieved a higher accuracy rate of 87% [10]. This can be attributed to the SWIR bands of WorldView-3, which contain more diagnostic absorption features, combined with its high spatial resolution, providing more detailed information for lithological classification.
Moving on to feature extraction and fusion, various techniques, such as spectral indices, terrain features, texture features, and dimensionality reduction/feature extraction, have shown their effectiveness in lithological classification. Comparative analysis of classification results has demonstrated that combining multispectral reflectance, terrain features, and PCA with the SVM algorithm yields the best classification results (refer to Table 2 and Figure 3) [13]. Similarly, combining the R, BR, TPI, PCA, and XY features using the RF algorithm led to the highest classification accuracy of 79.66% and a Kappa coefficient of 0.75 [11]. Notably, using only the R and XY features achieved a satisfactory classification accuracy of 74% and a Kappa of 0.68. Adding any additional feature based on these two slightly improved or had minimal impact on classification results. However, introducing two extra feature variables resulted in a significant drop in classification accuracy, with an overall decline of 8% to 10%, accompanied by a reduction of 0.09 to 0.13 in the Kappa coefficient (as shown in Figure 4). Moreover, integrating spectral, texture, terrain, and thermal features, while excluding vegetation features, can lead to optimal lithological classification performance with an overall accuracy of 80.99% (see Figure 5) [14]. Traore [19] used image processing techniques, including band combination, PCA, MNF, and SAM, to generate detailed surface distribution maps of iron oxide minerals, ferrous silicate minerals, clay minerals, and carbonate minerals. These examples highlight the importance of feature selection and extraction in lithological mapping, emphasizing the need to consider the specific characteristics and advantages of different datasets and feature sets for accurate and reliable classification results.
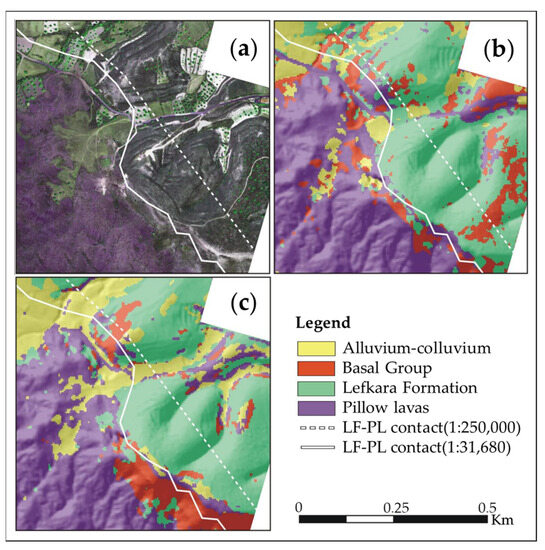
Figure 3. (a) QuickBird image, and lithological maps generated using (b) the best spectral-only algorithm (ATM MNF SOM) and (c) the best integrated spectral–topographic algorithm (ATM-Li MNF SOM) [13].
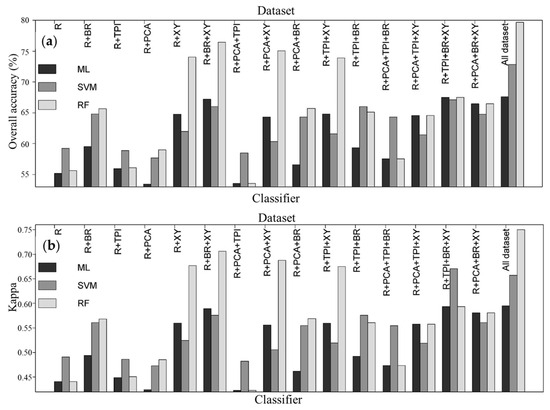
Figure 4. The overall accuracy (a) and kappa (b) for different combination features with ML, SVM, and RF methods [11]. The figure illustrates the representation of various variables, where R denotes reflectance, BR signifies band ratio, TPI represents topographic position index, PCA stands for principal component analysis, and XY indicates spatial features.
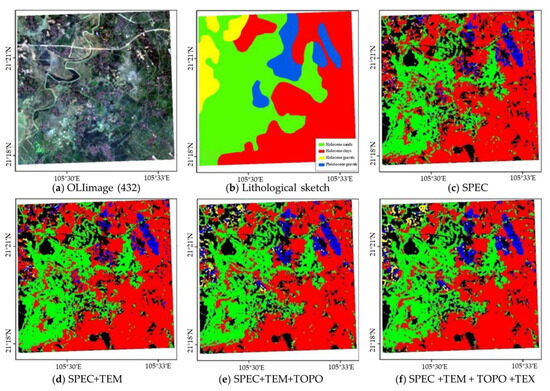
Figure 5. (a) OLI image and (b) lithological sketch of the study area, and lithological classification results of the study area based on (c) spectrum (SPEC), (d) fused SPEC and thermal (TEM), (e) fused SPEC, TEM, and topographic (TOPO), and (f) SPEC, TEM, TOPO, and textural (TEXT), modified from [14].
Table 2. Classification results for MLC and SOM classifiers, adapted from [13]. Li represents terrain features obtained from LiDAR data.
| Variable | MLC | SOM | ||
|---|---|---|---|---|
| OA (%) | Kappa | OA (%) | Kappa | |
| ATM 9 | 61.6 | 0.50 | 60.3 | 0.48 |
| ATM PCA | 51.4 | 0.37 | 50.2 | 0.35 |
| ATM MNF | 59.3 | 0.46 | 65.5 | 0.54 |
| ATM-Li | 61.9 | 0.50 | 70.2 | 0.60 |
| ATM-Li MNF | 60.8 | 0.49 | 72.7 | 0.63 |
3. Selection and Application for Classification Methods
The choice of classification method is crucial in lithological mapping, taking into account the unique strengths and limitations of each method. Considering the specific characteristics of the RS images and the objectives of the classification task is essential when applying these methods. The following comparative analysis highlights the significance of these methods in lithological mapping.
The self-organizing map (SOM) is an unsupervised learning model that leverages artificial neural networks. It incorporates non-parametric, noise-resistant, and pattern-learning capabilities, leading to significant enhancements in lithological classification precision. In the context of detailed lithological mapping of the Troodos ophiolite in Cyprus, the SOM showcased exceptional performance, outperforming MLC and achieving the best classification results with an overall accuracy of 72.7% and Kappa of 0.63 [13]. RF outperformed ML and SVM in terms of overall accuracy, attaining an accuracy rate of 79.66% in the contributed dataset [11]. Additionally, the CNN model surpassed RF in lithological unit classification, resulting in a 5% improvement in overall accuracy [2]. Notably, the CNN model exhibited favorable performance in lithological classification across three small sites in Liuyuan, Gansu Province, China, outperforming classical machine learning methods and neural networks. Among various CNN architectures, the 3D CNN achieved the highest classification accuracy.
Grebby [20] used OBIA with airborne multispectral and LiDAR data to indirectly map lithology by leveraging associations between terrain and vegetation types. They achieved an overall accuracy of 73.5%, which improved the classification accuracy by 13.1% compared to the pixel-based methods. However, the effectiveness of this indirect approach may be limited in larger or more heterogeneous landscapes. In a different study, Shayeganpour et al. [21] employed OBIA with WorldView-3 VNIR imagery for lithology mapping in Hormuz Island, southern Iran. They achieved an overall accuracy of 86.54%, which improved the accuracy by 19.33% compared to the pixel-based classification. These findings demonstrate the potential of OBIA in enhancing the accuracy and reliability of lithology mapping tasks.
Ensemble classifiers and hybrid model integration offer an enhanced solution for lithological classification tasks. In the study conducted by Pal et al. [5], SVM demonstrated commendable classification results compared to MD, SAM, and SID. However, the proposed weighted pooling-based ensemble mapping method outperformed the Majority Voting-based Technique (MAXW) method which relies on the combination of multiple classifiers, with each pixel’s classification result determined by the class that receives the most votes. This enhancement resulted in a significant 22.42% increase in classification accuracy. Hybrid VSM and SVM [22] can effectively suppress vegetation information and achieve direct classification of lithology.
This entry is adapted from the peer-reviewed paper 10.3390/min13091153
References
- Mwaniki, M.W.; Moeller, M.S.; Schellmann, G. A comparison of Landsat 8 (OLI) and Landsat 7 (ETM+) in mapping geology and visualising lineaments: A case study of central region Kenya. Int. Arch. Photogramm. Remote Sens. Spat. Inf. Sci. 2015, 40, 897–903.
- Pan, T.; Zuo, R.; Wang, Z. Geological Mapping via Convolutional Neural Network Based on Remote Sensing and Geochemical Survey Data in Vegetation Coverage Areas. IEEE J. Sel. Top. Appl. Earth Obs. Remote Sens. 2023, 16, 3485–3494.
- Shebl, A.; Csámer, Á. Stacked vector multi-source lithologic classification utilizing Machine Learning Algorithms: Data potentiality and dimensionality monitoring. Remote Sens. Appl. Soc. Environ. 2021, 24, 100643.
- Harris, J.; Rogge, D.; Hitchcock, R.; Ijewliw, O.; Wright, D. Mapping lithology in Canada’s Arctic: Application of hyperspectral data using the minimum noise fraction transformation and matched filtering. Can. J. Earth Sci. 2005, 42, 2173–2193.
- Pal, M.; Rasmussen, T.; Porwal, A. Optimized lithological mapping from multispectral and hyperspectral remote sensing images using fused multi-classifiers. Remote Sens. 2020, 12, 177.
- Peyghambari, S.; Zhang, Y. Hyperspectral remote sensing in lithological mapping, mineral exploration, and environmental geology: An updated review. J. Appl. Remote Sens. 2021, 15, 031501.
- Lu, Y.; Yang, C.; Meng, Z. Lithology discrimination using Sentinel-1 dual-pol data and SRTM data. Remote Sens. 2021, 13, 1280.
- Guo, S.; Yang, C.; He, R.; Li, Y. Improvement of Lithological Mapping Using Discrete Wavelet Transformation from Sentinel-1 SAR Data. Remote Sens. 2022, 14, 5824.
- Cui, S.; Yao, F. Application of PALSAR data in structural information extraction in vegetated area. Geospat. Inf. 2019, 17, 6–9.
- Ye, B.; Tian, S.; Ge, J.; Sun, Y. Assessment of WorldView-3 data for lithological mapping. Remote Sens. 2017, 9, 1132.
- Othman, A.A.; Gloaguen, R. Integration of spectral, spatial and morphometric data into lithological mapping: A comparison of different Machine Learning Algorithms in the Kurdistan Region, NE Iraq. J. Asian Earth Sci. 2017, 146, 90–102.
- Yang, M.; Kang, L.; Chen, H.; Zhou, M.; Zhang, J. Lithological mapping of East Tianshan area using integrated data fused by Chinese GF-1 PAN and ASTER multi-spectral data. Open Geosci. 2018, 10, 532–543.
- Grebby, S.; Naden, J.; Cunningham, D.; Tansey, K. Integrating airborne multispectral imagery and airborne LiDAR data for enhanced lithological mapping in vegetated terrain. Remote Sens. Environ. 2011, 115, 214–226.
- Han, S.; Shuai, S.; Guo, W.; Yang, P. Automatic Classification Method of Quaternary Lithology in Vegetation Cover Area Combining Spectral, Textural, Topographic, Geothermal, and Vegetation; IOS Press: Sanya, China, 2021.
- Shebl, A.; Abdellatif, M.; Hissen, M.; Abdelaziz, M.I.; Csámer, Á. Lithological mapping enhancement by integrating Sentinel 2 and gamma-ray data utilizing support vector machine: A case study from Egypt. Int. J. Appl. Earth Obs. Geoinf. 2021, 105, 102619.
- Othman, A.A.; Gloaguen, R. Improving lithological mapping by SVM classification of spectral and morphological features: The discovery of a new chromite body in the Mawat ophiolite complex (Kurdistan, NE Iraq). Remote Sens. 2014, 6, 6867–6896.
- Salehi, S.; Mielke, C.; Brogaard Pedersen, C.; Dalsenni Olsen, S. Comparison of ASTER and Sentinel-2 spaceborne datasets for geological mapping: A case study from North-East Greenland. Geol. Surv. Den. Greenl. Bull. 2019, 43, e2019430205.
- He, J.; Harris, J.; Sawada, M.; Behnia, P. A comparison of classification algorithms using Landsat-7 and Landsat-8 data for mapping lithology in Canada’s Arctic. Int. J. Remote Sens. 2015, 36, 2252–2276.
- Traore, M.; Wambo, J.D.T.; Ndepete, C.P.; Tekin, S.; Pour, A.B.; Muslim, A.M. Lithological and alteration mineral mapping for alluvial gold exploration in the south east of Birao area, Central African Republic using Landsat-8 Operational Land Imager (OLI) data. J. Afr. Earth Sci. 2020, 170, 103933.
- Grebby, S.; Field, E.; Tansey, K. Evaluating the use of an object-based approach to lithological mapping in vegetated terrain. Remote Sens. 2016, 8, 843.
- Shayeganpour, S.; Tangestani, M.H.; Homayouni, S.; Vincent, R.K. Evaluating pixel-based vs. object-based image analysis approaches for lithological discrimination using VNIR data of WorldView-3. Front. Earth Sci. 2021, 15, 38–53.
- Bachri, I.; Hakdaoui, M.; Raji, M.; Teodoro, A.C.; Benbouziane, A. Machine learning algorithms for automatic lithological mapping using remote sensing data: A case study from Souk Arbaa Sahel, Sidi Ifni Inlier, Western Anti-Atlas, Morocco. ISPRS Int. J. Geo-Inf. 2019, 8, 248.
This entry is offline, you can click here to edit this entry!