Your browser does not fully support modern features. Please upgrade for a smoother experience.
Please note this is an old version of this entry, which may differ significantly from the current revision.
In the town of Sacapulas located in the mountainous country of Guatemala, there is a constant risk of natural disasters. Floods and landslides occur frequently, resulting in the loss of human lives and cultural aspects. Specifically, in the region, the creation of black salt is the most affected.
- space reinterpretation
- Maya
- cultural areas
- historical analysis
- high-risk
- space use
1. Introduction
In recent years, there has been an increase in research related to culture and its inclusion in sustainable development [1][2][3]. Sustainable development is defined as “development that meets the needs of the present without compromising the ability of future generations to meet their own needs.” [4], whose implementation is based on three important pillars: social, environmental, and economical. [1][2]. This effort has been developed over the last few years with joint efforts such as the Sendai framework for disaster risk reduction, a seminal document that seeks to reduce the impact of disasters in terms of loss of life and livelihoods over the next 15 years from its conception [5]. Specifically, emergencies and incidents can escalate into what is known as a disaster if there is no appropriate management method that can effectively resolve the problem. According to the United Nations, disasters can occur anywhere in the world and can last for short to extremely long periods of time. Depending on the affected society, the use of its resources may be limited and result in the need for external assistance to solve it [6]. This is specifically true if the affected communities are located in highly vulnerability areas, where local customs and cultural heritage are more predominant.
Research regarding culture heritage being threatened by climate change has been extensive since 2003 [7][8], and many advancements have been made so far. Specifically, it is understood that climate change can affect culture both in its tangible [9] and intangible forms [10][11]. One response to counteract this issue has been the different approaches to climate change and cultural heritage by implementing a diverse set of tools, using interdisciplinary, multidisciplinary, or transdisciplinary approaches [12]. A good example is the US National Park Service (NPS), based on a four-pillar approach: science, mitigation, adaptation, and communication [13]. Meanwhile, in developing countries, programs such as UNESCO Local and Indigenous Knowledge Systems (LINKSs) present means to implement intangible cultural heritage (ICH) into disaster management processes. These pockets of knowledge are found in many cultures across the globe and give invaluable insight on the adaptability of a society towards climate change and potential disasters. While ICH is a term rarely used in the Disaster Risk Reduction and Management literature, the proxy terminology “Indigenous knowledge systems and practices” (IKSPs) is more common [9][14]. LINKS has proven to be effective in the implementation of local knowledge with science and environmental policy processes [14].
This international effort has not been fully evidenced in the Latin American country of Guatemala, where the erosion of authority figures results in longer, slower decision making, along with insufficient risk reduction programs [15][16][17]. Guatemala does include disaster risk governance in its legislation, which is included in the legislative decree 109-96 called “Law on the National Coordinator for Disaster Reduction”. Enacted in 1996, it put Guatemala as one of the countries with laws adjusted to the era [18]. This law was based on the Yokohama Strategy and Framework for Action, which gives priority attention to developing countries [19].
Currently, disasters of great magnitude in Guatemala are normally addressed with foreign cooperation such as USAID [20]. Yet, the international help does not reach smaller and less known Mayan communities such as the town of Sacapulas. The town of Sacapulas is a small town located in the Cuchumatanes mountain range in Guatemala. To the north of the village is the Chixoy River, which flows to the south of Mexico. The importance of this town is due to black salt. This product is the result of more than a thousand years of uninterrupted tradition by the Sacapultecos, a Mayan group with roots in the land. The influence of this product has been so great that the black salt industry has been a key part of the Mayan history of the native people of Guatemala. To create black salt, it is necessary to use an area called “Black Salt Beach”, located north of the village where the Chixoy River flows. This is a Mayan village that has historically used natural resources to maintain both economic and environmental sustainability. Sadly, due to climate change, industry and local culture are being threatened by constant floods produced by the Chixoy River. It is known that Mayan society has been always vulnerable towards natural disasters [21][22][23]. Yet, in the last years, the region has experienced an increase in natural disasters [24]. According to the World Risk Report of 2022, Guatemala is found to be 45th on vulnerability, presenting high risk against natural disasters and a high lack of adaptive capabilities [25].
The vulnerability presented in the town of Sacapulas is linked to the Chixoy River and its constant floods over the beach and town. As a consequence, the industry has shrunk. Moreover, without effective architectural planning at hand, the city’s growth has been haphazard. Furthermore, leadership has neglected the space, which results in its constant loss. Previously, most of the Sacapulas town created the salt; nowadays, only four people, who are in an advanced stage of life, are working. Without a space to create this product, there is a major concern for the total loss of Mayan culture that has been developed for over a thousand years (Figure 1).
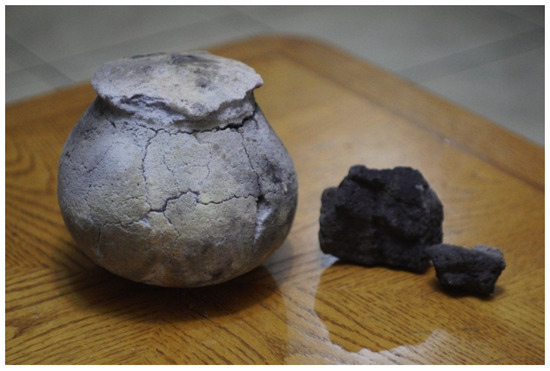
Figure 1. Black salt product (Source: Author).
Guatemala is a country in Central America bordered by Mexico to the north; Belize and the Caribbean Sea to the northeast; Honduras to the east; El Salvador to the southeast; and the Pacific Ocean to the south. The country is mountainous in character due to the “Sierra de Los Cuchumatanes”: a mountain range throughout Central America. This results in variations in topographical elevation between 500 m and 3800 m. As a result, several towns and cities are located all across this terrain variation. Although the capital of the country is home to a variety of cultures and races, the interior of the country presents a diversity of mostly indigenous Mayan villages. Most of them live in mountainous, remote areas.
As for natural disasters, hurricanes, earthquakes, and volcanic eruptions are common due to the country’s location (Middle Caribbean and Pacific, where three tectonic plates meet). However, lately, floods and landslides have become quite common compared to other years, resulting in the loss of lives and homes (Figure 2).
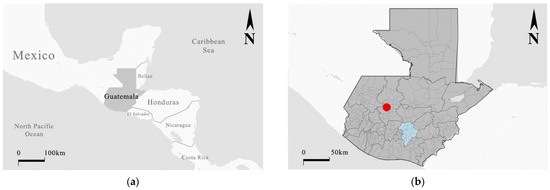
Figure 2. (a) Geographical location of Guatemala. (b) Research area, in red. Capital of Guatemala in blue. (Source: Author).
2. Original Beach Area
Within the interviews, respondents were asked about their knowledge of the black salt area. PSS-A1,2 mentions the existence of the beach from the current site to the area where there is a pit (area D in Figure 3). He also mentions that the current area was defined by a mango tree, which was found during the site visit. Meanwhile, MSS-D mentions the dimensions that the beach originally extended to the entrance of the village, where there is now a bridge. This assumes a distance of 206.20 m across the shore of the beach to the west, which is now lost. This was reiterated by MSS-H, who mentions the existence of a cavern with hot water located in this space. The cavern is only used during the dry season, when the flow of the Chixoy River is low. At the time of development of this research, it could not be accessed. This cavern is used by the people as a hot space area and is an attraction to tourists from nearby villages. When micro-analyzing the interviews, three themes were found to be constantly mentioned by the interviewees. These three themes are consequences of various factors that impact the black salt beach. As a result of the space, the black salt industry and the salt workers are negatively affected.
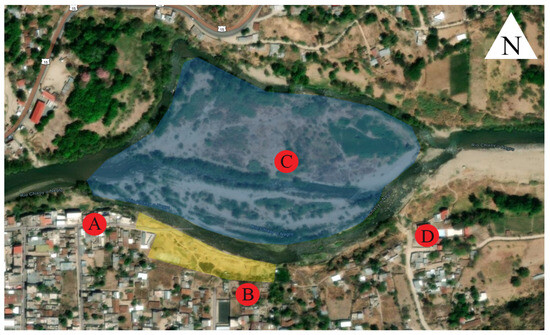
Figure 3. Black salt beach and the 4 main points that present modifications due to river Chixoy. Areas “A” to “D” where the focus of this analysis due to the constant changes presented. Area “A” is the west road connecting to the current salt beach, area “B”. Meanwhile, area “C” is the space which Ordoñez Chocano mentions as previous salt beach area. This is corroborated by area “D”, where a road that connects to nowhere is located. This area currently is in ruins, and the state of the road close to the river Chixoy is extremely deplorable. [Esri historical map location of the salt beach area, inside Sacapulas’ town. Modified by author]. Retrieved from https://livingatlas.arcgis.com/wayback accessed on 2 January 2023.
3. Lost Space
The people interviewed agreed on natural disasters as the primary cause of lost space; however, several events were mentioned that were not previously documented by any media. The natural disasters that have affected the area have been on five occasions according to research in the area: the late 1930s, 1949, and 1964. In the period from 2010 to 2021, there have been floods documented by local newspapers [26][27][28]. However, interviews documented three other major events that occurred in 1951, 1976, and 1998. It can be observed that the area is constantly hit by natural disasters; however, it is not the type of disaster but the magnitude thereof that modifies the area. MSS-A mentions that in 1951, a flood which threatened the welfare of the people occurred. Meanwhile, in 1976, an earthquake which undermined part of the beach area occurred, destroying the infrastructure of the town of Sacapulas. Specifically, the kitchens used for the creation of black salt were mostly destroyed due to their rudimentary construction. It was identified that there are three kitchens still standing that were used by the salt-makers during the dry season. However, the actual location of the previous kitchens and its number are beyond the scope of this research.
Following this, according to MSS-C, in 1998, Hurricane Mitch affected the town with constant torrents of water that increased the flow of the river affecting the beach area. All this was worsened at the beginning of the 21st century with storm Stan in 2005 and hurricane Agatha in 2010. Both not only reduced the remaining beach space, but also threatened the lives of the people of Sacapulas due to the subsidence caused by the Chixoy River. As mentioned above, there is no documentation in the form of photographs or plans that verify the original size of the space. However, all interviewees conclude that each of the natural disasters that have occurred have in some way reduced either the interest in black salt or the space utilized. During this research, it was expected that the area of the beach would be quite extensive. Yet, when it was accessed, it was found that the majority of the space is buried and effectively lost. Due to the missing visual information, there is no way to understand the development and modifications of the area to make a comparative analysis. Though, it is understood that the space is perceived less as a “beach” and more as a “unused land” by the townspeople. This is mainly due to most of the area being used as cattle growing space. At the moment of this writing, there is only one active space belonging to MSS-A; this is due to its location being relatively far from the Chixoy River (35 m). According to the interviewee, it took 4 years to dig up part of the area and reactivate its use.
4. Ownership
The use of the beach space is defined by the “petaquillas” that each owner has. As such, an owner is usually designated to have “X amount of petaquillas” instead of “X square meters”. However, due to flooding as well as the irregular nature of the definition of the spaces, the official delimitations have been lost. MSS-B mentions the lack of official ownership documents as an important cause of the loss of space. They also mention the disinterest of their sons to stay in the black salt industry. This is reiterated by both MSS-E, D, and F, daughters of salt farmers. However, MSS-B, D, and E mention that sons of other ex-salt-makers have legally and illegally taken over part of the beach to privatize it. This is due to the fact that the entire area of the beach has thermal waters when they open a hole in the ground. Because of its potential economic value as well as use, areas of the beach have slowly been privatized. This cannot be legally counteracted. MSS-B mentions that due to the lack of studies of the previous salt-makers, the necessary documents to define the owners were not prepared. As a result, at this moment, ownership of beach areas is in doubt. In addition, people have no interest in or doubt the effectiveness of legal methods to protect the public area.
5. Rites and Religion
The loss of space also affects people who are interested in being part of the black salt industry. As a consequence, sustainability within the area has been negatively impacted. One of the aspects that people interviewed mentioned is the loss of Mayan rites related to the black salt space. MSS-A1 mentions that in the past, there were festivities in which the grandparents were part of, bringing together young people and people from the village in their celebration. This celebration was mentioned by Monaghan and Reyna previously, and in the document, there are photos of several people attending this event. However, between the period from 1978 and the writing of this research, there has been no photographic data or research mentioning the event. MSS-C mentions that, with the death of MSS-E and D’s father, the celebration is effectively dead, and there are no documents specifying the steps to hold the event. The last celebration of the event was in 2002 according to MSS-A, where only three people attended. Upon further inquiry with the interviewees, the type of information is fragmented due to their age, so only fragments of what happened on that day were documented.
The black salt is also related to the history and founding of the town according to the literature research previously conducted. However, when asked about the knowledge of the Mayan ties that link the town of Sacapulas with the black salt, only one of them said to have knowledge about them. In the same way, this person partially described the creation myth which appears in the Mayan chronicle “Titulo de los señores de Sacapulas”, which certifies the veracity of his knowledge.
6. GPS Observations
In 2015, CONRED performed a risk analysis of the existing risk in the area. This report determined that the area near the river is under a constant threat of flooding. The images obtained by GPS together with the work done by CONRED determine not only a risk of flooding, but also constant changes in the flow of the Chixoy River [29]. Subsequently, the area of the black salt beach is the most affected because it is a public space without any significant construction. Considering the above, it is likely there has been a change since the last research performed in 2004. Using the “livingAtlas Arcgis” system, five different dates were identified on which there was a significant change in the area due to flow increases of the Chixoy River. The photographs showing the changes are as follows: 6 February 2011; 11 July 2012; 26 April 2014; 26 November 2019; and 31 March 2021. Previous imaginary could not be found at the moment of writing.
By comparing the image data, four points were identified where there is a constant change due to the river flow. The northern area delimited in blue is what is called the “island” according to Ordoñez; of which, he comments “On the left bank of the Rio Negro or Chixoy, you can see the island, full of trees, under which the other half of the salt beach area is buried.” [30], p. 166 (Figure 4 and Figure 5).
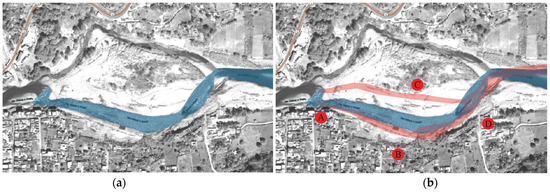
Figure 4. Comparison between the earliest image available, and the oldest: February 2011 (a) and November 2019 (b). Chixoy River flow in February 2011: blue. Chixoy River flow in November 2019: red. By focusing on the analysis areas “A” to “D”, it is evident that constant modifications have occurred during the past years. [Esri historical map location of the salt beach area, inside Sacapulas’ town. Note how the river has changed its flow to the south, as well as regularize the shape of its current compared to the flow it had in 2011. Modified by author]. Retrieved from https://livingatlas.arcgis.com/wayback accessed on 2 January 2023.
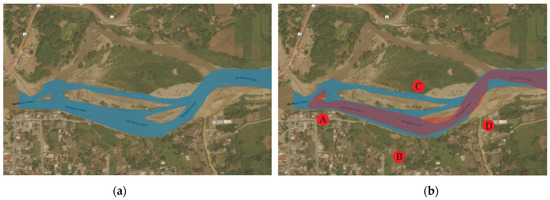
Figure 5. Comparison between July 2012 (a) and April 2019 (b). Chixoy River flow in July 2012: red. Chixoy River flow in April 2019: blue Esri (n.d.). On this case, the focus areas “A” to “D” present modifications, yet it is area “C” the one that is modified the most. [Esri historical map location of the salt beach area, inside Sacapulas’ town. Note how the river has changed its flow to the south. As well as regularize the shape of its current compared to the flow it had in 2012. Modified by author]. Retrieved from https://livingatlas.arcgis.com/wayback accessed on 2 January 2023.
When analyzing the oldest available aerial photography and the most recent images, it is evident that there is a constant loss of land at points B and D. Also, the birth of a small river at point C is probably due to the increased flow of the Chixoy River. It is also evident how the river regularizes the shape of its current, becoming less crooked and less curved. Meanwhile, the July 2012 photo shows new divisions that cut the land of the “island” into three parts (area C in Figure 6). Compared to the flow presented in 2011, the river has grown considerably. It is also evident that the meander of the river has increased considerably in size, reducing the beach space.
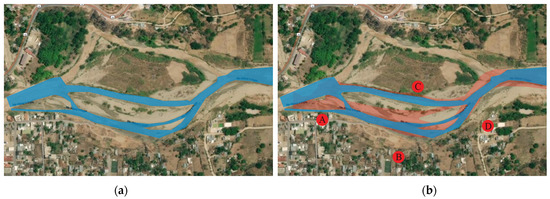
Figure 6. Comparison between April 2019 (a) and November 2019 (b). Chixoy River flow in April 2019: red. Chixoy River flow in November 2019: blue. On this case, it can be seen that the area “B” (the current salt beach) and area “C” (the previously mentioned lost space) are the most affected due to the influence of the river. [Esri historical map location of the salt beach area, inside Sacapulas’ town. Note how the river meander tends to move southward. Modified by author]. Retrieved from https://livingatlas.arcgis.com/wayback accessed on 2 January 2023.
The photo from April 2019, shows a reduced flow compared to 2012, however the intermediate partition was maintained. There is evidence of the intermediate partition moving southward. There is no significant variation at point B. The last available photo showing changes is also from 2019. Taken in November, there is a loss of area due to the meandering of the river. In addition, the flow of the river has increased considerably. After 2019, the Chixoy River is the same.
Only satellite data confirm that there is a constant movement of the river channel due to increased inflow during the last few years. The loss of the salt beach area is precisely because of the prominence in river meandering at point B. The river inflow was strong enough to generate separation at point C in 2011. According to comments by subjects PSS-A 1 and MSS-H, the original beach reached as far as point D. There are also mentions by the chronicler Don Martyn Alfonso Tovilla about the extension of the beach territory. This mention reinforces the idea that the meander of the river was less prominent in the 19th century and non-existent in colonial times. Finally, according to the photographic data, only the beach area is affected since point A (connection to the town of Sacapulas) does not seem to be modified in any way.
It is worth mentioning that this visual analysis does not show how the town of Sacapulas reintegrates the “island” area. Furthermore, the site visit confirmed that this area is abandoned. Areas A and D show slight changes in the course of the river in 2014 (Figure 7).
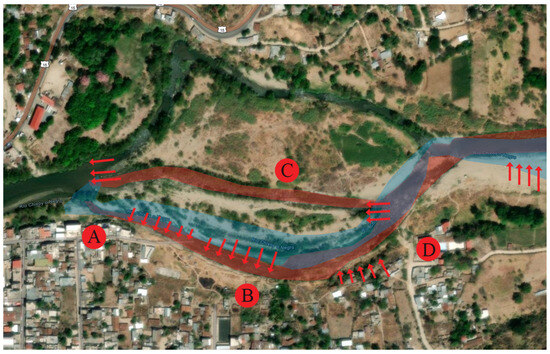
Figure 7. Summary of the Chixoy river movements from 2011 to 2019. Chixoy River flow in April 2019: red. Chixoy River flow in February 2011: blue. As discussed, the analysis areas of “A” to “D” are affected constantly due to the Chixoy river. The red arrows present the movement of the Chixoy river during the years. [Esri historical map location of the salt beach area, inside Sacapulas’ town. Modified by author]. Retrieved from https://livingatlas.arcgis.com/wayback accessed on 2 January 2023.
According to the information obtained by subjects PSS-A 1 and MSS-H during the two interviews, the area of the beaches started from a mangal (mango tree still existing in the current area of the black salt) to the pit (a pit located at point D, where two churches currently exist). This means there is a constant loss of land from point B (meander of the river) to point D (mentioned by interviewees).
7. Planimetry Observations
The current beach area is located north of the town of Sacapulas, next to the Chixoy River. During the site visit, it became evident that, compared to the few existing images of the area, the beach area has been almost totally modified. With the help of the plans, it was possible to analyze the total area of the salt beach. The area can be divided into five different types according to its condition and use. The current surface area is 4873.42 m2, of which almost 57% is covered with soil. Meanwhile, 23% is partially excavated, and MSS-A uses only 5% of this space. His area is the only one known to still be used at time of doing this research. According to his information, his land was excavated by him, and this process took about four years according to the interview (2010 to 2014). Of the total area, almost 4% is dedicated to roads. These roads are dirt roads, so they do not represent any formality in their development nor a regularity in their width.
According to interviews, the method of the decision to shape these roads is still being determined. However, it is hypothesized that it was primarily due to functional reasons caused by the different activities found in the area. These range from obtaining salt-impregnated soil to digging holes in the shore and obtaining hot water (hot springs). A specific activity found in the area is cattle ranching. This is carried out irregularly through the use of six constructions (huts) identified within the area. Due to the disuse of the buried area (55.76% of the total space), cattle use this area for feeding. From the interviews, it is impossible to determine the legality of these constructions, although it is known that at least some of them belong to direct relatives of former salt workers (Figure 8, Figure 9 and Figure 10).
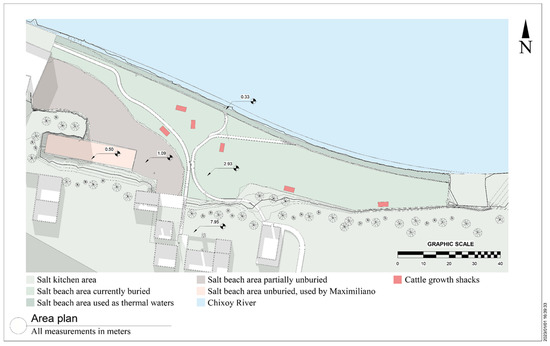
Figure 8. Area plan of the salt beach.
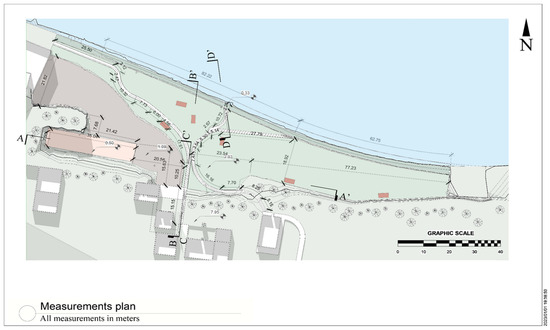
Figure 9. Measurement plan of the salt beach. The lines “A” through “D” are section lines represented in Figure 16. Section A and B represent the entirety of the terrain, while C and D represent significant changes in elevation.
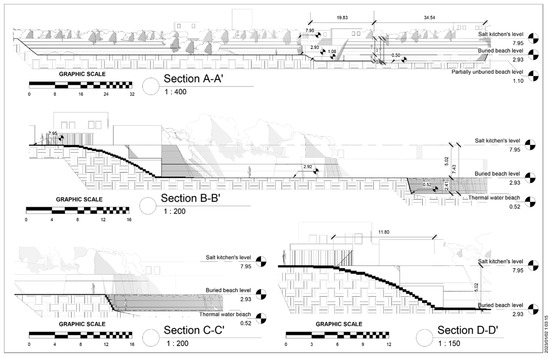
Figure 10. Sections of the salt beach.
To create the black salt, it is necessary to use architecture specific to the town of Sacapulas called “Cocinas de sal” (salt kitchens). These kitchens serve as a space to boil the earth impregnated with salt; they also serve as warehouses to manage all the earth with salt to be used throughout the year. The location of these kitchens is south of the actual salt beach, and their access road is made of concrete and stone steps located in connection with the area of the kitchens (Table 4). After finishing the site measurements, it was determined that they do not follow a specific width. This is due to nature growing to the sides of the steps, reducing the usable area. They also do not present rest areas in between certain amount of steps, resulting in an excessive amount of energy needed to transit such stairs. It is known that at least one salt-maker (MSS-A1) uses this trail to access his area. This is an extreme danger due to his advanced age which can potentially result in future negative consequences (Figure 11, Figure 12, Figure 13 and Figure 14).
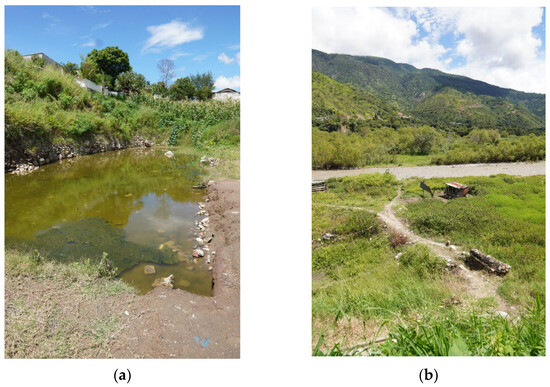
Figure 11. (a) Unburied salt beach, the only place still used my MSS-A (Maximiliano). (b) Irregular roads located inside the buried salt beach.
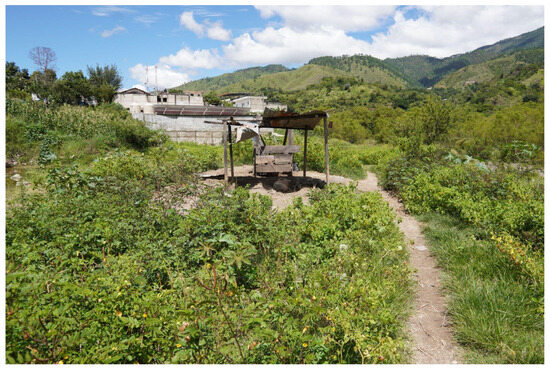
Figure 12. Huts used by people to raise cattle. The legality of these spaces is yet to be determined.
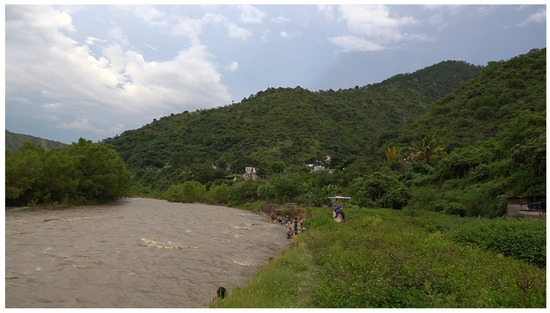
Figure 13. Sacapulas people using the black salt beach’s shore as a bathing area. This is due to the thermal waters found by opening a hole in the shore.
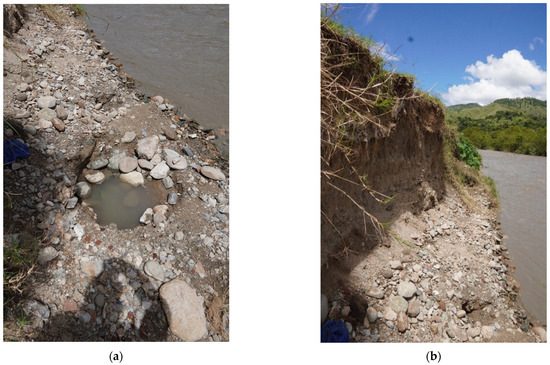
Figure 14. (a) Example of the hole opened in the shore to extract thermal waters (b) Shore of the beach. It can be noticed the amount of soil that has accumulated in the beach, resulting in the space lost and industry shrunk.
This entry is adapted from the peer-reviewed paper 10.3390/su151612591
References
- Sabatini, F. Culture as fourth pillar of sustainable development: Perspectives for integration, Paradigms of Action. Eur. J. Sustain. Dev. 2019, 8, 31.
- Durrant, L.J.; Vadher, A.N.; Teller, J. Disaster Risk Management and cultural heritage: The perceptions of european world heritage site managers on disaster risk management. Int. J. Disaster Risk Reduct. 2023, 89, 103625.
- Durrant, L.J.; Vadher, A.N.; Sarač, M.; Başoğlu, D.; Teller, J. Using organigraphs to map disaster risk management governance in the field of Cultural Heritage. Sustainability 2022, 14, 1002.
- Brown, M.L. Sustainable development. In Oxford Research Encyclopedia of International Studies; Oxford University Press: Oxford, UK, 2017.
- United Nations Office for Disaster Risk Reduction. Sendai Framework for Disaster Risk Reduction 2015–2030—PreventionWeb. 18 March 2015. Available online: https://www.preventionweb.net/files/43291_sendaiframeworkfordrren.pdf (accessed on 12 June 2023).
- United Nations. Risks and Disasters. Available online: https://www.un-spider.org/risks-and-disasters (accessed on 12 June 2023).
- Fatorić, S.; Seekamp, E. Are cultural heritage and resources threatened by climate change? A systematic literature review. Clim. Chang. 2017, 142, 227–254.
- Daly, P.; Ninglekhu, S.; Hollenbach, P.; McCaughey, J.W.; Lallemant, D.; Horton, B.P. Rebuilding Historic Urban Neighborhoods After disasters: Balancing disaster risk reduction and heritage conservation after the 2015 earthquakes in Nepal. Int. J. Disaster Risk Reduct. 2023, 86, 103564.
- Lawangen, A.; Roberts, J.K. Interactions between disaster risk reduction and intangible culture among indigenous communities in Benguet, Philippines. Int. J. Disaster Risk Reduct. 2023, 94, 103801.
- Vhurumuku, E.; Mokeleche, M. The nature of science and indigenous knowledge systems in South Africa, 2000–2007: A critical review of the research in Science Education. Afr. J. Res. Math. Sci. Technol. Educ. 2009, 13 (Suppl. S1), 96–114.
- Rosa, A.; Santangelo, A.; Tondelli, S. Investigating the integration of cultural heritage disaster risk management into urban planning tools. The Ravenna Case Study. Sustainability 2021, 13, 872.
- Hambrecht, G.; Rockman, M. International approaches to climate change and cultural heritage. Am. Antiq. 2017, 82, 627–641.
- UNESCO. Local and Indigenous Knowledge Systems (Links). UNESCO.org. 1 January 1970. Available online: https://www.unesco.org/en/links (accessed on 12 June 2023).
- Fernandez, M. Risk perceptions and management strategies in a post-disaster landscape of Guatemala: Social conflict as an opportunity to understand disaster. Int. J. Disaster Risk Reduct. 2021, 57, 102153.
- García Lemus, V.M. Disaster risk governance in the midst of the COVID-19 pandemic in Central America: The case of Guatemala. Pandemic Risk Response Resil. 2022, 51–60.
- Castillo, J.G.; Hernandez, M.A. The unintended consequences of confinement: Evidence from the rural area in Guatemala. J. Econ. Psychol. 2023, 95, 102587.
- Congreso de Guatemala. Decreto Legislativo ley 109-96. Decreto Legislativo 109-96. 7 November 1996. Available online: https://www2.congreso.gob.pe/sicr/cendocbib/con2_uibd.nsf/52B034338E20D4570525770C0060034B/$FILE/Decreto_109.pdf (accessed on 12 June 2023).
- United Nations Office for Disaster Risk. Yokohama Strategy and Plan of Action for a Safer World: Guidelines for Natural Disaster Prevention, Preparedness and Mitigation. PreventionWeb. 4 February 2009. Available online: https://www.preventionweb.net/publication/yokohama-strategy-and-plan-action-safer-world-guidelines-natural-disaster-prevention# (accessed on 12 June 2023).
- U.S. Agency for International Development. Guatemala: Humanitarian Assistance. 31 May 2023. Available online: https://www.usaid.gov/humanitarian-assistance/guatemala (accessed on 12 June 2023).
- Me-Bar, Y.; Valdez, F. On the vulnerability of the ancient maya society to natural threats. J. Archaeol. Sci. 2005, 32, 813–825.
- Sioui, M.P. Drought in the Yucatan: Maya perspectives on tradition, change, and adaptation. In Current Directions in Water Scarcity Research; Elsevier: Amsterdam, The Netherlands, 2019; Volume 2, pp. 67–75.
- Turner, B.L.; Sabloff, J.A. Classic period collapse of the Central Maya Lowlands: Insights about human–environment relationships for Sustainability. Proc. Natl. Acad. Sci. USA 2012, 109, 13908–13914.
- SGCCC. Primer Reporte de Evaluacion del Conocimiento Sobre CAMBIO CLIMATICO en Guatemala. 1er Reporte de Cambio Climatico en Guatemala. 2019. Available online: https://www.sgccc.org.gt/wp-content/uploads/2019/07/1erRepCCGua_Introduccion.pdf (accessed on 12 June 2023).
- World Risk Report 2022. Bündnis Entwicklung Hilft, Ruhr University Bochum—Institute for International Law of Peace and Conflict 2022. Available online: https://weltrisikobericht.de/weltrisikobericht-2022-e (accessed on 12 June 2023).
- Sabbioni, C.; Cassar, M.; Brimblecombe, P.; Lefevre, R.A. Vulnerability of Cultural Heritage to Climate Change. Pollut. Atmos. 2009, 202, 157–169.
- Oliva, W. Reportan Inundación Súbita en Sacapulas, Quiché. Prensa Libre. 1 July 2021. Available online: https://www.prensalibre.com/ahora/ciudades/quiche/reportan-inundacion-subita-en-sacapulas-quiche/ (accessed on 12 June 2023).
- Inundación en Quiché Deja Daños, Heridos y un fallecido. Cruz Roja Guatemalteca. Available online: https://www.cruzroja.gt/noticias/inundacion-en-quiche-deja-danos-heridos-y-un-fallecido/ (accessed on 12 June 2023).
- CONRED. Boletín Informativo no. 2790—LLUVIAS de las Últimas 24 Horas Afectan a 46 Personas. 24 August 2012. Available online: https://conred.gob.gt/boletin-informativo-no-2790-lluvias-de-las-ultimas-24-horas-afectan-a-46-personas/ (accessed on 12 June 2023).
- CONRED. Disaster Maps. 2015. Available online: https://conred.gob.gt/mapas/municipales_ameindes/QUICHE/SACAPULAS/QUICHE%201416.pdf (accessed on 3 March 2023).
- De Fuentes y Guzmán, F.A. Recordación Florida; Dirección General del Diario de Centro América y Tipografía Nacional: Ciudad de Guatemala, Guatemala, 2012.
This entry is offline, you can click here to edit this entry!