Siboglinids were sampled from four mud volcanoes in the Gulf of Cádiz (El Cid MV, Bonjardim MV, Al Gacel MV, and Anastasya MV). These invertebrates are characteristic of cold seeps and are known to host chemosynthetic endosymbionts in a dedicated trophosome organ. However, little is known about their tube as a potential niche for other microorganisms. Analyses by scanning and transmission electron microscopy showed dense biofilms on the tube in Al Gacel MV and Anastasya MV specimens by prokaryotic cells. Methanotrophic bacteria were the most abundant forming these biofilms as further supported by 16S rRNA sequence analysis. Furthermore, elemental analyses with electron microscopy and energy-dispersive X-ray spectroscopy point to the mineralization and silicification of the tube, most likely induced by the microbial metabolisms. Bacterial and archaeal 16S rRNA sequence libraries revealed abundant microorganisms related to these siboglinid specimens and certain variations in microbial communities among samples. Thus, the tube remarkably increases the microbial biomass related to the worms and provides an additional microbial niche in deep-sea ecosystems.
- Siboglinidae, biominera, cold seeps
Specimen Collection
Field experiments were approved by the Spanish Ministry of Science, Innovation and Universities (project SUBVENT CGL2012-39524-C02 and project EXPLOSEA CTM2016-75947) and the Irish Marine Institute (project Deep-Links: Ecosystem services of deep-sea biotopes CE15012). Different small siboglinid specimens were recovered from different mud volcanoes (MV) in the Gulf of Cádiz (Table 1). El Cid MV, Bonjardim MV and Al Gacel MV were sampled during the 2014 Subvent-2 cruise (R/V Sarmiento de Gamboa) using the Portuguese remote operated underwater vehicle (ROV) Luso, while the Anastasya MV was sampled during the 2015 Deep-Links cruise (R/V Celtic Explorer) using the ROV Holland (Figure 1). Both underwater vehicles carry a CTD sensor (ROV Luso also has as CH4 sensor) to measure different water variables such as depth, temperature, oxygen, pH, and redox potential. From each mud volcano between 5 and 10 specimens were fixed for transmission and scanning electron microscopy (TEM and SEM, respectively), and between 10 and 15 specimens were stored in ethanol or kept at −80 °C for staining technics and DNA analysis.
Table 1. Exact sampling sites and variables’ measurement obtained from CH4 and CTD sensors of the ROVs.
|
Mud Volcano |
Coordinates |
Depth (m) |
T (°C) |
O2 (%) |
CH4 |
pH |
ORP (mV) |
Description |
|
El Cid |
35° 26.32’ N 7° 29.03 W |
1229 |
9.6 |
57 |
Yes |
7.86 |
214 |
Grey mound surrounded by non-chemosynthetic fauna |
|
Bonjardim |
35° 27.52’ N 8° 59.99’ W |
3051 |
2.8 |
6.14 |
Yes |
7.91 |
188 |
Mud breccia with strong sulfidic smell and shells of chemosynthetic bivalves |
|
Al Gacel |
35° 26.47’ N 6° 58.27 W |
791 |
10 |
54 |
Yes |
7.88 |
149 |
Bottom of AOM authigenic carbonate from pockmark with active bubbling |
|
Anastasya |
36° 31.32’ N 7° 9.02 W |
461 |
Yes |
Black mud underneath white sulfur-oxidizing bacterial mat with active bubbling |
Transmission Electron Microscopy (TEM)
Specimens from Al Galcel MV and Anastasya MV were fixed in 2.5% (w/v) glutaraldehyde. After washing several times with phosphate-buffered saline (137 mM NaCl, 2.7 mM KCl, 10 mM Na2HPO4, 1.8 mM KH2PO4, pH 7.4), a dehydration series was performed (15%, 30%, 50%, 70%, 95%, and 100% aqueous ethanol solution), followed by embedding the samples with Medium LR white resin (Plano, Wetzlar, Germany). Polymerization of the resin was at 60 °C during 24 h. A milling tool (TM 60, Fa. Reichert & Jung, Vienna, Austria) was used to make a truncated pyramid on the gelatin capsules. Furthermore, an ultramicrotome (Ultracut E, Reichert & Jung, Vienna, Austria) and glass knives were used for obtaining ultrathin sections of the sample. Ultrathin sections were 80 nm in thickness, mounted on 300 mesh specimen Grids (Plano, Wetzlar, Germany), further stained with 4% (w/v) uranyl acetate (positive stain). The sections were inspected in a Jeol EM 1011 transmission electron microscope (Jeol, Eching, Germany).
Scanning Electron Microscopy (SEM) and Energy-Dispersive X-Ray Spectroscopy (EDX) Analysis
While specimens from El Cid MV and Anastasya MV were dehydrated without prior fixation, specimens from Al Gacel MV were fixed in 2.5 % (w/v) glutaraldehyde to maintain the native organic structures. After washing several times with phosphate-buffered saline, a dehydration series was performed (15%, 30%, 50%, 70, 80%, 90%, 95%, and 100% aqueous ethanol solution), followed by hexamethyldisilazane (HMDS; Sigma-Aldrich, Germany) in order to avoid drying artifacts. Samples were mounted on SEM sample holders and sputtered with Au–Pd (13.9 nm for 120 s). They were further visualized in a SEM LEO 1530 Gemini (Zeiss, Oberkochen, Germany) combined with an INCA X-ACT EDX.
Fluorescent Staining of Chitin Tubes
Tubes of specimens recovered from the Al Gacel MV were stained with calcofluor white (Merck, Darmstadt, Germany) to identify the chitin tube. Following previous staining of the samples, they were fixed on a slide and embedded in paraffin followed by a graded ethanol series (100%, 90%, 70%, and 50%). Afterwards, one drop of staining and one drop of KOH 10% were placed onto the slide with the sample. The samples were examined under normal light and a UV filter with an excitation ranges between 450 and 490 nm of a Zeiss Axioplan microscope (Zeiss, Oberkochen, Germany).
DNA Extraction and Amplification of Bacterial and Archaeal 16S rRNA Genes
Between 10 and 15 specimens (bulk of empty tubes and worms inside of tubes) from El Cid MV, Bonjardim MV, Al Gacel MV and Anastasya MV were used for this analysis. Total DNA was isolated with Power Soil DNA Extraction Kit (MO BIO Laboratories, Carlsbad, CA, USA) according to manufacturer’s instructions. Bacterial amplicons of the V3 – V4 region were generated with the primer set S-D-Bact-0341-b-S-17 / S-D-Bact-0785-a-A-21, with added Illumina adapter overhang nucleotide sequences (forward primer: 5′-TCG TCG GCA GCG TCA GAT GTG TAT AAG AGA CAG CCT ACG GGN GGC WGC AG-3′; reverse primer: (5′-GTC TCG TGG GCT CGG AGA TGT GTA TAA GAG ACA GGA CTA CHV GGG TAT CTA ATC C-3′) [1]. Likewise, archaeal amplicons of the V3 – V4 region were generated with the forward primer based on Arch514Fa (5′-TCG TCG GCA GCG TCA GAT GTG TAT AAG AGA CAG GGT GBC AGC CGC CGC GGT AA-3′) and the reverse primer (5′-GTC TCG TGG GCT CGG AGA TGT GTA TAA GAG ACA GCC CGC CAA TTY CTT TAA G-3′) [2]. The PCR reaction mixture for bacterial DNA amplification, with a total volume of 50 µl, contained 1 U Phusion high fidelity DNA polymerase (Biozym Scientific, Oldendorf, Germany), 5% DMSO, 0.2 mM of each primer, 200 μM dNTP, 0.15 μL of 25 mM MgCl2, and 25 ng of isolated DNA. Furthermore, PCR protocol for bacterial DNA amplification was: initial denaturation for 1 min at 98 °C, 25 cycles of 45 s at 98 °C, 45 s at 60 °C, and 30 s at 72 °C, and a final extension at 72 °C for 5 min.
The PCR reaction mixture for archaeal DNA amplification was similarly prepared but contained 1 μL of 25 mM MgCl2 and 50 ng of isolated DNA. PCR protocol for archaeal DNA amplification was: initial denaturation for 1 min at 98 °C, 10 cycles of 45 s at 98 °C, 45 s at 63 °C, and 30 s at 72 °C, 15 cycles of 45 s at 98 °C, 45 s at 53 °C, and 30 s at 72 °C, and a final extension at 72 °C for 5 min. PCR products were purified using the GeneRead Size Selection Kit (QIAGEN GmbH, Hilden, Germany).
Bioinformatic Processing of Amplicons
300 Paired-end (300PE) sequencing of the amplicons was performed in the Göttingen Genomics Laboratory (Göttingen, Germany). Paired-end sequences were merged, and sequences containing unresolved bases and reads shorter than 305 base pairs (bp) were removed using PANDAseq v2.11 [3], employing the PEAR algorithm v0.9.8 [4]. Non-clipped forward and reverse primer sequences were removed by employing cutadapt v1.15 [5]. QIIME 1.9.1 was used to process the amplicon sequences [6]. The sequences were dereplicated and checked for chimeric sequences (de novo). Sequences were clustered at 97% sequence identity to operational taxonomic units (OTUs). The taxonomic classification of the OTU sequences was performed against the SILVA database 132 employing the assignment method implemented in Mothur [7]. Extrinsic domain OTUs, chloroplasts, and unclassified OTUs were removed from the dataset. Sample comparisons were performed at the same surveying effort, utilizing the lowest number of sequences by random subsampling (30,563 reads for bacteria, 4080 reads for archaea). Beta-diversity was calculated using Unifrac statistics [8] to determine the distances between samples. Principal coordinates analysis (PCoA) plots representing the data was visualized using EMPeror tool [9]. R programming was used to construct heatmaps representing the relative abundances of bacterial and archaeal communities in each sample. The paired-end reads of the 16S rRNA gene sequencing were deposited in the National Center for Biotechnology Information (NCBI) in the Sequence Read Archive SRR8944123 with the accession number PRJNA533037.
Samples and in Situ Variables’ Measurement
Siboglinid specimens were recovered from different mud volcanoes at sites where reduced sediment was observed. Exact location of the samples, as well as data collected from the ROVs’ sensors (CH4 and CTD) and are shown in Table 1. El Cid MV and Bonjardim MV specimens were sampled from grey mounds (Figure 1B,C). The El Cid MV siboglinid-sample was collected from the first 5 cm of a sediment push-core, while the Bonjardim MV sample, which was found in a mud breccia with a strong hydrogen sulfide smell, was collected using a suction sampler. Siboglinid specimens recovered from the Al Gacel MV were located in a pockmark, beneath an AOM-derived carbonate and facing an active bubbling seepage (Figure 1D) [10]. Furthermore, Anastasya MV specimens were obtained from a field of Beggiatoa-like biofilms (Figure 1E). All specimens were about 100 µm width and not more than 15 cm in length. Their tubes had a light-brownish color. No intensive morphological identification could be made; however, based on their size and external appearance they are likely Siboglinum sp. or Sclerolinum sp. specimens.
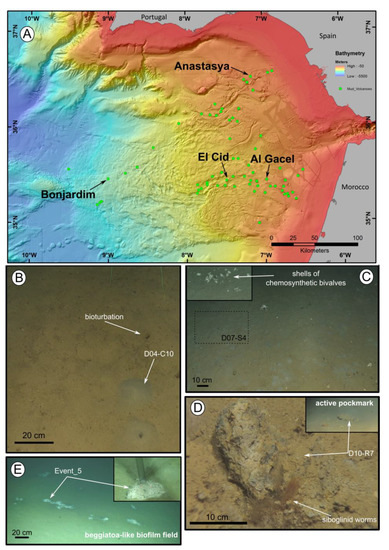
Figure 1. Location of the mud volcanoes sampled for this study in the Gulf of Cádiz and an overview of the sites where samples were recovered. (A) General view of the Gulf of Cádiz. Arrows point to mud volcanoes from where the samples were taken. (B–E) ROV still frames from the different sampling sites. (B) El Cid MV. (C) Bonjardim MV. (D) Al Gacel MV. (E) Anastasya MV. Coordinates in Table 1.
Imaging of endosymbionts
During transmission and scanning electron microscopy, worm tissues were only observed in the Al Gacel MV (see supplementary data Figure S1) and Anastasya MV samples (Figure 2). The other samples consisted of empty tubes. SEM micrographs from one specimen of Anastasya MV revealed the posterior region of the worm (Figure 2A) with a segmented opisthosoma and the trophosome (Figure 2B). A hole in the trophosome exposed abundant bacteria inside (Figure 2C,D). These bacteria were cocci of ca. 0.5 µm in diameter (Figure 2D).
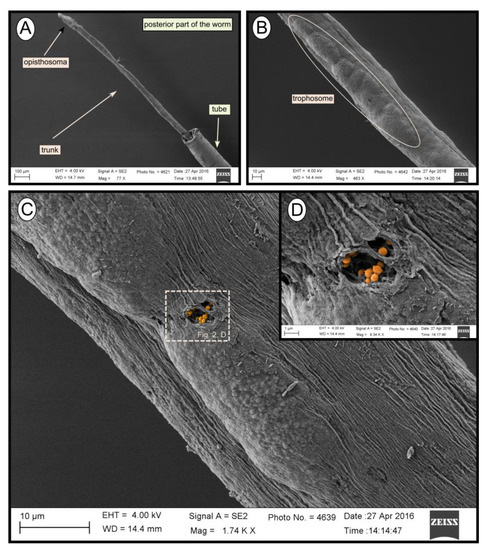
Figure 2. SEM micrographs of one specimen from Anastasya MV. (A) General view of the sample. Posterior part of the worm and the tube are visible. (B) Trophosome. (C,D) Closer view to a hole in the trophosome with endosymbiotic bacteria exposed (colored).
Structure and Composition of the Tubes
The fluorescent stain calcofluor white is an indicator for polysaccharides such as chitin, which is part of the organic matrix of siboglinids’ tubes. Sections of empty tubes from the Al Gacel MV expressed high fluorescence when observed under UV-light with a 09 Zeiss filter, with excitation wavelength ranges between 450 and 490 nm (Figure 3). Furthermore, an external microbial layer de-attached from the tube (most likely due to handling of the sample) was slightly fluorescent (Figure 3B).
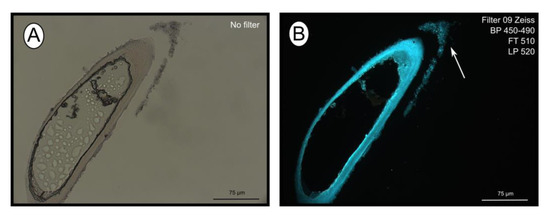
Figure 3. Calcofluor white staining of empty tubes recovered from Al Gacel MV. The fluorescence of the tube indicates the presence of chitin. Same section under normal light (A) and using Filter 09 with an excitation range between 450 and 490 nm (B). Notice the fluorescence of the tube and of the detached microbial layer (marked with an arrow).
SEM micrographs revealed transversal-segmented tubes, which were covered by minerals (from El Cid MV, Figure 4A), a thick biofilm (from Al Gacel MV, Figure 4B) or putative remains of microbial extracellular polymeric substances or EPS (from Anastasya MV, Figure 4C). Disrupted tubes revealed their composition of multiple concentric layers between 6 and 10 µm in thickness (Figure 4D). Some of the layers displayed a filamentous matrix, with attached globular particles of ca. 200 nm in diameter (Figure 4E). Layers consisting of these particles show a significant silica signal in EDX analysis (see supplementary data Figure S2). Other layers contained significant amounts of iron, sulfur and calcium, without notable differentiation between them. Detailed interpretation of EDX-analysis is discussed in supplementary data. Furthermore, microbial cells were observed in the internal surface of the tube from Al Gacel MV (Figures 4D and 5G,H). A model of the different layers observed in a tube is shown in Figure 4F.
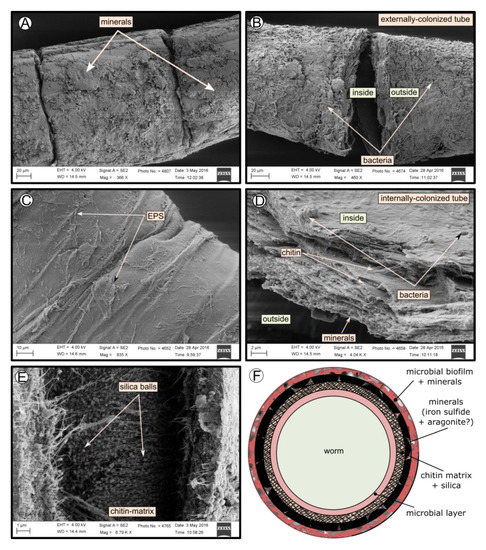
Figure 4. SEM micrographs of the tube of different specimens from different mud volcanoes and the expected arrangement of their layers. (A) El Cid MV specimen, with minerals on its external surface. (B) Al Gacel MV specimen, with a thick biofilm on its external surface. Microbial colonizers are detailed in Figure 5. (C) Anastasya MV specimen with remains of EPS on its external surface. (D) Al Gacel MV specimen with bacteria on its internal surface. A multilayer organization of the tube can be observed, chitin layers and minerals can be differentiated. (E) Internal layer of chitin with rounded silica from El Cid MV specimen. (F) Model of what is expected to be the arranging of the tube.
Microbial Biofilm of the Tubes
TEM and SEM micrographs from the Al Gacel MV revealed a high microbial colonization of the outside surface of the tube (Figures 4B and 5). The biofilm was up to 10 and 20 µm thick (Figure 5A). Bacteria with intracytoplasmic membranes arranged as known for methanotrophic proteobacteria were the most abundant along the tube, forming densely packed cell-aggregations (Figure 5A–C). Other microbial morphotypes were observed, i.e., prosthecate, rod shaped, helically shaped, and filamentous microorganisms (Figure 5D–F). Rod-shaped microorganisms were also observed attached to the inside surface of the tube (Figure 5G,H) Furthermore, some microorganisms appeared to be actively penetrating the chitin tube (Figure 5I). Similarly, siboglinids’ tubes from Anastasya MV under the TEM revealed a biofilm on the external tube face. However, the biofilm appeared to be in a degradation process, because cells appeared as “ghosts” (only cell walls, no cytosolic contents were visible; Figure 6). Remains of EPS forming similar cell-aggregations to the ones observed in Al Gacel MV tube indicate abundance of methanotrophic bacteria (Figure 6A). Embedded remains of microorganisms inside the tube were also observed (Figure 6B).
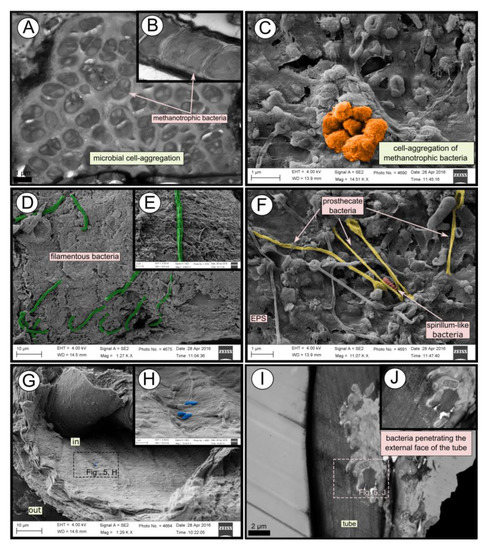
Figure 5. SEM and TEM micrographs of colonized tubes from Al Gacel MV. (A–C) Methanotrophic bacteria organized in cell-aggregations and expressing intracytoplasmatic membranes. (D–F) Different microbial morphotypes observed in the biofilm. (G,H) Rod-shaped microorganisms colonizing the internal surface of the tube. (I,J) Microbial biofilm penetrating the tube.
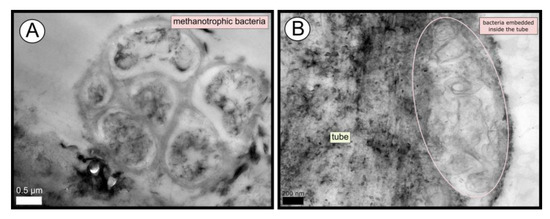
Figure 6. TEM micrographs of remains of a microbial biofilm from tubes of Anastasya MV worms. (A) Remains of methanotrophic bacteria are commonly observed. (B) Many microorganisms appear to be embedded inside the tube.
Prokaryotic Community Composition
Bacterial and archaeal 16S rRNA gene libraries revealed relative abundances of taxa typically found thriving in the water column, such as Acidobacteria, Actinobacteria, Bateriodetes, Chloroflexi, Thermoplasmata, Woesearchaeota, and Candidatus Nitrosopumilus (Figure 7) [11][12].
Sulfide-oxidizing bacteria are detected in all samples, with a high representation in the El Cid MV sample, being mostly Thiohalophilus and bacteria from the Thiotrichaceae family (Figure 7A). Sedimenticola endosymbionts, which are also sulfide-oxidizing bacteria, are abundant in Al Gacel MV specimens, as well as Desulfobacterales sulfate-reducers. In fact, sulfate reducers are highly abundant (>15%) in Al Gacel MV and Anastasya MV samples, while in El Cid MV and Bonjardim MV they represent 3% of the total relative abundance (Figure 7A). In Anastasya MV sample, Marine Methylotrophic group 2 (MMG-2) methanotrophic bacteria, and Desulfobacter sulfate-reducing bacteria are highly abundant (Figure 7A). Additionally, Methylotenera methylotrophic bacteria taxa are also representative in Al Gacel MV (7%). In Al Gacel MV and Anastasya MV up to 50 % of the bacteria are represented by methane-oxidizing, sulfide-oxidizing and sulfate-reducing bacteria (Figure 7C). Likewise, Chitinivibrionia (known chitin degraders) were detected in all our samples, especially in Anastasya MV (Figure 7A).
The archaeal community profile was dominated by Woeserarchaeota (or DHVEG-6, Nanoarchaeota), followed by methane-oxidizing archaea (ANME-1 and ANME-2) as the second most abundant taxa, except in Anastasya MV where methanogens are slightly more abundant (Figure 7B,D). Additionally, methanogenic archaea were homogeneous among the samples, except in the Al Gacel MV where they were almost absent (Figure 7B).
Beta-diversity among the samples showed substantial differences in the microbial communities (Figure 7C-D). The first and the second principal coordinates (PCoA1 and PCoA 2, respectively) revealed short distances between El Cid MV and Bonjardim MV bacterial communities (Figure 7C), and between El Cid MV and Anastasya MV archaeal communities (Figure 7D).
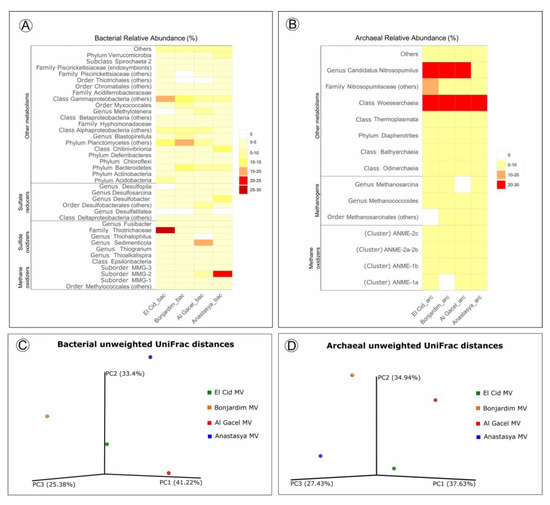
Figure 7. (A,B) Heatmap representing bacterial and archaeal relative abundances in each sample. (C,D) Beta-diversity measured with unweighted UniFrac metrics. PCoA plots are with data rarefied to the lowest number of sequences. PC1, PC2, and PC3, first, second, and third principal coordinate axes, respectively.
This entry is adapted from the peer-reviewed paper 10.3390/microorganisms8030367
References
- Anna Klindworth; Elmar Pruesse; Timmy Schweer; Jörg Peplies; Christian Quast; Matthias Horn; Frank Oliver Glöckner; Evaluation of general 16S ribosomal RNA gene PCR primers for classical and next-generation sequencing-based diversity studies.. Nucleic Acids Research 2013, 41, e1, 10.1093/nar/gks808.
- Franziska Wemheuer; Avril Jean Elisabeth Von Hoyningen-Huene; Marion Pohlner; Julius Degenhardt; Bert Engelen; Rolf Daniel; Bernd Wemheuer; Primary Production in the Water Column as Major Structuring Element of the Biogeographical Distribution and Function of Archaea in Deep-Sea Sediments of the Central Pacific Ocean.. Archaea 2019, 2019, 3717239, 10.1155/2019/3717239.
- Andre P Masella; Andrea K Bartram; Jakub M Truszkowski; Dan Brown; Josh D. Neufeld; PANDAseq: paired-end assembler for illumina sequences. BMC Bioinformatics 2012, 13, 31-31, 10.1186/1471-2105-13-31.
- Jiajie Zhang; Kassian Kobert; T. Flouri; Alexandros Stamatakis; PEAR: a fast and accurate Illumina Paired-End reAd mergeR.. Bioinformatics 2013, 30, 614-20, 10.1093/bioinformatics/btt593.
- Marcel Martin; Cutadapt removes adapter sequences from high-throughput sequencing reads. EMBnet.journal 2011, 17, 10, 10.14806/ej.17.1.200.
- J Gregory Caporaso; Justin Kuczynski; Jesse Stombaugh; Kyle Bittinger; Frederic D. Bushman; Elizabeth K Costello; Noah Fierer; Antonio Gonzalez Peña; Julia K Goodrich; Jeffrey I Gordon; et al. QIIME allows analysis of high-throughput community sequencing data. Nature Chemical Biology 2010, 7, 335-6, 10.1038/nmeth.f.303.
- Yilmaz, P.; Parfrey, L.W.; Yarza, P.; Gerken, J.; Pruesse, E.; Quast, C.; Schweer, T.; Peplies, J.; Ludwig, W.; Glockner, F.O. The SILVA and “All-species Living Tree Project (LTP)” taxonomic frameworks. Nucleic Acid Res. 2014, 42, 643–648.
- Catherine Lozupone; Manuel E Lladser; Dan Knights; Jesse Stombaugh; Rob Knight; UniFrac: an effective distance metric for microbial community comparison. The ISME Journal 2010, 5, 169-172, 10.1038/ismej.2010.133.
- Yoshiki Vázquez-Baeza; Meg Pirrung; Antonio Gonzalez; Rob Knight; EMPeror: a tool for visualizing high-throughput microbial community data. GigaScience 2013, 2, none, 10.1186/2047-217X-2-16.
- Rincón-Tomás, B.; Duda, J.-P.; Somoza, L.; González, F.J.; Schneider, D.; Medialdea, T.; Madureira, P.; Hoppert, M.; Reitner, J. Cold-water corals and hydrocarbon-rich seepage in the Pompeia Province (Gulf of Cádiz) — living on the edge. Biogeosciences 2019, 16, 1607–1627.
- Emily A Walsh; John Kirkpatrick; Scott D Rutherford; David C. Smith; Mitchell Sogin; Steven D'hondt; Bacterial diversity and community composition from seasurface to subseafloor.. The ISME Journal 2016, 10, 979-989, 10.1038/ismej.2015.175.
- Bergauer, K.; Fernandez-Guerra, A.; Garcia, J.A.L.; Sprenger, R.R.; Stepanauskas, R.; Pachiadaki, M.G.; Jensen, O.N.; Herndl, G.J.; Organic matter processing by microbial communities. Proc. Natl. Acad. Sci. USA 2018, 115, E400–E408, 10.1080/1065657x.2002.10702094.
