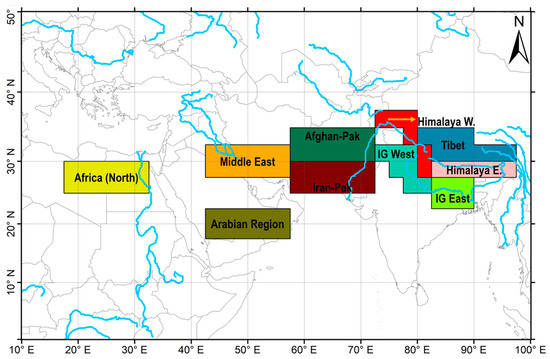
The Hindu Kush-Himalayan region (HKH), situated at high altitudes (~5 km above sea level), and the adjoining Indo-Gangetic plains (IG plains, ~0–250 m above sea level) are notably responsive to climatic shifts due to their geographic location and intricate topography. Ongoing research reveals that climate change's consequences and linked alterations in water resources—comprising glacial/snow meltwater and rainfall—hold diverse impacts on ecosystems, agriculture, industries, and inhabitants within this area.
This investigation delved into a 45-year span of data (1978–2022) derived from Microwave Sounding Unit/Advanced Microwave Sounding Unit (MSU/AMSU) instruments provided by Remote Sensing Systems (RSS Version 4.0). The goal was to scrutinize changes in mid-tropospheric temperature (TMT, 3–7 km altitude) and lower tropospheric temperature (TLT, 0–3 km altitude) concerning annual/monthly trends and anomalies.
Results indicate a noteworthy rise in mid-tropospheric temperatures (0–3 km altitude) across the HKH region, with increases of 1.49 °K in Tibet, 1.30 °K in the western Himalayas, and 1.35 °K in the eastern Himalayas over the 45-year timeframe. By contrast with an earlier 30-year period study (1979–2008), the present study observed a substantial percentage change of TMT trends for the high-altitude areas, including Tibet, the western Himalayas, and the eastern Himalayas—approximately 310%, 80%, and 170%, respectively. Conversely, the neighboring plains (western and eastern IG plains) exhibited negligible or considerably lower percent alterations (0% and 40%, respectively) over the past 14 years.
- tropospheric temperature
- Himalayas
- MSU/AMSU
- HKH
1. Introduction
2. Atmospheric Temperature Trend (MSU/AMSU)
| Ref. | Region | Time Period | Data | Trend (°K decade−1) |
|---|---|---|---|---|
| [30] | Yangtze River reaches, China | 1979–2018 | MSU (TLT) | 0.20 |
| [30] | Yangtze River reaches, China | 1979–2018 | MSU (TMT) | 0.19 |
| [13] | Western IG Plain (Annual) | 1979–2008 | MSU (TMT) | 0.18 ± 0.05 |
| [31] | Western Himalayas (Annual) | 1979–2007 | MSU (TMT) | 0.26 ± 0.09 |
| [13] | Western Himalayas (Annual) | 1979–2008 | MSU (TMT) | 0.16 ± 0.05 |
| [30] | Tibetan Plateau, China | 1979–2018 | MSU (TLT) | 0.40 |
| [30] | Tibetan Plateau, China | 1979–2018 | MSU (TMT) | 0.32 |
| [32] | Tibetan Plateau (Qinghai), China | 1998–2020 | AMSU | Enhanced tropospheric warming |
| [13] | Tibetan Plateau | 1979–2008 | MSU (TMT) | 0.08 ± 0.06 |
| [13] | IG plains (Annual) | 1979–2008 | MSU (TLT) | 0.32 ± 0.27 |
| [31] | Himalayan-Hindu Kush (Annual) | 1979–2007 | MSU (TMT) | 0.21 ± 0.08 |
| [13] | Eastern IG Plain (Annual) | 1979–2008 | MSU (TMT) | 0.13 ± 0.04 |
| [31] | Eastern Himalayas (Annual) | 1979–2007 | MSU (TMT) | 0.182 ± 0.08 |
3. Climate Change Indicators: Glaciers
| Ref. | Glacier/Region | Location | Period | Retreat Pattern |
|---|---|---|---|---|
| [45] | Qomolangma (Mount Everest) | Central Himalayas | 1960–2006 | 5.5 to 9.5 ma−1 |
| [46] | Tuanjiefeng Peak, Qilian Mountains | China | 1966–2010 | 9.9 ± 3.9% deglaciation |
| [47] | Yehelong Glacier | China | 1966–2000 | 23.2% deglaciation |
| [48] | Geladandong area | China | 1969–2000 | 1.70% deglaciation |
| [49] | Ak-shirak Range, central Tien Shan plateau | China | 1977–2001 | 20% deglaciation |
| [9] | 885 glaciers of Bhutan Himalaya | E. Himalaya | 1977–2010 | 23.3 ± 0.9% glacial area loss (~1980 and 2010) |
| [50] | Zemu Glacier, Sikkim | E. Himalaya | 1977–1984 | 27.7 ma−1 |
| [51] | Siachen | E. Karakoram region (N. Ladakh) | 1929–1958 | Higher during the 20th century than 1862–1909 |
| [52] | Imja Glacier | Nepal Himalayas | 2001–2006 | 370 m retreat |
| [53] | 57 glaciers of Ghunsa Khola | Nepal Himalayas | 1958–1992 | 50% retreat, 38% stationary, and 12% advancing |
| [54] | Langtang sub-basin | Nepal Himalayas | 1977–2009 | 26% deglaciation |
| [55] | Manaslu | Nepal Himalayas | 1970–2019 | 0.26 ± 0.0001% a−1 |
| [56] | Baturat Glacier | Northwest Karakoram, Pakistan | 1992–2000 | 17 km2 deglaciation |
| [57] | Bada Shigri, Himachal Pradesh | NW. Himalayas | 1890–1906 | 20.0 ma−1 |
| [50] | Bada Shigri, Himachal Pradesh | NW. Himalayas | 1977–1995 | 36.1 ma−1 |
| [50] | Chota Shigri, Himachal Pradesh | NW. Himalayas | 1986–1995 | 6.70 ma−1 |
| [57] | Kolhani, Jammu and Kashmir | NW. Himalayas | 1857–1909 | 15.0 ma−1 |
| [57] | Kolhani, Jammu and Kashmir | NW. Himalayas | 1912–1961 | 16.0 ma−1 |
| [6] | Pir Panjal (12,243 glaciers), Greater Himalaya, Shamaswari, Zanaskar, Ladakh, Karakoram | NW. Himalayas | 2000–2012 | 0.35 ± 0.33 ma−1 |
| [58] | Glaciers in China | Qinghai-Tibetan Plateau | 1960–2008 | 26.7% deglaciation |
| [59] | Naimonanyi, Himalayas | Tibet | 1950–2004 | No net accum. of ice mass |
| [60] | Su-lo Mountain | Tibetan Plateau, China | 1966–1999 | Area loss of 34.7 km2 |
| [61] | Kunlun shan (278 glaciers) | Tibetan Plateau, China | 1970–2001 | 0.40% deglaciation |
| [62] | Malan, Hoh Xil | Tibetan Plateau, China | 1970–2000 | 1.0 to 1.7 ma−1 |
| [63] | Gangdisê Mountains | Trans Himalaya, China | 1970–2016 | 1.09% a−1 |
| [4] | Ladakh (864 glaciers) | W. Himalayas | 1991–2014 | 12.8% deglaciation |
| [64] | Himachal Glacier region | W. Himalayas | 1999–2004 | Increased rate of glacial ice loss compared to 1977–1999 |
| [65] | Chenab, Parbati, and Baspa basins (466 glaciers) | W. Himalayas | 1962–2007 | 21.0% deglaciation |
| [66] | Milam, Uttaranchal | W. Himalayas | 1849–1957 | 12.5 ma−1 |
| [66] | Pindari, Uttarakhand | W. Himalayas | 1845–1966 | 23.0 ma−1 |
| [66] | Gangotri, Uttarakhand | W. Himalayas | 1935–1976 | 15.0 ma−1 |
| [67] | Gangotri, Uttarakhand | W. Himalayas | 1965–2006 | 0.01 km2a−1 |
4. Importance of MSU/AMSU Datasets
5. Discussion
The mid-troposphere temperature (TMT, 3–7 km altitude) trend can be practically considered the lower troposphere temperature (TLT, 0–3 km altitude) trend over the high-altitude HKH region, where the average elevation is ~5 km. The TMT trend over the dust source, dust sink, and surrounding snow-covered and glacial regions (Himalayas and Tibetan Plateau) shows a statistically significant mean warming trend. The observed warming trends align with the overall warming of the tropical troposphere observed globally during the same period [70][73]. The HKH region is reported to show a warming of almost 1.8 °K by the end of the century[74].
The high-altitude glacial regions exhibit enhanced warming compared to other low-lying regions (Figure 2). The Tibetan region shows the highest warming trend, followed by the eastern Himalayas and the western Himalayas, respectively.
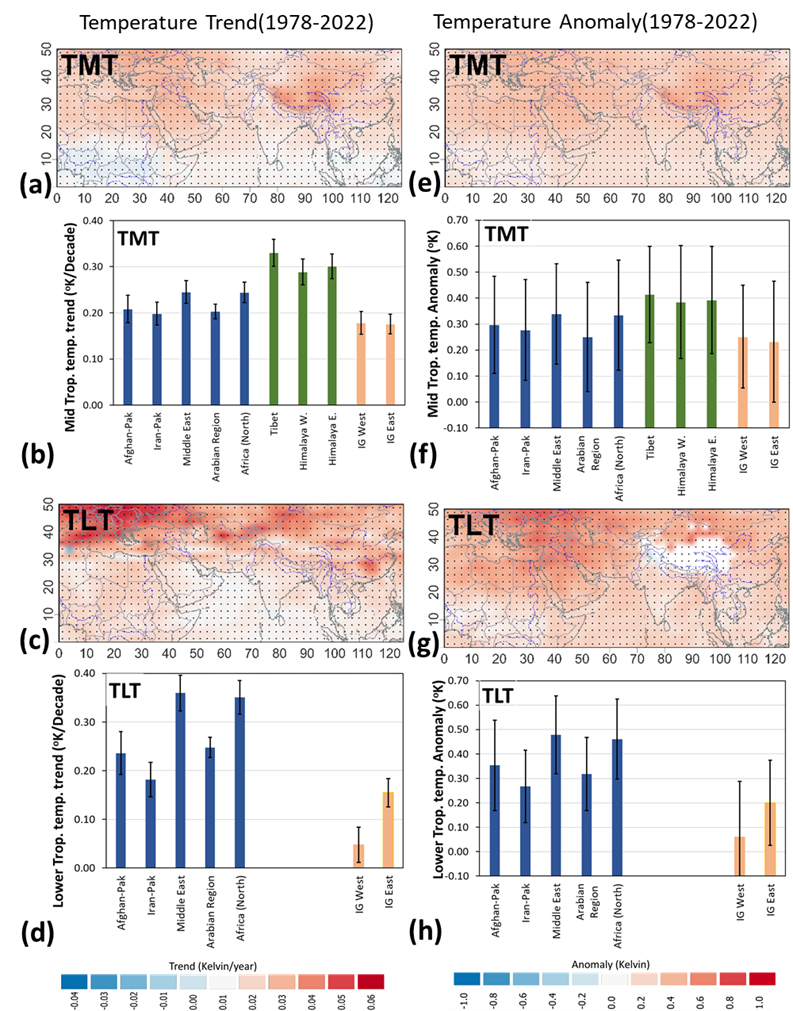
Figure 2. The overall mid-troposphere and lower troposphere temperature (TMT/TLT) trend map (°K/year) (a, and c), anomaly map (°K) (e, and g), and its corresponding trend/decade (°K/decade) and anomaly (in °K) chart (b, f, and d, h) over high-altitude Tibet, Himalayas (western and eastern), adjacent Indo-Gangetic (IG) plains (western and eastern), and dust source regions (as marked in Figure 1). The dots on the trend maps indicate that the linear trend over the region (pixel or grid) is statistically significant.
The monthly breakup of warming trends exhibits that the high-altitude glacial regions clearly show enhanced warming during winter and pre-monsoon months (November to May) and a decline during the other half of the year with a relatively neutral or slightly positive trend.
In general, an inequality of warming trend can be observed between the western and eastern Himalayas, where the western Himalayas show a relatively higher warming trend in pre-monsoon months (peak in May, 0.019 ± 0.005 °K/year) compared to other months, while the eastern Himalayas show much higher warming trends in winter months (peak in December through February, average of 0.041 ± 0.012 °K/year) compared to pre-monsoon months.
Previous studies had reported the unequal distribution of TMT warming with enhanced warming of the western sides of the Himalayas and IG plains compared to the eastern sides in the pre-monsoon months [13][31]. Significant dust storms originating from arid and desert areas in Africa, Arabia, and western India, including the Thar Desert, occur during the pre-monsoon season (April–June) in the Indian Gangetic (IG) plains [72][75]. These dust storms, along with locally produced anthropogenic pollutants, affect the entire IG plains during the pre-monsoon. The frequency and impact of these dust storms are higher in the western region and relatively lower in the eastern part of the IG plains. These dust-laden air masses form a layer of aerosols along the foothills of the Indian Himalayas, contributing to the “elevated heat pump” (EHP) mechanism [16][75]. This mechanism enhances convection, causing the vertical advection of dust aerosols to higher altitudes, increasing the seasonal heating during pre-monsoon (MAM) months, and resulting in a decreasing gradient of aerosol optical depth (AOD) towards the east [76][77]. Though the seasonal anomalous heating of the western Himalayas and IG west during MAM months was distinctly identified by the study, the disappearance of the decreasing TMT gradient from west to east and the strong jump in TMT trends in the eastern Himalayas and IG plains are conspicuous.
The annual TMT trends derived in the present study[29] for the IG west and IG east exhibit similar degrees of warming trends, in contrast to the earlier works on the TMT trends derived for the IG plains. The annual TMT trends of the Himalayas also show a similar pattern, with not much contrast between the western and eastern Himalayas. Previous studies had identified unequal annual TMT warming trends between the western (western Himalayas, IG west) and eastern (eastern Himalayas, IG east) sides of dust sink and snow-glacier cover regions from MSU-derived TMT trends for the time period 1979–2008, with the western Himalayas and IG west showing a much higher annual TMT trend than the eastern Himalayas and IG east [13]. The present study[29] clearly reveals that the warming of the middle troposphere in the eastern dust sink and snow-glacier cover regions has alarmingly increased over the past decade.
The changes in western disturbances over the western Himalayas suggest that significant warming of the Tibetan region in recent decades will result in stronger temperature differences between the middle and upper troposphere over the sub-tropics and mid-latitudes, causing the mean westerly winds to become more unstable, leading to greater variability in the occurrence of weather disturbances and an increased likelihood of heavy precipitation events over the western Himalayas[25]. The enhanced warming of the Tibetan region over the past decade, as observed in the present study[29], could explain the increased winter precipitation and the anomalous advancement of glaciers in the western Himalayas.
6. Conclusions
The highlights of the study[29] are:
- The study emphasized the acceleration of mid-troposphere warming trends in the HKH region compared to neighboring IG plains.
- A comparison of TMT trends between 1979–2008 and 1978–2022 revealed significant rises in warming over the last 14 years:
- Tibet: ~3.1 times
- Eastern Himalayas: ~1.7 times
- Western Himalayas: ~0.8 times
- IG west: Nearly zero rise
- IG east: ~0.4 times
- Dust source regions: ~1.3 times
- Overall, the findings suggest an increase in regional mid-troposphere temperature trends across the HKH region, IG plains, and western dust source regions over the 45-year period.
- Warming trends in TMT showed a distinct increase in high-altitude snow-glacier-covered regions (Tibet, western Himalayas, and eastern Himalayas) compared to adjacent plains (IG west, IG east).
- Seasonal variations were observed in TMT warming trends, with a strong increase during pre-monsoon months in the western Himalayas and IG plains, attributed to heightened dust storm activity.
- The divergence in snow and glacier melting rates between the western and eastern Himalayas, as well as Tibet, was attributed to distinct regional tropospheric warming patterns.
- The research emphasized that higher TMT warming anomalies and trends during November–April (NDJFMA months) led to increased glacier and snow cover melting during the primary snow accumulation season from November to February (NDJF months) in the Indian subcontinent.
This entry is adapted from the peer-reviewed paper 10.3390/app13169088
References
- Dyhrenfurth, G.O. To the Third Pole: The History of the High Himalaya; Laurie, W., Ed.; Werner Laurie: London, UK, 1955.
- Xu, J.; Grumbine, R.E.; Shrestha, A.; Eriksson, M.; Yang, X.; Wang, Y.; Wilkes, A. The Melting Himalayas: Cascading Effects of Climate Change on Water, Biodiversity, and Livelihoods. Conserv. Biol. 2009, 23, 520–530.
- Bajracharya, S.R.; Maharjan, S.B.; Shrestha, F.; Guo, W.; Liu, S.; Immerzeel, W.; Shrestha, B. The Glaciers of the Hindu Kush Himalayas: Current Status and Observed Changes from the 1980s to 2010. Int. J. Water Resour. Dev. 2015, 31, 161–173.
- Chudley, T.R.; Miles, E.S.; Willis, I.C. Glacier Characteristics and Retreat between 1991 and 2014 in the Ladakh Range, Jammu and Kashmir. Remote Sens. Lett. 2017, 8, 518–527.
- Kumar, D.; Singh, A.K.; Taloor, A.K.; Singh, D.S. Recessional Pattern of Thelu and Swetvarn Glaciers between 1968 and 2019, Bhagirathi Basin, Garhwal Himalaya, India. Quat. Int. 2021, 575, 227–235.
- Abdullah, T.; Romshoo, S.A.; Rashid, I. The Satellite Observed Glacier Mass Changes over the Upper Indus Basin during 2000–2012. Sci. Rep. 2020, 10, 14285.
- Romshoo, S.A.; Murtaza, K.O.; Shah, W.; Ramzan, T.; Ameen, U.; Bhat, M.H. Anthropogenic Climate Change Drives Melting of Glaciers in the Himalaya. Environ. Sci. Pollut. Res. 2022, 29, 52732–52751.
- Romshoo, S.A.; Abdullah, T.; Rashid, I.; Bahuguna, I.M. Explaining the Differential Response of Glaciers across Different Mountain Ranges in the North-Western Himalaya, India. Cold Reg. Sci. Technol. 2022, 196, 103515.
- Bajracharya, S.R.; Maharjan, S.B.; Shrestha, F. The Status and Decadal Change of Glaciers in Bhutan from the 1980s to 2010 Based on Satellite Data. Ann. Glaciol. 2014, 55, 159–166.
- Sahu, R.; Gupta, R. Glacier Mapping and Change Analysis in Chandra Basin, Western Himalaya, India during 1971–2016. Int. J. Remote Sens. 2020, 41, 6914–6945.
- Pandey, P.; Venkataraman, G. Changes in the Glaciers of Chandra–Bhaga Basin, Himachal Himalaya, India, between 1980 and 2010 Measured Using Remote Sensing. Int. J. Remote Sens. 2013, 34, 5584–5597.
- Solomon, S.; Qin, D.; Manning, M.; Marquis, M.; Averyt, K.; Melinda, M.B.; Tignor; Miller, H.L., Jr.; Chen, Z. Climate Change 2007—The Physical Science Basis; Contribution of Working Group I to the Fourth Assessment Report of the Intergovernmental Panel on Climate Change; Cambridge University Press: New York, NY, USA, 2007; pp. 235–336.
- Prasad, A.K.; Yang, K.-H.S.; El-Askary, H.M.; Kafatos, M. Melting of Major Glaciers in the Western Himalayas: Evidence of Climatic Changes from Long Term MSU Derived Tropospheric Temperature Trend (1979–2008). Ann. Geophys. 2009, 27, 4505–4519.
- He, Y. Changing Features of the Climate and Glaciers in China’s Monsoonal Temperate Glacier Region. J. Geophys. Res. 2003, 108, 4530.
- Lau, K.M.; Kim, M.K.; Kim, K.M. Asian Summer Monsoon Anomalies Induced by Aerosol Direct Forcing: The Role of the Tibetan Plateau. Clim. Dyn. 2006, 26, 855–864.
- Lau, K.-M.; Kim, K.-M. Observational Relationships between Aerosol and Asian Monsoon Rainfall, and Circulation. Geophys. Res. Lett. 2006, 33, L21810.
- Mears, C.A.; Wentz, F.J.; Thorne, P.W. Assessing the Value of Microwave Sounding Unit-Radiosonde Comparisons in Ascertaining Errors in Climate Data Records of Tropospheric Temperatures: Satellite-Radiosonde Comparisons. J. Geophys. Res. Atmos. 2012, 117.
- Diao, M.; Jumbam, L.; Sheffield, J.; Wood, E.F.; Zondlo, M.A. Validation of AIRS/AMSU-A Water Vapor and Temperature Data with in Situ Aircraft Observations from the Surface to UT/LS from 87°N-67°S: GLOBAL AIRS/AMSU-A H 2 O AND T VALATIONS. J. Geophys. Res. Atmos. 2013, 118, 6816–6836.
- Bernath, P.F. The Atmospheric Chemistry Experiment (ACE). J. Quant. Spectrosc. Radiat. Transf. 2017, 186, 3–16.
- Nash, J.; Saunders, R. A Review of Stratospheric Sounding Unit Radiance Observations for Climate Trends and Reanalyses. Q. J. R. Meteorol. Soc. 2015, 141, 2103–2113.
- Sofieva, V.F.; Dalaudier, F.; Hauchecorne, A.; Kan, V. High-Resolution Temperature Profiles Retrieved from Bichromatic Stellar Scintillation Measurements by GOMOS/Envisat. Atmos. Meas. Tech. 2019, 12, 585–598.
- Christy, J.R.; Norris, W.B.; Spencer, R.W.; Hnilo, J.J. Tropospheric Temperature Change since 1979 from Tropical Radiosonde and Satellite Measurements. J. Geophys. Res. 2007, 112, D06102.
- Mears, C.A.; Schabel, M.C.; Wentz, F.J. A Reanalysis of the MSU Channel 2 Tropospheric Temperature Record. J. Clim. 2003, 16, 3650–3664.
- Ramanathan, V.; Ramana, M.V.; Roberts, G.; Kim, D.; Corrigan, C.; Chung, C.; Winker, D. Warming Trends in Asia Amplified by Brown Cloud Solar Absorption. Nature 2007, 448, 575–578.
- Madhura, R.K.; Krishnan, R.; Revadekar, J.V.; Mujumdar, M.; Goswami, B.N. Changes in Western Disturbances over the Western Himalayas in a Warming Environment. Clim. Dyn. 2015, 44, 1157–1168.
- Mallik, C.; Lal, S. Changing Long-Term Trends in Tropospheric Temperature over Two Megacities in the Indo-Gangetic Plain. Curr. Sci. 2011, 101, 637–644.
- Kothawale, D.R.; Singh, H.N. Recent Trends in Tropospheric Temperature over India during the Period 1971–2015: Indian Tropospheric Temperature Trend. Earth Space Sci. 2017, 4, 240–246.
- Jindal, P.; Thapliyal, P.K.; Shukla, M.V.; Sharma, S.K.; Mitra, D. Trend Analysis of Atmospheric Temperature, Water Vapour, Ozone, Methane and Carbon-Monoxide over Few Major Cities of India Using Satellite Data. J. Earth Syst. Sci. 2020, 129, 60.
- Desinayak, N.; Prasad, A.K.; Vinod, A.; Mishra, S.; Shukla, A.; Nayak, S.; Rise in Mid-Tropospheric Temperature Trend (MSU/AMSU 1978–2022) over the Tibet and Eastern Himalayas.. Appl. Sci. 2023, 13, 9088, .
- Guo, Y.; Weng, F.; Wang, G.; Xu, W. The Long-Term Trend of Upper-Air Temperature in China Derived from Microwave Sounding Data and Its Comparison with Radiosonde Observations. J. Clim. 2020, 33, 7875–7895.
- Gautam, R.; Hsu, N.C.; Lau, K.-M. Premonsoon Aerosol Characterization and Radiative Effects over the Indo-Gangetic Plains: Implications for Regional Climate Warming. J. Geophys. Res. 2010, 115, D17208.
- Qin, Z.; Zou, X. Modulation Effect of the Annual Cycle on Interdecadal Warming Trends over the Tibetan Plateau during 1998–2020. J. Clim. 2023, 36, 2917–2931.
- Yao, T.; Pu, J.; Lu, A.; Wang, Y.; Yu, W. Recent Glacial Retreat and Its Impact on Hydrological Processes on the Tibetan Plateau, China, and Surrounding Regions. Arct. Antarct. Alp. Res. 2007, 39, 642–650.
- Schmidt, S.; Nüsser, M. Changes of High Altitude Glaciers in the Trans-Himalaya of Ladakh over the Past Five Decades (1969–2016). Geosciences 2017, 7, 27.
- Das, S.; Sharma, M.C.; Murari, M.K.; Nüsser, M.; Schmidt, S. Half-a-Century (1971–2020) of Glacier Shrinkage and Climatic Variability in the Bhaga Basin, Western Himalaya. J. Mt. Sci. 2023, 20, 299–324.
- Rashid, I.; Majeed, U.; Najar, N.; Bhat, I. Retreat of Machoi Glacier, Kashmir Himalaya between 1972 and 2019 Using Remote Sensing Methods and Field Observations. Sci. Total Environ. 2021, 785, 147376.
- Schmidt, S.; Nüsser, M. Changes of High Altitude Glaciers from 1969 to 2010 in the Trans-Himalayan Kang Yatze Massif, Ladakh, Northwest India. Arct. Antarct. Alp. Res. 2012, 44, 107–121.
- Zhao, W.; He, J.; Wu, Y.; Xiong, D.; Wen, F.; Li, A. An Analysis of Land Surface Temperature Trends in the Central Himalayan Region Based on MODIS Products. Remote Sens. 2019, 11, 900.
- Farinotti, D.; Immerzeel, W.W.; De Kok, R.J.; Quincey, D.J.; Dehecq, A. Manifestations and Mechanisms of the Karakoram Glacier Anomaly. Nat. Geosci. 2020, 13, 8–16.
- Hewitt, K. The Karakoram Anomaly? Glacier Expansion and the ‘Elevation Effect’, Karakoram Himalaya. Mt. Res. Dev. 2005, 25, 332–340.
- Scherler, D.; Strecker, M.R. Large Surface Velocity Fluctuations of Biafo Glacier, Central Karakoram, at High Spatial and Temporal Resolution from Optical Satellite Images. J. Glaciol. 2012, 58, 569–580.
- Muhammad, S.; Tian, L.; Nüsser, M. No Significant Mass Loss in the Glaciers of Astore Basin (North-Western Himalaya), between 1999 and 2016. J. Glaciol. 2019, 65, 270–278.
- Immerzeel, W.W.; Van Beek, L.P.H.; Bierkens, M.F.P. Climate Change Will Affect the Asian Water Towers. Science 2010, 328, 1382–1385.
- Desinayak, N.; Prasad, A.K.; El-Askary, H.; Kafatos, M.; Asrar, G.R. Snow Cover Variability and Trend over the Hindu Kush Himalayan Region Using MODIS and SRTM Data. Ann. Geophys. 2022, 40, 67–82.
- Ren, J.; Jing, Z.; Pu, J.; Qin, X. Glacier Variations and Climate Change in the Central Himalaya over the Past Few Decades. Ann. Glaciol. 2006, 43, 218–222.
- Xu, J.; Liu, S.; Zhang, S.; Guo, W.; Wang, J. Recent Changes in Glacial Area and Volume on Tuanjiefeng Peak Region of Qilian Mountains, China. PLoS ONE 2013, 8, e70574.
- Jianping, Y.; Yongjian, D.; Rensheng, C.; Shiyin, L.; Anxin, L. Causes of Glacier Change in the Source Regions of the Yangtze and Yellow Rivers on the Tibetan Plateau. J. Glaciol. 2003, 49, 539–546.
- Lu, A.; Yao, T.; Liu, S. Glacier Change in the Geladandong Area of the Tibetan Plateau Monitored by Remote Sensing. J. Glaciol. Geocryol. 2002, 24, 559–562.
- Khromova, T.E.; Dyurgerov, M.B.; Barry, R.G. Late-Twentieth Century Changes in Glacier Extent in the Ak-Shirak Range, Central Asia, Determined from Historical Data and ASTER Imagery: Changes in Glacier Extent in the Ak-Shirak Range. Geophys. Res. Lett. 2003, 30.
- Cruz, R.V.; Harasawa, H.; Lal, M.; Wu, S.; Anokhin, Y.; Punsalmaa, B.; Honda, Y.; Jafari, M.; Li, C.; Huu Ninh, N. Climate Change 2007: Impacts, Adaptation and Vulnerability; Contribution of Working Group II to the Fourth Assessment Report of the Intergovernmental Panel on Climate Change; Cambridge University Press: Cambridge, UK, 2007; pp. 469–506.
- Raina, V.K.; Sangewar, C. Siachen Glacier of Karakorum Mountains, Ladakh Its Secular Retreat. J. Geol. Soc. India 2007, 70, 11–16.
- Karma, T.; Ageta, Y.; Naito, N.; Iwata, S.; Yabuki, H. Glacier Distribution in the Himalayas and Glacier Shrinkage from 1963 to 1993 in the Bhutan Himalayas. Bull. Glaciol. Res. 2003, 20, 29–40.
- Asahi, K.; Wataoabe, T. Past and Recent Glacier Fluctuations in Kanchenjunga Himal, Nepal. J. Nepal Geol. Soc. 2000, 22, 481–490.
- Bajracharya, S.R.; Maharjan, S.B.; Shresth, F. Glaciers Shrinking in Nepal Himalaya. In Climate Change—Geophysical Foundations and Ecological Effects; Blanco, J.A., Ed.; InTech: London, UK, 2011; ISBN 978-953-307-419-1.
- Racoviteanu, A.E.; Glasser, N.F.; Robson, B.A.; Harrison, S.; Millan, R.; Kayastha, R.B.; Kayastha, R. Recent Evolution of Glaciers in the Manaslu Region of Nepal From Satellite Imagery and UAV Data (1970–2019). Front. Earth Sci. 2022, 9, 767317.
- Munir, S. Satellite-Based Study of Glaciers Retreat in Northern Pakistan. In Proceedings of the 37th COSPAR Scientific Assembly, Montréal, QC, Canada, 13-20 July 2008; Volume 37, p. 2135.
- Mayewski, P.A.; Jeschke, P.A. Himalayan and Trans-Himalayan Glacier Fluctuations Since AD 1812. Arct. Alp. Res. 1979, 11, 267.
- Li, X.; Cheng, G.; Jin, H.; Kang, E.; Che, T.; Jin, R.; Wu, L.; Nan, Z.; Wang, J.; Shen, Y. Cryospheric Change in China. Glob. Planet. Chang. 2008, 62, 210–218.
- Kehrwald, N.M.; Thompson, L.G.; Tandong, Y.; Mosley-Thompson, E.; Schotterer, U.; Alfimov, V.; Beer, J.; Eikenberg, J.; Davis, M.E. Mass Loss on Himalayan Glacier Endangers Water Resources. Geophys. Res. Lett. 2008, 35, L22503.
- Wang, Y.; Hou, S.; Hong, S.; Hur, S.D.; Liu, Y. Glacier Extent and Volume Change (1966∼2000) on the Su-Lo Mountain in Northeastern Tibetan Plateau, China. J. Mt. Sci. 2008, 5, 299–309.
- Shangguan, D.; Liu, S.; Ding, Y.; Li, J.; Zhang, Y.; Ding, L.; Wang, X.; Xie, C.; Li, G. Glacier Changes in the West Kunlun Shan from 1970 to 2001 Derived from Landsat TM/ETM+ and Chinese Glacier Inventory Data. Ann. Glaciol. 2007, 46, 204–208.
- Pu, J.-c.; Yao, T.-d.; Wang, N.-l.; Ding, L.-f.; Zhang, Q.-h. Recent Variation of the Malan Glacier in Hoh Xil Region of the Tibetan Plateau. J. Glaciol. Geocryol. 2001, 23, 189–192.
- Liu, J.; Yao, X.; Liu, S.; Guo, W.; Xu, J. Glacial Changes in the Gangdisê Mountains from 1970 to 2016. J. Geogr. Sci. 2020, 30, 131–144.
- Berthier, E.; Arnaud, Y.; Kumar, R.; Ahmad, S.; Wagnon, P.; Chevallier, P. Remote Sensing Estimates of Glacier Mass Balances in the Himachal Pradesh (Western Himalaya, India). Remote Sens. Environ. 2007, 108, 327–338.
- Kulkarni, A.; Bahuguna, I.; Rathore, B.; Singh, S.; Randhawa, S.; Sood, R.; Dhar, S. Glacial Retreat in Himalayas Using Indian Remote Sensing Satellite Data. Curr. Sci. 2007, 92, 69–74.
- Vohra, C.P. Himalayan Glaciers. In The Himalayan Aspect of Change; Oxford University Press: New Delhi, India, 1981; pp. 138–151.
- Bhambri, R.; Bolch, T.; Kumar, R. Chaujar Frontal Recession of Gangotri Glacier, Garhwal Himalayas, from 1965 to 2006, Measured through Highresolution Remote Sensing Data. Curr. Sci. 2012, 102, 489–494.
- Lu, N.; Trenberth, K.E.; Qin, J.; Yang, K.; Yao, L. Detecting Long-Term Trends in Precipitable Water over the Tibetan Plateau by Synthesis of Station and MODIS Observations. J. Clim. 2015, 28, 1707–1722.
- Trenberth, K.E.; Christy, J.R.; Hurrell, J.W. Monitoring Global Monthly Mean Surface Temperatures. J. Clim. 1992, 5, 1405–1423.
- Steiner, A.K.; Ladstädter, F.; Randel, W.J.; Maycock, A.C.; Fu, Q.; Claud, C.; Gleisner, H.; Haimberger, L.; Ho, S.-P.; Keckhut, P.; et al. Observed Temperature Changes in the Troposphere and Stratosphere from 1979 to 2018. J. Clim. 2020, 33, 8165–8194.
- Mountain Research Initiative EDW Working Group. Elevation-Dependent Warming in Mountain Regions of the World. Nat. Clim. Chang. 2015, 5, 424–430.
- Prasad, A.K.; Singh, R.P. Changes in Aerosol Parameters during Major Dust Storm Events (2001–2005) over the Indo-Gangetic Plains Using AERONET and MODIS Data. J. Geophys. Res. 2007, 112, D09208.
- Florian Ladstädter; Andrea K. Steiner; Hans Gleisner; Resolving the 21st century temperature trends of the upper troposphere–lower stratosphere with satellite observations. Sci. Rep. 2023, 13, 1-8, .
- Wester, P.; Mishra, A.; Mukherji, A.; Shrestha, A.B. (Eds.) The Hindu Kush Himalaya Assessment: Mountains, Climate Change, Sustainability and People; Springer International Publishing: Cham, Switzerland, 2019; ISBN 978-3-319-92287-4.
- Kesar Chand; Jagdish Chandra Kuniyal; Shruti Kanga; Raj Paul Guleria; Gowhar Meraj; Pankaj Kumar; Majid Farooq; Suraj Kumar Singh; Mahendra Singh Nathawat; Netrananda Sahu; et al. Aerosol Characteristics and Their Impact on the Himalayan Energy Budget. Sustain. 2021, 14, 179, .
- Raj Paul Guleria; Jagdish Chandra Kuniyal; Pan Singh Rawat; Nand Lal Sharma; Harinder Kumar Thakur; Pitamber Prasad Dhyani; Mahavir Singh; The assessment of aerosol optical properties over Mohal in the northwestern Indian Himalayas using satellite and ground-based measurements and an influence of aerosol transport on aerosol radiative forcing. Meteorol. Atmospheric Phys. 2011, 113, 153-169, .
- Raj Paul Guleria; Jagdish Chandra Kuniyal; Characteristics of atmospheric aerosol particles and their role in aerosol radiative forcing over the northwestern Indian Himalaya in particular and over India in general. Air Qual. Atmosphere Heal. 2015, 9, 795-808, .