Your browser does not fully support modern features. Please upgrade for a smoother experience.
Please note this is an old version of this entry, which may differ significantly from the current revision.
Subjects:
Engineering, Biomedical
Inspiring development in optical imaging enables great applications in the science and engineering industry, especially in the medical imaging area. Photonic time-stretch imaging is one emerging innovation that attracted a wide range of attention due to its principle of one-to-one-to-one mapping among space-wavelength-time using dispersive medium both in spatial and time domains.
- time-stretch imaging
- compressive sensing
- optical imaging
1. Shorter Wavelength Band for PTS Imaging
In the first category, the shorter wavelength band in the PTS imaging method results in better spatial resolution in principle. The “short” stands for wavelength spans from visible to near IR. Three examples will be displayed in this part, first is the 932 nm laser generation and dual color imaging with customer-designed light source revision; the second is the 710 nm imaging using special customer-designed device-FACED with the spatial dispersive device revision; last is the 1064 nm phase imaging with the systematic structure revision.
The first example of the PTS imaging system uses a 932 nm laser with the assistance of a new highly dispersive fiber (HDF), enabling MHz optical imaging [68]. The configuration of the swept source at 932 nm is shown in Figure 1. The configuration of a swept source contains three main elements: short pulse generation, wavelength sweeping, and power booster. Nonlinear polarization rotation mode-locking is applied in the fiber ring resonator, where a short pulse is generated. A 20-m double-cladding neodymium-doped fiber (NDF) is employed as the gain medium to boost laser output power. The wavelength sweeping is realized by using a custom-made HDF operating at a wavelength band of 800–1100 nm.
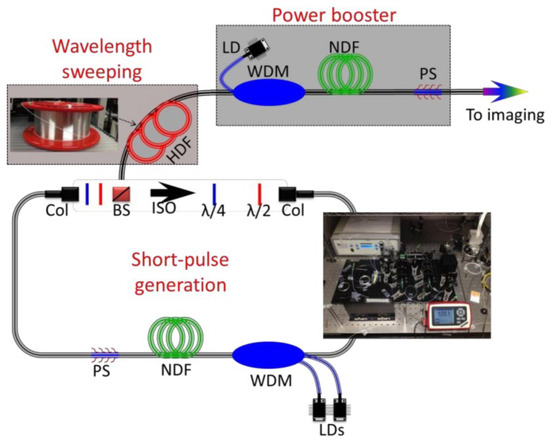
Figure 1. The schematic diagram of the MHz fiber-based swept source at 932 nm. HDF—highly dispersive fiber; NDF—neodymium-doped fiber; LD—laser diode; WDM—wavelength division multiplexing; Col—collimator; BS—beam splitter; ISO—isolator; λ/2: half-wave plate; λ/4: quarter-wave plate; PS—pump stripper [68].
The schematic diagram of the ultrafast dual-color imaging system based on HNF is shown in Figure 2. The wavelength-swept source has a center wavelength of 932 nm and a bandwidth of 7.2 nm at full width at half maximum. Light from the swept source is spatially dispersed by the diffractive grating, which has a groove density of 600 mm. A nonlinear BBO crystal is placed at the Fourier plane of L1 for second-harmonic generation (SHG) in order to demonstrate dual-color imaging at visible and near-infrared (NIR) wavelength bands. After the BBO crystal, 932 nm and 466 nm co-existed. After light illumination, light propagation, and light detection after wavelength separating using a dichroic mirror, the dual-color light information is processed to recover imaging.
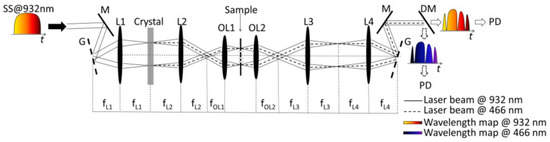
Figure 2. The schematic diagram of an ultrafast dual-color imaging system based on HNF. HNF—highly dispersive fiber; SS—swept-source; M—mirror; G—grating; L—lens; OL—objective lens; DM—dichroic mirror; PD—photodiode [68].
To demonstrate the capability of the PTS imaging system, a 7.6 MHz line-scan imaging is performed. The white-light imaging of the USAF-1951 resolution target is shown in Figure 3a. Figure 3b describes the line scanning result at varied bandwidths and sampling rates (from 1 GHz, 2.5 GS/s to 20 GHz, 40 GS/s).
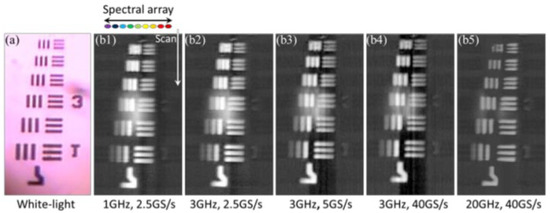
Figure 3. The images of the USAF-1951 resolution target captured by (a) a traditional white-light microscopy and (b) time-stretch microscopy at 932 nm, varied bandwidths and sampling rates (b1, 1 GHz, 2.5 GS/s; b2, 3 GHz, 2.5 GS/s; b3, 3 GHz, 5 GS/s; b4, 3 GHz, 40 GS/s; b5, 20 GHz, 40 GS/s) are employed for real-time oscilloscope [68].
The second example of the PTS imaging system is called free-space angular-chirp-enhanced delay (FACED) [70]. FACED generated high temporal dispersion and low intrinsic loss at a visible wavelength (~710 nm). FACED also enabled fluorescence and colorized time-stretch imaging while at the same time having the benefit of low intrinsic loss.
Figure 4 shows the working principle of FACED. A pair of highly reflective plane mirrors placed at a distance of S with a minute mirror misalignment angle α (typically 10−3 rad) is employed to realize the working principle of time-stretch at visible wavelength. The pulse is propagated and stretched in free space within the space between two reflective plane mirrors, shown in Figure 4a. The pulse stretching resulted from the misalignment of two mirrors, which generated ample and configurable time delay among the cardinal rays. To stretch the pulse within the two mirrors, the pulse is demanded to focus at the entrance point of the FACED device, O. This results from the application of an angular disperser module. The scheme of an angular disperser module is depicted in Figure 4b. In the spectral encoding (SE) scheme, a diffraction grating is used as an angular disperser. In the SE-free scheme, a focusing lens is applied as the angular disperser. The main concept of FACED is shown in Figure 4c. It not only can perform pulse stretching in the temporal domain but also can transfer an input simultaneous pulse beam into a time-encoded serial scanned beam in space.
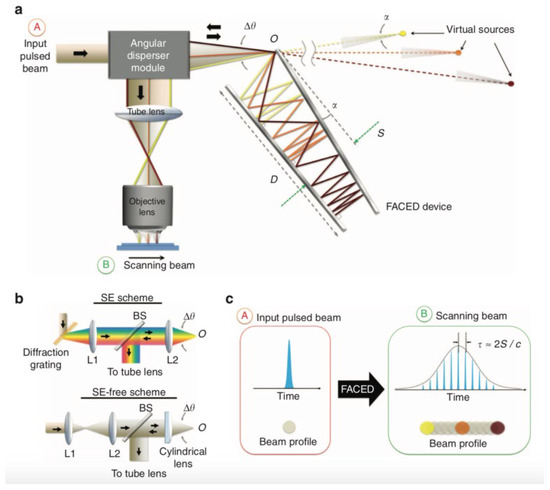
Figure 4. Working principle of FACED. (a) Overall schematic of the PTS imaging system based on FACED. (b) Schematic of the angular dispersers employed in (top) the SE scheme and (bottom) the SE-free scheme. (c) Overall concept of FACED. SE—spectral encoding [70].
The demonstration of FACED-based PTS microscopy working on SE scheme in an ultrafast microfluidic flow with a speed of 2 m/s at a line-scan rate of 80 MHz. The imaging results are shown in Figure 5. In comparison with the images detected by high-speed CMOS camera (15,000 fps, Figure 5a), FACED-based PTS microscopy captured images of Scenedesmus acutus cells (Figure 5b,c), monocytic leukemia cells (THP-1; Figure 5d,f), and human red blood cells (RBSs; Figure 5e,g), are blur-free and at the same time have higher resolution, showing the fine subcellular features. For example, the blebs of the THP-1 and the biconcave shapes of the RBCs are displayed in Figure 5d,e.
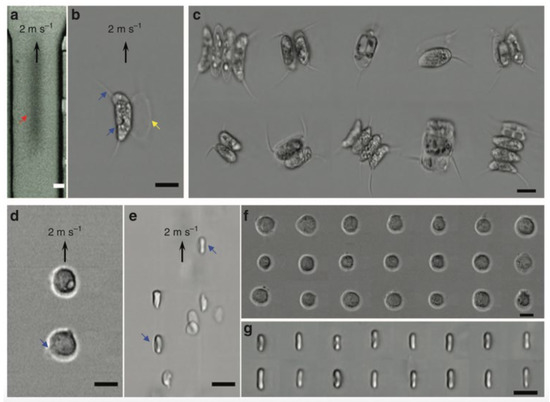
Figure 5. FACED-based microscopy using SE scheme in an ultrafast microfluidic flow at 710 nm. Images of Scenedesmus acutus in an ultrafast microfluidic flow captured by (a) a CMOS camera (15,000 fps.) and (b) the FACED-based microscope. (c) Images of Scenedesmus acutus captured by the FACED-based microscope. Images of (d) monocytic leukemia cells (THP-1) and (e) human red blood cells (RBCs) in an ultrafast microfluidic flow. Images of (f) THP-1 and (g) RBCs captured by the FACED-based microscope [70].
Figure 6 shows the FACED-based microscopy working on the SE-free scheme. The bright-field and FACED-based microscopy images on the smallest element of group 9 of resolution target USAF-1951 are shown in Figure 6a,b, respectively. The FACED-based image has a slightly lower resolution. The slightly lower resolution of the FACED images is owing to the smaller number of scanned spots, and this resolution can be improved by adjusting both the mirror misalignment angle and the input cone angle. The static sample of a hematoxylin-and-eosin (H&E)-stained lung tissue section is also applied for bright-field (Figure 6c) and FACED-based microscopy (Figure 6d) imaging. An ultrafast microfluidic flow at 2 m/s of RBCs and peripheral blood mononuclear cells (PBMCs) are illustrated in Figure 6e,f, respectively. Additionally, the fluorescence FACED-based microscopy working on the SE-free scheme with a line-scan rate of 8 MHz is demonstrated using a 10 μm fluorescent bead in the ultrafast microfluidic flow at 2 m/s. The result is shown in Figure 6g.
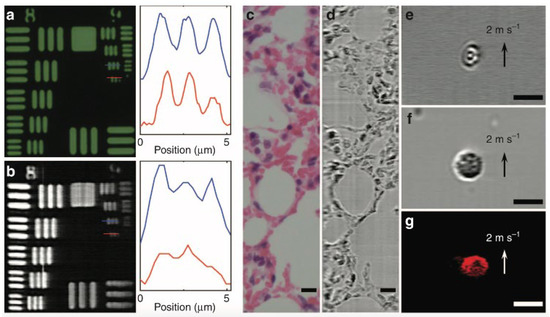
Figure 6. FACED-based microscopy using the SE-free scheme at 710 nm. (a) Bright-field transmission and (b) FACED-based microscopy images of resolution target USAF-1951. (c) Bright-field transmission and (d) FACED-based microscopy images of a hematoxylin-and-eosin (H&E)-stained lung tissue section. Time-stretch images of (e) RBCs and (f) peripheral blood mononuclear cells (PBMCs) in a microfluidic flow. (g) Fluorescence FACED-based microscopy image of a 10 μm fluorescent bead in a microfluidic flow. Scale bars 10 μm [70].
The third example is interferometric PTS (IPTS)-based microscopy for ultrafast quantitative cellular and tissue imaging at 1 μm wavelength band [72]. IPTS-based microscopy could overcome the traditional imaging speed limitation of the quantitative phase imaging method. The line-scan rate of IPTS-based microscopy could be as high as 20 MHz, and the ultrafast flowing cells with a flow speed of 8 m/s are several orders of magnitude higher than conventional quantitative phase imaging.
The overall schematic of the IPTS-based microscopy is illustrated in Figure 7a. A laser source with a center wavelength of 1064 nm, a bandwidth of 10 nm, and a repetition rate of 26.3 MHz or bandwidth of 60 nm and a repetition rate of 20 MHz is provided as the microscope source. The pulsed laser is split into two beams through a beam splitter. One beam is treated as the signal beam passing through the biomedical samples. The other beam is regarded as the reference beam, reflected by mirrors. Then the two beams combined into one via the same beam splitter and propagated through the dispersive fiber. After pulse amplification and detection, the pulse information is ready for processing. Figure 7b shows the waveforms of temporal and spectral domains of different stages.
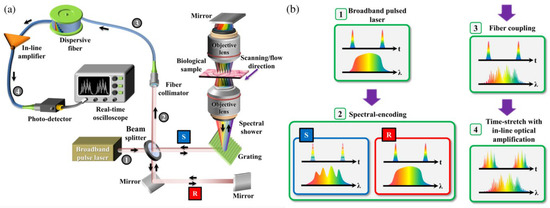
Figure 7. (a) Schematic of IPTS-based microscopy. (b) The corresponding temporal and spectral waveforms are in different stages (steps 1 to 4, as shown in (a)). R and S refer to the reference and the sample arms in a Michelson interferometer configuration [72].
The result of fixed epithelial cells by IPTS-based microscopy at a line-scan rate of 1 MHz and conventional phase contrast microscopy is described in Figure 8a,b, respectively. When the ultrafast flowing cells with a flow speed of 8 m/s and 0.4 m/s, a cluster and single HeLa cells and normal hepatocyte cells (MIHA) are captured by the IPTS-based microscopy, which is shown in Figure 8c,d and Figure 8e,f, respectively. The ultrafast flow speed (8 m/s) corresponding to an imaging throughput as high as 80,000 cells/s. Thus, this IPTS-based microscopy is proved to be an ultrafast quantitative phase imaging.
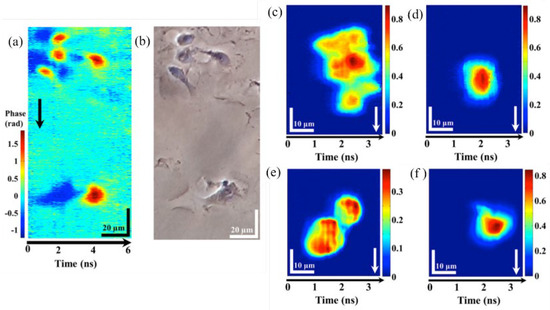
Figure 8. IPTS−based microscopy of fixed and flow cells. Fixed epithelial cells were captured by (a) IPTS−based microscopy at 1 MHz line-scan rate and (b) conventional phase contrast microscopy. IPTS−based microscopy with a flowing speed of 8 m/s at (c) clusters of HeLa cells and (d) single HeLa cells. IPTS-based microscopy with a flowing speed of 0.4 m/s at (e) clusters of MIHA cells and (f) single MIHA cells [72].
2. Fast Speed for PTS Imaging
The second category describes the world’s fastest frame rate based on PTS microscopy. The frame rate of PTS microscopy equals the repetition rate of the pulsed laser.
In this category, a pulsed laser source with a repetition rate of 10 GHz, a center wavelength of 1549.2 nm, a 3 dB bandwidth of 1.2 nm, and a pulse width of 2 ps is employed [74]. The schematic of the superfast PTS imaging system is shown in Figure 9. The frame rate, in theory, can be as high as 10 Gfps. Due to the dispersion limitation (a dispersion of 1377 ps/nm), a gated Mach–Zehnder amplitude modulator is utilized to reduce the repetition rate to 1 GHz. The pulse propagated through the diffraction grating and sample and reflected for data detection with the same path back. The high temporal dispersion leads to pulse overlapping; thus, a wavelength division technique is utilized, which can overcome the trade-off between a high frame rate and spatial resolution. In practice, the temporal signal is equally split into two channels by varied wavelength-band filters at the receiver end.
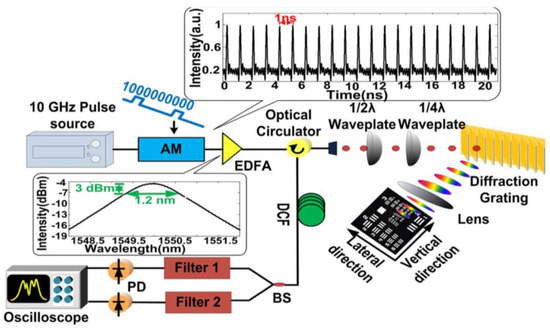
Figure 9. Experimental setup of the superfast PTS imaging system with 1 GHz. AM, amplitude modulator; EDFA, erbium-doped fiber amplifier; BS, beam splitter; PD, photodetector [74].
The principle of the wavelength division technique is shown in Figure 10. The dispersed pulses are linearly chirped, and adjacent pulses overlap in the time domain. As shown in Figure 10, T stands for the period of the pulse laser, Z is the temporal width of the dispersed whole pulse, B is the spectral bandwidth of the optical pulse, D is the group velocity dispersion (GVD), and W is the width of pulse filtered from each channel. Then the two channels without temporal overlap are detected by high-speed PD, and then further data processing is applied to recover the image.
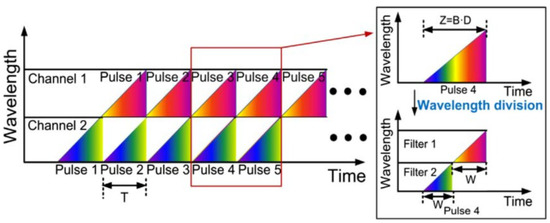
Figure 10. The principle of wavelength-division technique [74].
A USAF-1951 resolution target is utilized for imaging at element 2, group 4, with a line width of 28 μm. The same 2D image is reconstructed at a 100 MHz scan rate (Figure 11a) and 1 GHz scan rate (Figure 11b); the quality of the image does not degrade with the increasing line scan rate. The state-of-art of this demonstration validates the capability of the PTS-based 1 GHz microscopy with wavelength-division technique.
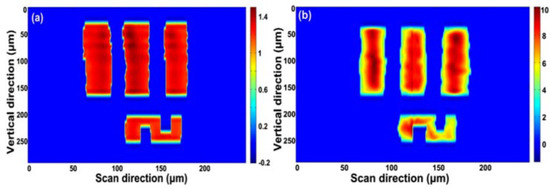
Figure 11. (a) Reconstructed 2D image with a 100 MHz scan rate and (b) reconstructed 2D image with a 1 GHz scan rate [74].
3. Data Compression for PTS Imaging
The third category describes the data compression techniques combined with PTS-based microscopy. The high amount of real-time digital data generated by the equipment leads to an unintended consequence of extremely high throughput imaging acquisition, which brings a heavy burden for the data acquisition and, following data processing, sets the barrier to real-time imaging. Here, two techniques will be discussed in this category.
Figure 12 shows the linear and AST dispersive Fourier transforms [14]. Orange points depict the linear time stretch between spectrum and time. The constant straight slope line reveals the linear GVD. The spectral components of the pulse train are linearly distributed in time, even in the silent time zone, which increases the amount of invalid data. In a linear time stretch scheme, the spectrum of the pulse and the waveform are uniform with the same sampling resolution. In contrast, blue points show a nonlinear GVD that varied GVDs over the spectrum can stretch the spectrum nonlinearly. With nonlinear GVD, regions of the spectrum are stretched more than others, leading to the nonlinear mapping between the spectrum and waveform. If the sparsity of the spectrum of the under-testing imaging is known, thus a dense spectral zone with large GVD while a silent spectral zone with small GVD could increase the imaging resolution and, at the same time, maintains the same amount of data.
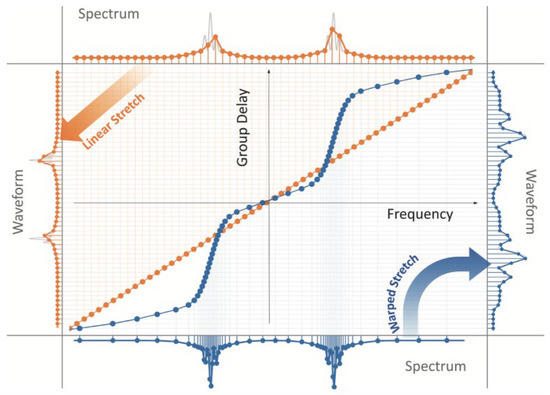
Figure 12. Linear (orange) and anamorphic time stretch (AST, Blue) dispersive Fourier transforms. AST—anamorphic time stretch [14].
The experimental result of the PTS-based imaging system with nonlinear time stretch over the spectral bandwidth is shown in Figure 13. Figure 13a illustrates how the test sample (with a width of 5 cm) reflected one-dimensional rainbow illumination pulses (with a repetition rate of 36 MHz). Figure 13b states the shape of the nonlinear time stretch between the GVDs and spectral components. It is designed and performed by a custom chirped fiber Bragg grating (CFBG) with a nonlinear group delay profile. If a high linear dispersion (same as the warped stretch at the center frequency) is linearly distributed among all the spectral components, the recovered image size is 24.3 KB in Figure 13c. With the nonlinear time stretch of the waveform owing to the utility of CFBG, the reconstructed imaging is shown in Figure 13d with an image size of 8.3 KB and an obvious warping effect in the letter “S”.
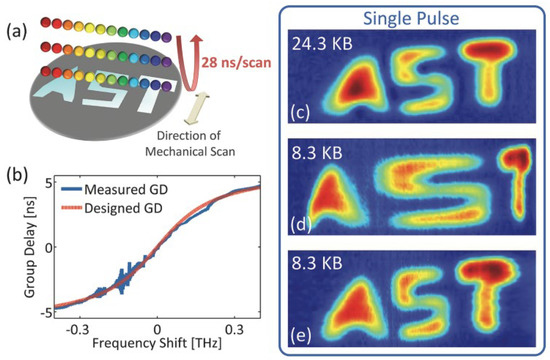
Figure 13. Experimental results of AST imaging system. (a) The schematic of the light pulse interacting with the test sample. (b) The designed nonlinear warped stretch transform, (c–e) are different picture sizes with different GVDs. GVD—group velocity dispersion [14].
The schematic of the combination of the CS technique and PTS-based imaging system is shown in Figure 14 [13]. Compared to classical PTS-based imaging systems, the CS and PTS-based imaging systems added a pulse pattern generator (PPG) that generated pseudo-random binary sequences (PRBSs). The RPBSs mixed the pulse signal when the light pulses propagated through the Mach-Zehnder modulator (MZM). The light pulses, reached the target and were detected by PD for imaging reconstruction based on CS algorithms.
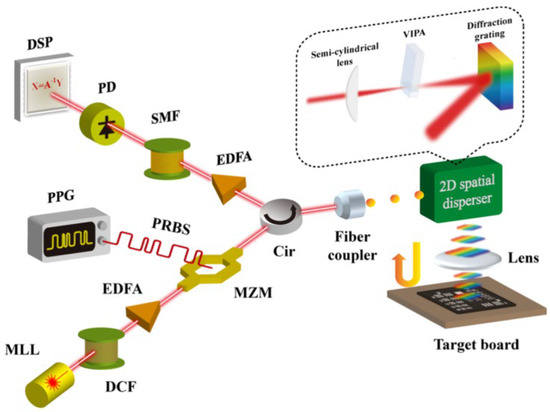
Figure 14. Scheme of the combination of CS technique and PTS-based imaging system. MLL—mode-locked laser, DCF—dispersion compensating fiber, EDFA—Erbium-doped fiber amplifier, MZM—Mach-Zehnder modulator, PPG—pulse pattern generator, PRBS—pseudo-random binary sequence, Cir—circulator, VIPA—virtually-imaged phased array, SMF—single-mode fiber, PD—photo-detector, DSP—digital signal processor [13].
Reconstructed images are displayed in Figure 15. Captured 2D images without CS are shown in Figure 15a. Figure 15b–e reveals the reconstructed images at different compression ratios of 5%, 6.25%, 12.5%, and 18.75%, respectively. The imaging recovery precision of varied compression ratio is evaluated by the peak-SNR (PSNR) of the reconstructed images, shown in Figure 15. This technique can achieve a data compression ratio of 5% with fair image recovery precision.
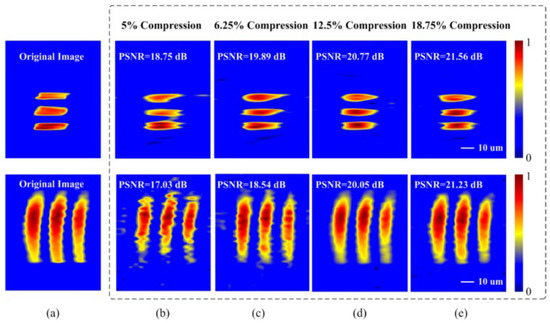
Figure 15. (a) The reconstructed 2D images without CS. Images were reconstructed at compression ratios of (b) 5%, (c) 6.25%, (d) 12.5%, and (e) 18.75% [13].
This entry is adapted from the peer-reviewed paper 10.3390/photonics10070817
This entry is offline, you can click here to edit this entry!