Your browser does not fully support modern features. Please upgrade for a smoother experience.
Please note this is an old version of this entry, which may differ significantly from the current revision.
For millennia, humans relied almost entirely on renewable energy (RE), largely biomass, for their energy needs. Fossil fuels (FFs) have not only largely replaced RE, but have enabled a many-fold rise in total energy use. This FF dominance changed the way we think about and accounted for energy use. If (as at present) the world essentially continues to ignore climate change, eventual resource depletion will force conversion to RE and, perhaps, nuclear energy will once again have to provide most of the world’s energy use.
- bioenergy
- climate change mitigation
- energy accounting
- fossil fuels
- future energy
- passive solar energy
- renewable energy
1. Introduction
According to Vaclav Smil [1], global primary energy use in the year 1800 was only 20.35 EJ (exajoule = 1018 joule), of which nearly all (an estimated 20 EJ) was fuel wood and the rest coal. Figure 1 shows how primary energy use has developed since 1800, with fossil fuels enabling the massive growth in use, particularly since 1950, to 576 EJ in 2016 [2]. Despite bioenergy falling to around 10% of global primary energy today, its use has also grown from 1800 to around 50 EJ today. The more than century-long dominance of fossil fuels (FF) has shaped the way we think about energy. The world, especially the high-income nations, have become accustomed to using—by historical standards, at least—vast quantities of cheap energy [3]. The world is also accustomed to viewing fossil energy as a very energy large store, so that, so far, there have been no geological limits on annual withdrawals.
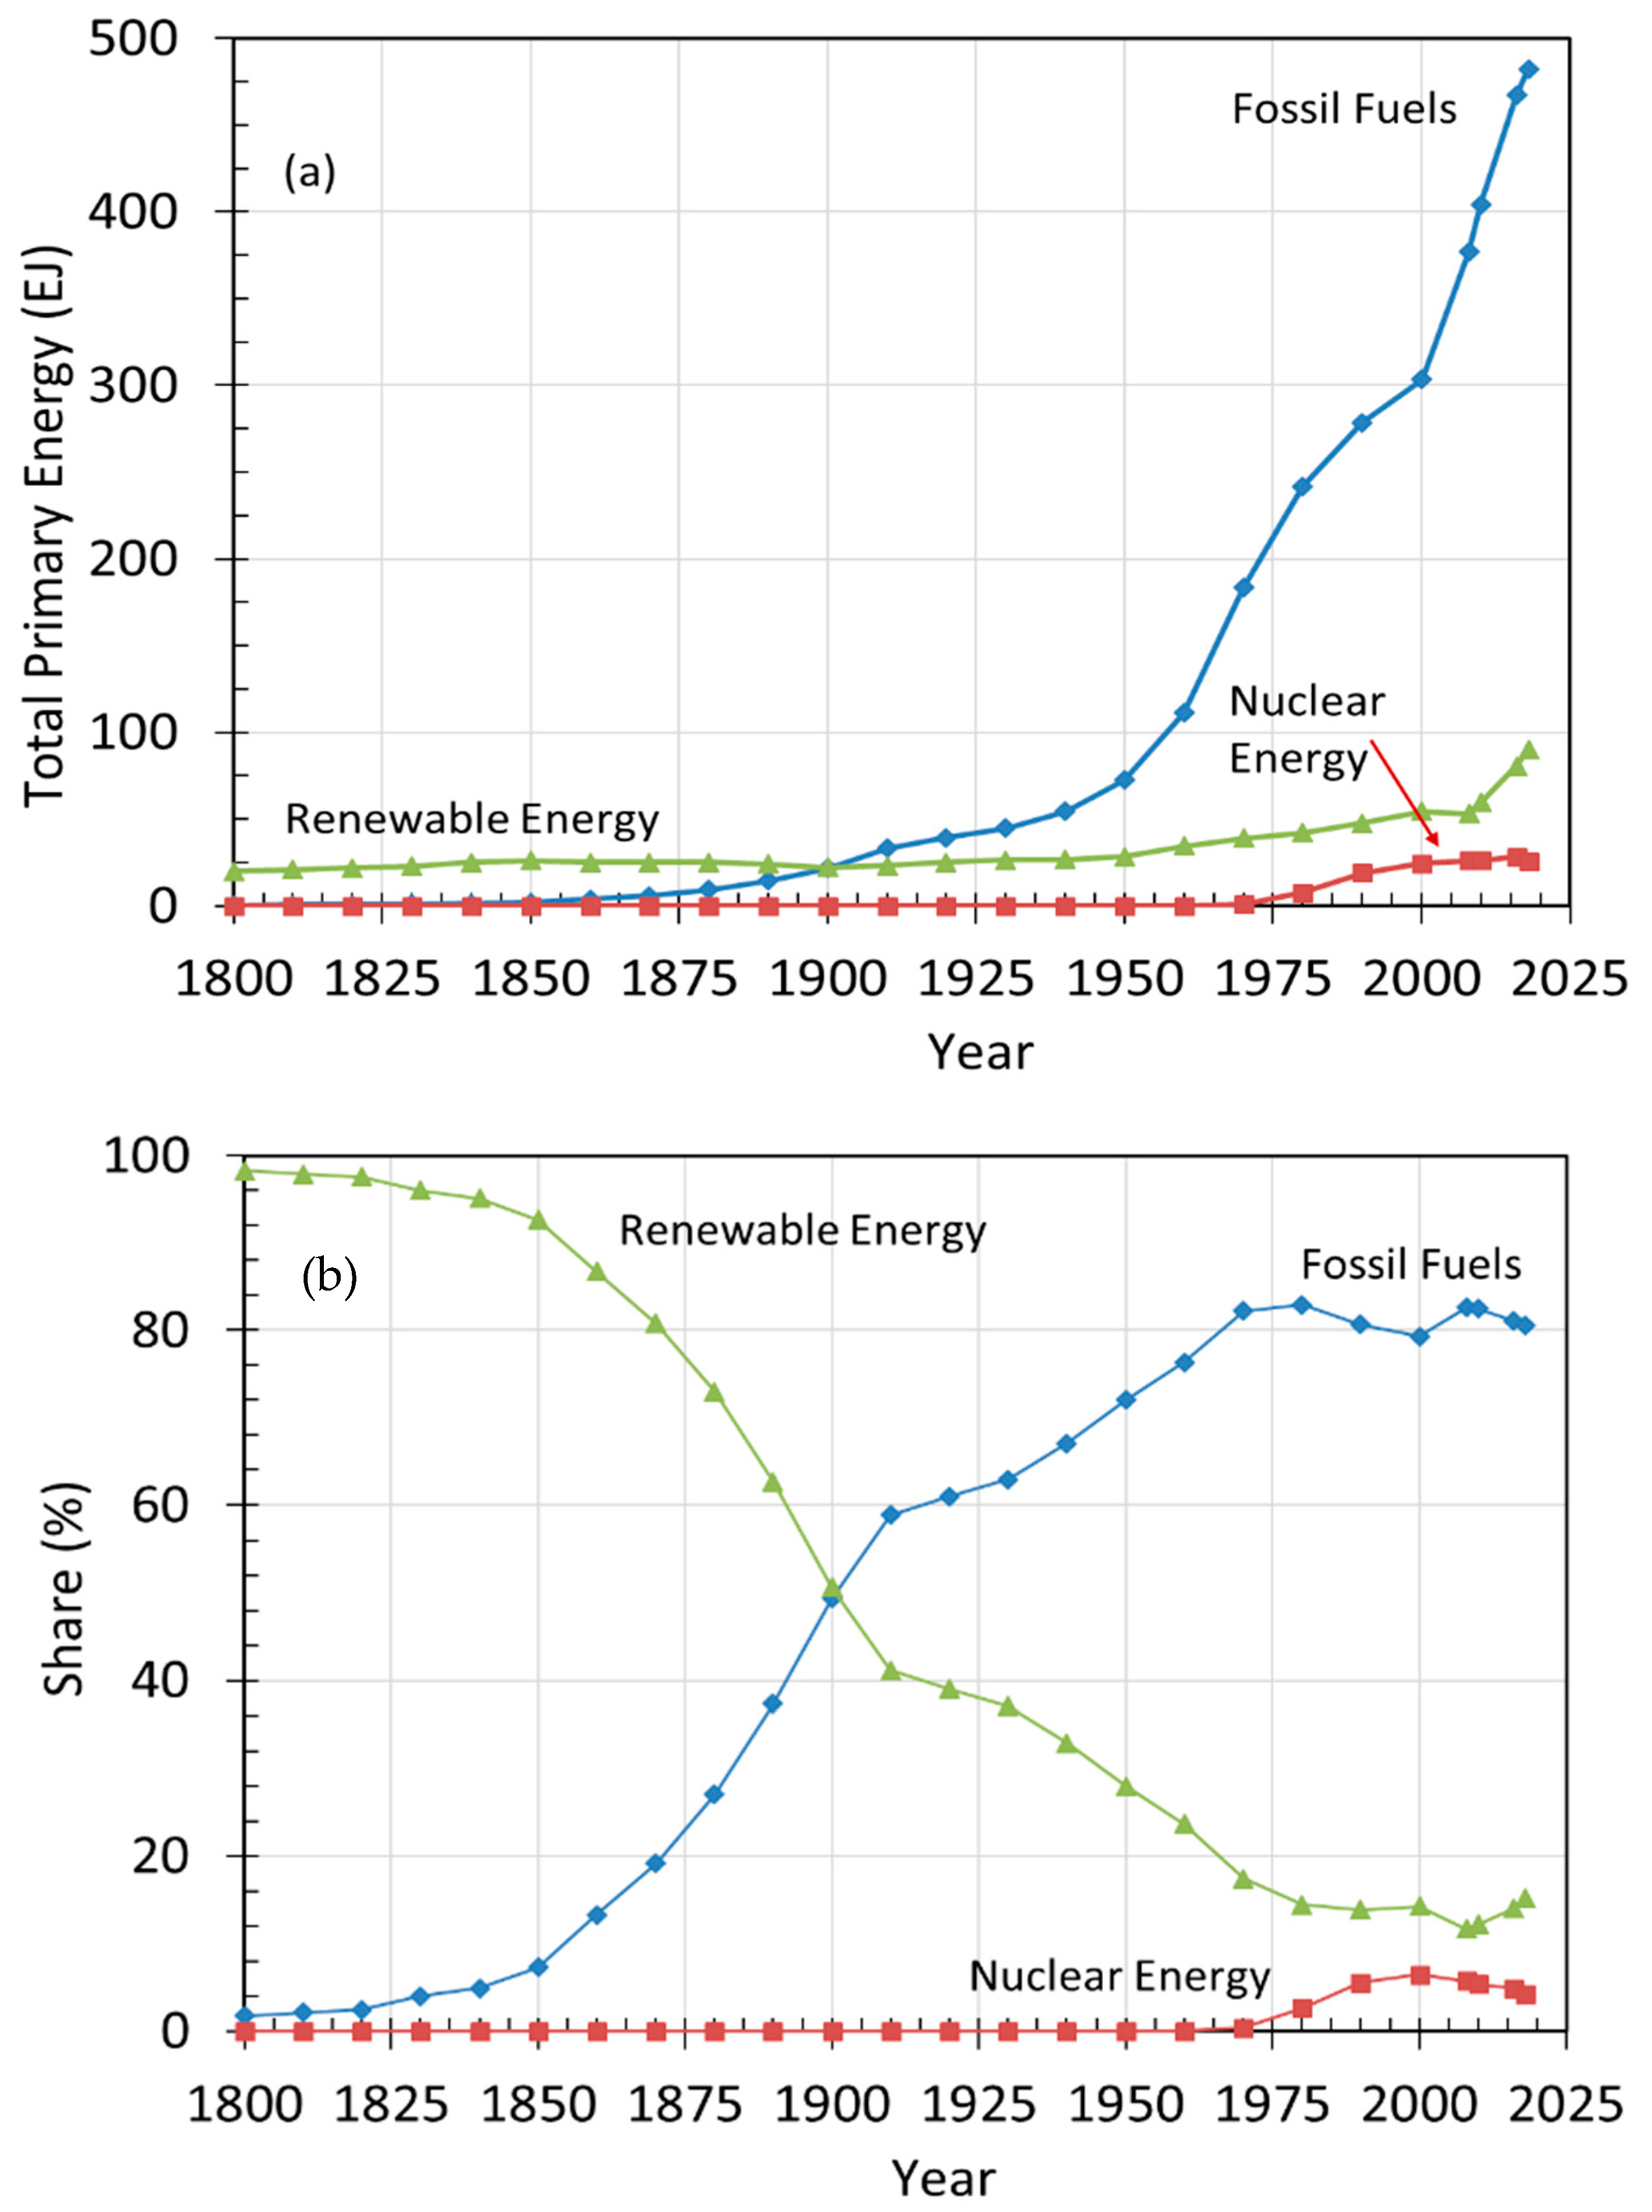
Figure 1. Global primary energy use by energy type, 1800–2018: (a) in EJ; (b) Share %. Sources: 1,2,5,6.
It is not hard to see why keeping track of both FF reserves and production statistics are important. The Organization of the Petroleum Exporting Countries (OPEC), for example, at various times have imposed production quotas on its member states to boost or maintain oil prices, which evidently require the assembling of production statistics not only for OPEC countries, but also on global production (see, for example OPEC [4]). Statistics on reserves of FFs are also important, given the vital importance of oil and natural gas (NG) exports for many countries, not only in OPEC. Knowledge of proven recoverable reserves are essential for energy infrastructure planning, for economic planning and for securing international loans. Calculating global or national annual consumption of each fossil fuel is needed to determine how long it will take to exhaust proven recoverable reserves of these stocks. Importing countries likewise need to know what quantities are available for importing in the future, and from which countries. They also need to have statistics on the daily and annual consumption of each FF, especially oil and NG, in order to know how long their stockpiles will last in the case of supply interruptions. Figure 1, based mainly on historical data from [1][2], and later data from [5][6], gives a view of global energy use since 1800.
2. Why Do We Need RE?
The first question which must be addressed in this entry is why RE will have to provide most of the world’s energy in future. After all, the Intergovernmental Panel on Climate Change (IPCC) and the International Energy Agency (IEA) place heavy reliance on carbon capture and storage (CCS) for fossil fuels and negative emissions technologies (NETs) including CCS with bioenergy (BECCS) [7][8], while others have argued that solar radiation management (SRM) is increasingly an important option for climate change mitigation [9]. If either of these options were successfully implemented, non-biomass RE would take decades to be a major energy source, as FF annual production slowly declined to low levels [10]. The question of changing our energy accounting system could likewise be postponed for decades.
Biological CDR, such as reforestation, has limited potential [11], and in any case global (net) deforestation is once again rising. Since most of the present CO2 emissions come from large FF plants such as power stations or refineries, CO2 could in principle be captured directly from the exhaust stacks, where CO2 concentrations can be 10%–15%, then stored underground in deep saline aquifers, for example. The energy penalty in suitably optimised plants, would probably only be of the order of 25%, but because very few existing plants are so optimised, the energy costs for CCS could be appreciably higher. This energy cost will further lower their EROI [12][13]. Other forms of mechanical CDR include negative emissions technologies (NETs) such as direct air capture of CO2 or enhanced weathering of minerals. Implementing these technologies would take decades to be significant, and are very costly in energy and monetary terms [14]. Anderson [15][16] has cautioned against unproven technologies such as NETs forming the basis of future energy plans.
In brief, these two options both face numerous challenges, including basic feasibility, political and legal opposition, high costs and even new, unforeseen environmental risks [17][18][19]. It therefore seems very likely that RE will need to become the major energy source, even if this change owes as much to major FF decreases in use, as to rapid RE output growth.
3. Treatment of Primary RE Electricity
Although there are standards recommending methods to compile energy statistics [20], conflicting approaches remain between major groups in the calculation of the contribution to global primary energy from non-thermal electricity sources such as from hydro, wind and photovoltaic (PV) cells [21]. These conflicts are inevitable, given that as Raugei [22] has pointed out comparing electricity and thermal energy is like counting ‘apples and oranges’ together. The IEA [2] method converts primary electricity to primary energy on a 1:1 basis, although for all thermal sources of electricity, whether FF, RE, or nuclear, the input heat energy is used based on a conversion efficiency of 33%. In contrast, BP converts non-thermal electricity to primary energy “by calculating the equivalent amount of fossil fuel required to generate the same volume of electricity in a thermal power station assuming a conversion efficiency of 38% (the average for OECD thermal power generation)” [6] (p. 60). BP also excludes non-commercial fossil fuels from its primary energy statistics, partly because, unlike fossil fuels, their consumption can only be roughly estimated.
Electricity production from low thermal conversion efficiency RE sources present further difficulties. For STEC and geothermal electricity the IEA assume 33% and 10% conversion efficiencies respectively [2]. Hence primary energy is calculated as 10 times the electrical energy output. But what if ocean thermal energy conversion (OTEC)—electricity generated from the roughly 20 °C difference between surface waters and deep water in tropical oceans—is developed on a large scale? Conversion efficiency at such low temperature differences would only be a few percent [23]. Would primary energy be calculated as 30–50 times the electric output?
Even though hydroelectricity produced 4193 terawatt-hr (TWh = 1012 watt-hr) of electricity in 2018, compared with 2701 TWh from nuclear [6], in the IEA accounts, hydro is credited with only about half the total primary energy of nuclear power, even though electricity is presently its sole output [2]. For wind and solar, use of either approach will not make much difference at present low levels of output. But if RE has to largely replace FFs in the total energy mix, wind and solar energy will have to account for the bulk of energy production [24]. Which method is used will then become an important question.
For UN bodies such as the IPCC, particularly when undertaking long term scenario planning, the problems arising from use of accounting for different energy production methods is addressed through use of a method known as direct equivalent energy accounting. This method “…counts one unit of secondary energy provided from non-combustible sources as one unit of primary energy” [24] (p. 1294). It is claimed that this method enables planers to deal with energy systems undergoing transition to low carbon energy sources [25].
A common factor of all these methods is that they ignore the intermittent nature of what will become the main energy sources, wind and solar [24]. At present, such intermittency does not matter much, since nearly all electricity is produced from non-intermittent sources. In 2018 the intermittent sources (solar and wind) only produced 7.0% of global electricity—and a much smaller share of final energy demand [6]. If wind and solar dominate energy supply in future, energy storage on a large scale will be necessary, especially since most energy will be produced as electricity. Methods could include batteries, pumped water storage, compressed air energy storage, and conversion to hydrogen, either for direct use or storage for later use. The problem is that regardless of which storage method is used, substantial energy losses are incurred [26]. The important point is that in a future dominated by intermittent RE, electricity produced from these sources cannot be simply added to electricity from dispatchable sources such as hydroelectricity.
Wind and PV solar energy produce only electricity, but although many services presently using non-electric sources—such as road passenger transport—can be converted to use electricity, not all energy can be used in the form of electricity. Conversion to some other energy form such as hydrogen (H2) will be needed. Again, this conversion process will inevitably involve energy losses, and so will lead to low EROI sources dropping out of the mix and will complicate any RE energy accounting.
4. Selective Inclusion of Items in Present RE Accounts
Use of passive solar energy, and even some active RE sources, is a grey area in official energy statistics. For RE, it is also not always clear where the boundary lies between active and passive energy, or between passive energy and energy conservation.
Some items which should be included for consistency with present energy accounting methods are given below. It is often not clear whether, or to what extent, these items are included in official energy statistics, such as those of the IEA. For example, the IEA [2] state that geothermal or biomass heat only includes heat that is produced for sale. Even on-farm use of biogas by commercial farms is excluded. Yet the heat value of non-commercial fuel wood is included in the IEA global primary energy total.
-
Geothermal heat. Naturally occurring geothermal pools have been used by humans since paleolithic times and are found on all continents. The Romans used geothermal energy for space heating two millennia ago, and a geothermal district heating system has been operating in one French town since the 15th century [27][28]. The geothermal input energy needed to maintain the temperature of all these pools utilised today should be included in the geothermal energy (heat) statistics, even if the hot water has not been fed in by a pipe or otherwise engineered As with use of fire in agriculture (see below), one objection might be that this natural heat energy source is ‘used’ inefficiently, but satellite pictures of brightly-lit cities at local midnight time also indicate high energy waste—yet the electricity so consumed is still counted in official statistics.
-
Greenhouses. Greenhouses throughout the world occupy large areas—in the mid-1980s in the EU alone, greenhouses already covered 600 km2 [29], and today in the Netherlands, cover 0.25% of the entire country [30]. In temperate climates, fossil fuels are often used as auxiliary fuels to heat them (and, of course, to manufacture greenhouse materials), but in some cases passive solar energy alone is used for their heating. Hassanien et al. [31] have also discussed how passive solar energy can be used to heat greenhouses by redesigning them as solar collectors and employing special materials. During the transition to an accounting system based on RE, passive solar energy use could be calculated by comparing the temperature difference in solar-heated greenhouses with that in adjacent open fields—and subtracting any input FF energy to obtain the net energy.
-
Cooling by evapotranspiration from trees. Trees can transpire large quantities of water each day from their leaves, and the latent heat needed for evaporation can be a useful source for urban cooling, counteracting to some extent the Urban Heat Island (UHI) effect. In fact, reduced evapotranspiration from paved and roofed urban surfaces (along with heat release and the ‘canyon effect’) is a major contributor to the UHI [32]. In the large sub-tropical city of Shenzhen, China, Zhang et al. [33] (p. 323) found that in urban parks: “As compared to the control open sites, the temperature reduction due to plant communities ranged from 2.14 °C to 5.15 °C, and the relative humidity increase ranged from 6.21% to 8.30%”. Urban parks can accordingly to some extent substitute for mechanical air conditioning: Xu et al. [34] have in fact calculated the air-conditioning kWh saved by the presence of an urban park in Beijing, China.
-
Passive solar heating/cooling of buildings. There is now a very large volume of research on the energy efficiency of buildings [35], including the use of passive solar energy for heating, cooling and lighting [36][37][38][39]. Chan et al. [39] reported that passive solar design can add anywhere between 0% and 15% to design and construction costs. The energy costs of the materials also must be considered, especially if exotic materials like nanofibers are used (see below). Again, it is the net energy which is important. However, special materials now being developed for thermal control of buildings make the distinction between active and passive solar energy problematic. Li et al. [40] (p. 760) have developed a high strength structural timber by removing the lignin and densifying the material. They found that: “The cellulose nanofibres in our engineered material backscatter solar radiation and emit strongly in mid-infrared wavelengths, resulting in continuous subambient cooling during both day and night”. The authors also modelled the energy savings possible with their engineered material as between 20% and 60%, with the higher figure for hot, dry climates. These and other new materials such as a variety of phase change materials [41] can be used for cooling buildings, with reported energy savings as high as 98%. Granqvist et al. [42] (p. 1170) have reviewed the use of electrochromic materials in buildings. These materials are “characterized by properties that can be tuned, persistently and reversibly, through the application of electrical current or voltage”. They can be incorporated as thin films into window glass for “modulating optical transmittance” to reduce building energy consumption. They can be applied to other building surfaces as well as glass. All researchers have concluded that application of passive solar energy techniques could very significantly reduce present energy consumption of buildings in most countries.
-
Solar drying of crops, clothes and sea salt. Another widespread use of solar energy is for drying crops and seasoning construction timber. A combination of wind and solar energy is also used in many countries for salt production [43]. According to Wikipedia [44], “The evaporation of seawater is the production method of choice in marine countries with high evaporation and low precipitation rates. Salt evaporation ponds are filled from the ocean and salt crystals can be harvested as the water dries up”. In other cases, mechanical evaporation of brine is used. Ranjan et al. [45] have performed an energy (and exergy) analysis on what they describe as passive solar distillation system for fresh water production. But the glass cover over the saline water makes it similar to flat plate solar water heaters, which are regarded as active solar energy systems. Wind/solar energy is also used by hundreds of millions of households worldwide for outside clothes drying.
It is evident from the preceding discussion that it is often hard to draw a clear line between active and passive solar energy. Further, passive solar energy refers to a spectrum of uses of ambient energy. At one extreme, we have the millennia-old practice of clothes and salt drying, and at the other extreme we have high-technology engineered materials for storing solar energy or reflecting very high proportions of incident radiation. In between these two extremes are long-established practices such as buildings having a large thermal mass to balance out day and night temperatures, Trombe walls, etc. Which of these applications should be included in RE energy accounting?
5. The Special Case of Bioenergy
Bioenergy, still by far the largest RE source in global primary energy use, is different from other RE sources in several important ways. First, like fossil fuels, themselves derived from ancient living biomass, the energy is available in the form of chemical bonds. Biomass, like coal, is a solid fuel, and can be co-fired with coal in power stations, and like fossil fuels, can be stored for later use, although its energy density is much lower than that for FFs. But from an energy accounting viewpoint, two further, related, characteristics stand out. First, bioenergy competes heavily with other uses for biomass, and second, these non-energy uses are not accounted for, unlike the case for FFs.
6. Technical Potential for Other RE Sources
The indeterminate nature of bioenergy technical potential has already been discussed. If RE is ever needed to almost entirely replace FF, it is still important to know whether all RE sources together have the potential to meet current and possible future global energy needs. It may be thought that only if ambitious schemes such as a global electricity grid is adopted will global RE energy statistics be important for planning. However, Capellán-Pérez et al. [46] have shown that land constraints alone would limit the ability of densely populated countries in Northern Europe or Japan from meeting their present energy needs from local RE sources. RE can be exported across oceans in the form of liquid hydrogen. Japan, presently a major importer of fossil fuels, plans to inaugurate a “hydrogen society” [47][48]. The hydrogen (H2) would be imported from countries like Australia and Argentina, both with good potential for solar and wind energy. The H2 could be produced in the exporting countries from surplus intermittent RE by hydrolysis, although H2 conversion and overseas transport as liquefied H2 could result in low net energy [49].
In 2016, the world consumed 576 EJ from all primary energy sources including non-commercial fuel wood energy [2], and estimates for year 2100 reviewed in [50] go up to 1000 EJ or even higher. Published estimates for global RE technical potential display a large range, but mostly well in excess of 1000 EJ, suggesting that technical potential will not limit RE use any time soon. However, these high values are not based on EROI calculations; RE sources and fields with low EROI values should be excluded (see below). Annual estimates for low temperature geothermal energy range up to 300,000 EJ, even though the range for annual geothermal electricity potential is several orders of magnitude lower, at 1.1–22 EJ [50]. But this figure for low temperature heat would not be sustainable in the long term: annually, the heat flow to all Earth’s surface is only about 1300 EJ, and most of this heat flow occurs under the oceans or in inaccessible areas on land [51]. For the US, geothermal energy is concentrated west of the Rockies, so that only a small fraction of the US population could economically use it [52]. Until the actual amount of useable geothermal heat is calculated for each region of Earth, this figure cannot be estimated.
In summary, there is great uncertainty in the technical potential of all RE sources, particularly when the need for ecosystem maintenance energy is factored into the input energy costs for RE production [53]. It is thus an open question as to whether RE at the global level can even satisfy present global energy needs. Also, as is the case for biomass, many countries and regions will have energy demands exceeding local capacity, so that an international trade in energy will be needed, including shipments of H2 or some other energy carrier derived from surplus intermittent RE electricity. However, the EROI for this imported H2 could be low.
7. Implications for Renewable Energy Accounting
The global energy system is undergoing a historic shift back to RE, after a mere century or so of FF dominance. During the transition to RE as the major energy source, the present energy accounting system, based on most energy being thermal in origin, could continue. Passive solar energy could then be included by calculating the fossil fuel energy saved, as discussed in Section 4 for greenhouses and building passive solar energy use. Eventually, however, thermal energy could become a minor source of energy consumption in nearly all countries. Energy accounting for primary RE electricity should therefore no longer be based on conversion to thermal power station equivalents, as in the BP system [6]. Nor does it seem useful to continue assessing passive solar in terms of FF energy avoided. How should we get a handle on energy use in a RE future?
ExxonMobil [54], in their future energy projections, give a value in EJ for the energy savings from energy efficiency. Lovins [55] has long argued that energy efficiency can give us what he terms ‘negawatts’, although there are doubts about the potential for energy efficiency to save energy, partly because of the rebound effect [56]. By analogy with energy savings from efficiency improvements, savings from passive solar energy and energy conservation could also be treated in this manner. Such savings are vital for the rapid FF reductions needed if the world is to effectively implement climate change mitigation, and need to be part of energy planning. But, just as today, they should not form part of the national or global energy statistics in an energy future based on RE. This virtual energy does not need energy any conversion devices, nor can this virtual energy be imported or exported. The energy savings are always local. Their inclusion or non-inclusion matters, if only because very different answers for energy intensity (measured as GJ per $ GDP) and its trend over time would result.
As discussed in Section 4 and [21], energy accounts need to be as consistent as is possible, although perfect consistency may be impossible. Estimates for domestic consumption of bioenergy (e.g., biogas), all geothermal heat and domestic PV electricity need to be included, even if exact statistics are not available, just as is the case with fuel wood energy. Future RE will consist of four types:
-
Intermittent primary electricity from wind, solar, and perhaps wave energy;
-
Direct primary dispatchable electricity from hydropower;
-
Thermal dispatchable electricity from geothermal, solar, and bioenergy sources;
-
Direct thermal energy from bioenergy and low-temperature geothermal energy.
This entry is adapted from the peer-reviewed paper 10.3390/en12224280
References
- Smil, V. Energy Transitions: History, Requirements, Prospects; Praeger: Santa Barbara, CA, USA, 2010.
- International Energy Agency (IEA). Key World Energy Statistics 2018; IEA/OECD: Paris, France, 2018.
- Fouquet, R. Long-run demand for energy services: Income and price elasticities over two hundred years. Rev. Environ. Econ. Policy 2014, 8, 186–207.
- Organization of the Petroleum Exporting Countries (OPEC). 2018 OPEC World Oil Outlook. 2018. Available online: http://www.opec.org (accessed on 14 June 2019).
- International Energy Agency (IEA). Global Energy and CO2 Status Report; IEA/OECD: Paris, France, 2019.
- BP. BP Statistical Review of World Energy 2019; BP: London, UK, 2019.
- Intergovernmental Panel on Climate Change (IPCC). Climate Change 2014: Synthesis Report; IPCC: Geneva, Switzerland, 2014.
- International Energy Agency (IEA). Sustainable Development Scenario. 2019. Available online: https://www.iea.org/weo/weomodel/sds/ (accessed on 16 August 2019).
- MacMartin, D.G.; Caldeira, K.; Keith, D.W. 2014 Solar geoengineering to limit the rate of temperature change. Phil. Trans. R. Soc. A 2014, 372, 20140134.
- Brandt, A.R.; Masnadi, M.S.; Englander, J.G.; Koomey, J.; Gordon, D. Climate-wise choices in a world of oil abundance. Environ. Res. Lett. 2018, 13, 044027.
- Smith, L.J.; Torn, M.S. Ecological limits to terrestrial biological carbon dioxide removal. Clim. Chang. 2013, 118, 89–103.
- King, L.C.; van den Bergh, J.C.J.M. Implications of net energy-return-on-investment for a low-carbon energy transition. Nat. Energy 2018, 3, 334–340.
- Capellán-Pérez, I.; de Castro, C.; González, L.J.M. Dynamic Energy Return on Energy Investment (EROI) and material requirements in scenarios of global transition to renewable energies. Energy Strategy Rev. 2019, 26, 100399.
- Fuss, S.; Lamb, W.F.; Callaghan, M.W.; Hilaire, J.; Creutzig, F.; Amann, T.; Beringer, T.; De Oliveira Garcia, W.; Hartmann, J.; Khanna, T. Negative emissions—Part 2: Costs, potentials and side effects. Environ. Res. Lett. 2018, 13, 063002.
- Anderson, K. Duality in climate science. Nat. Geosci. 2015, 8, 898–900.
- Anderson, K.; Peters, G. The trouble with negative emissions. Science 2016, 354, 182–183.
- Boysen, L.R.; Lucht, W.; Gerten, D.; Heck, V.; Lenton, T.M.; Schellnhuber, H.J. The limits to global-warming mitigation by terrestrial carbon removal. Earth’s Future 2017, 5, 463–474.
- Irvine, P.J.; Kravitz, B.; Lawrence, M.G.; Muri, H. An overview of the Earth system science of solar geoengineering. WIREs Clim. Chang. 2016, 7, 815–833.
- Prichard, C.; Yang, A.; Holmes, P.; Wilkinson, M. Thermodynamics, economics and systems thinking: What role for air capture of CO2? Process Saf. Environ. Prot. 2015, 94, 188–195.
- International Recommendations for Energy Statistics (IRES). Statistical Papers, Series M No.93, UN, NY, 2017, (ISBP:978-92-1-161584-5). Available online: https://unstats.un.org/unsd/energystats/methodology/documents/IRES-web.pdf (accessed on 18 October 2019).
- Moriarty, P.; Honnery, D. A hydrogen standard for future energy accounting? Int. J. Hydrogen Energy 2010, 35, 12374–12380.
- Raugei, M. Net energy analysis must not compare apples and oranges. Nat. Energy 2019, 4, 86–88.
- Odum, H.T. Emergy evaluation of an OTEC electrical power system. Energy 2000, 25, 389–393.
- Moriarty, P.; Honnery, D. Can renewable energy power the future? Energy Policy 2016, 93, 3–7.
- Intergovernmental Panel on Climate Change (IPCC). Climate Change 2014: Mitigation of Climate Change; IPCC: Geneva, Switzerland, 2014.
- Trainer, T. Some inconvenient theses. Energy Policy 2014, 64, 168–174.
- Wikipedia. Geothermal Energy. 2019. Available online: https://en.wikipedia.org/wiki/Geothermal_energy (accessed on 20 August 2019).
- Erfurt-Cooper, P. The importance of natural geothermal resources in tourism. In Proceedings of the World Geothermal Congress 2010, Bali, Indonesia, 25–29 April 2010.
- Santamouris, M.; Balaras, C.A.; Dascalaki, E.; Vallindra, M. Passive solar agricultural greenhouses: A worldwide classification and evaluation of technologies and systems used for heating purposes. Sol. Energy 1994, 53, 411–426.
- Wikipedia. Greenhouse. 2019. Available online: https://en.wikipedia.org/wiki/Greenhouse (accessed on 20 August 2019).
- Hassanien, R.; Hassanien, E.; Li, M.; Lin, W.D. Advanced applications of solar energy in agricultural greenhouses. Renew. Sustain. Energy Rev. 2016, 54, 989–1001.
- Levermore, G.; Parkinson, J.; Lee, K.; Laycock, P.; Lindley, S. The increasing trend of the urban heat island intensity. Urban Clim. 2018, 24, 360–368.
- Zhang, Z.; Lv, Y.; Pan, H. Cooling and humidifying effect of plant communities in subtropical urban parks. Urban For. Urban Green. 2013, 12, 323–329.
- Xu, X.; Sun, S.; Liu, W.; García, E.H.; He, L.; Cai, Q.; Xu, S.; Wang, J.; Zhu, J. The cooling and energy saving effect of landscape design parameters of urban park in summer: A case of Beijing, China. Energy Build. 2017, 149, 91–100.
- Ürge-Vorsatz, D.; Cabeza, L.F.; Serrano, S.; Barreneche, C.; Petrichenko, K. Heating and cooling energy trends and drivers in buildings. Renew. Sustain. Energy Rev. 2015, 41, 85–98.
- Albayyaa, H.; Hagare, D.; Saha, S. Energy conservation in residential buildings by incorporating Passive Solar and Energy Efficiency Design Strategies and higher thermal mass. Energy Build. 2019, 182, 205–213.
- Le Page, M. Global cooling starts at home. New Sci. 2018, 17, 22–23.
- Omrany, H.; Ghaffarianhoseini, A.; Ghaffarianhoseini, A.; Raahemifar, K.; Tookey, J. Application of passive wall systems for improving the energy efficiency in buildings: A comprehensive review. Renew. Sustain. Energy Rev. 2016, 62, 1252–1269.
- Chan, H.-Y.; Riffat, S.B.; Zhu, J. Review of passive solar heating and cooling technologies. Renew. Sustain. Energy Rev. 2010, 14, 781–789.
- Li, T.; Zhai, Y.; He, S.; Gan, W.; Wei, Z.; Heidarinejad, M.; Dalgo, D.; Mi, R.; Zhao, X.; Song, J.; et al. A radiative cooling structural material. Science 2019, 364, 760–763.
- McKenna, P. Melt buildings to save fuel. New Sci. 2012, 7, 17–18.
- Granqvist, C.G.; Arvizu, M.A.; Pehlivan, I.B.; Qu, H.-Y.; Wen, R.-T.; Niklasson, G.A. Electrochromic materials and devices for energy efficiency and human comfort in buildings: A critical review. Electrochim. Acta 2018, 259, 1170–1182.
- Rodrigues, C.M.; Bio, A.; Amat, F.; Vieira, N. Artisanal salt production in Aveiro/Portugal—An ecofriendly process. Saline Syst. 2011, 7, 3. Available online: http://www.salinesystems.org/content/7/1/3 (accessed on 10 August 2019).
- Wikipedia. Salt. 2019. Available online: https://en.wikipedia.org/wiki/Salt (accessed on 11 August 2019).
- Ranjan, K.R.; Kaushik, S.C.; Panwar, N.L. Energy and exergy analysis of passive solar distillation systems. Int. J. Low Carbon Technol. 2016, 11, 211–221.
- Capellán-Pérez, I.; de Castro, C.; Arto, I. Assessing vulnerabilities and limits in the transition to renewable energies: Land requirements under 100% solar energy scenarios. Renew. Sustain. Energy Rev. 2017, 77, 760–782.
- Iida, S.; Sakata, K. Hydrogen technologies and developments in Japan. Clean Energy 2019, 3, 105–113.
- International Energy Agency (IEA) The Future of Hydrogen. 2019. Available online: https://www.iea.org/hydrogen2019/ (accessed on 3 September 2019).
- Moriarty, P.; Honnery, D. Prospects for hydrogen as a transport fuel. Int. J. Hydrogen Energy 2019, 44, 16029–16037.
- Moriarty, P.; Honnery, D. What is the global potential for renewable energy? Renew. Sustain. Energy Rev. 2012, 16, 244–252.
- Moriarty, P.; Honnery, D. Rise and Fall of the Carbon Civilisation; Springer: London, UK, 2011.
- Bloomster, C.H.; Fassbender, L.L.; McDonald, C.L. Geothermal Energy Potential for District and Process Heating in the US—An Economic Analysis; BNWL-2311, UC-66i; Battelle: Richland, WA, USA, 1977.
- Moriarty, P.; Honnery, D. Ecosystem maintenance energy and the need for a green EROI. Energy Policy 2019, 131, 229–234.
- ExxonMobil. Outlook for Energy: A View to 2040; ExxonMobil: Irving, TX, USA, 2018.
- Lovins, A.B. Negawatts: Twelve transitions, eight improvements and one distraction. Energy Policy 1996, 24, 331–343.
- Moriarty, P.; Honnery, D. Energy efficiency or conservation for mitigating climate change? Energies 2019, 12, 3543.
This entry is offline, you can click here to edit this entry!