Early-stage disease diagnosis is of particular importance for effective patient identification as well as their treatment. Lack of patient compliance for the existing diagnostic methods, however, limits prompt diagnosis, rendering the development of non-invasive diagnostic tools mandatory. One of the most promising non-invasive diagnostic methods that has also attracted great research interest is breath analysis; the method detects gas-analytes such as exhaled volatile organic compounds (VOCs) and inorganic gases that are considered to be important biomarkers for various disease-types. The diagnostic ability of gas-pattern detection using analytical techniques and especially sensors has been widely discussed in the literature; however, the incorporation of novel nanomaterials in sensor-development has also proved to enhance sensor performance, for both selective and cross-reactive applications.
- breath analysis
- volatile organic compounds
- sensors
- nanomaterials
- differential diagnosis
1. Introduction
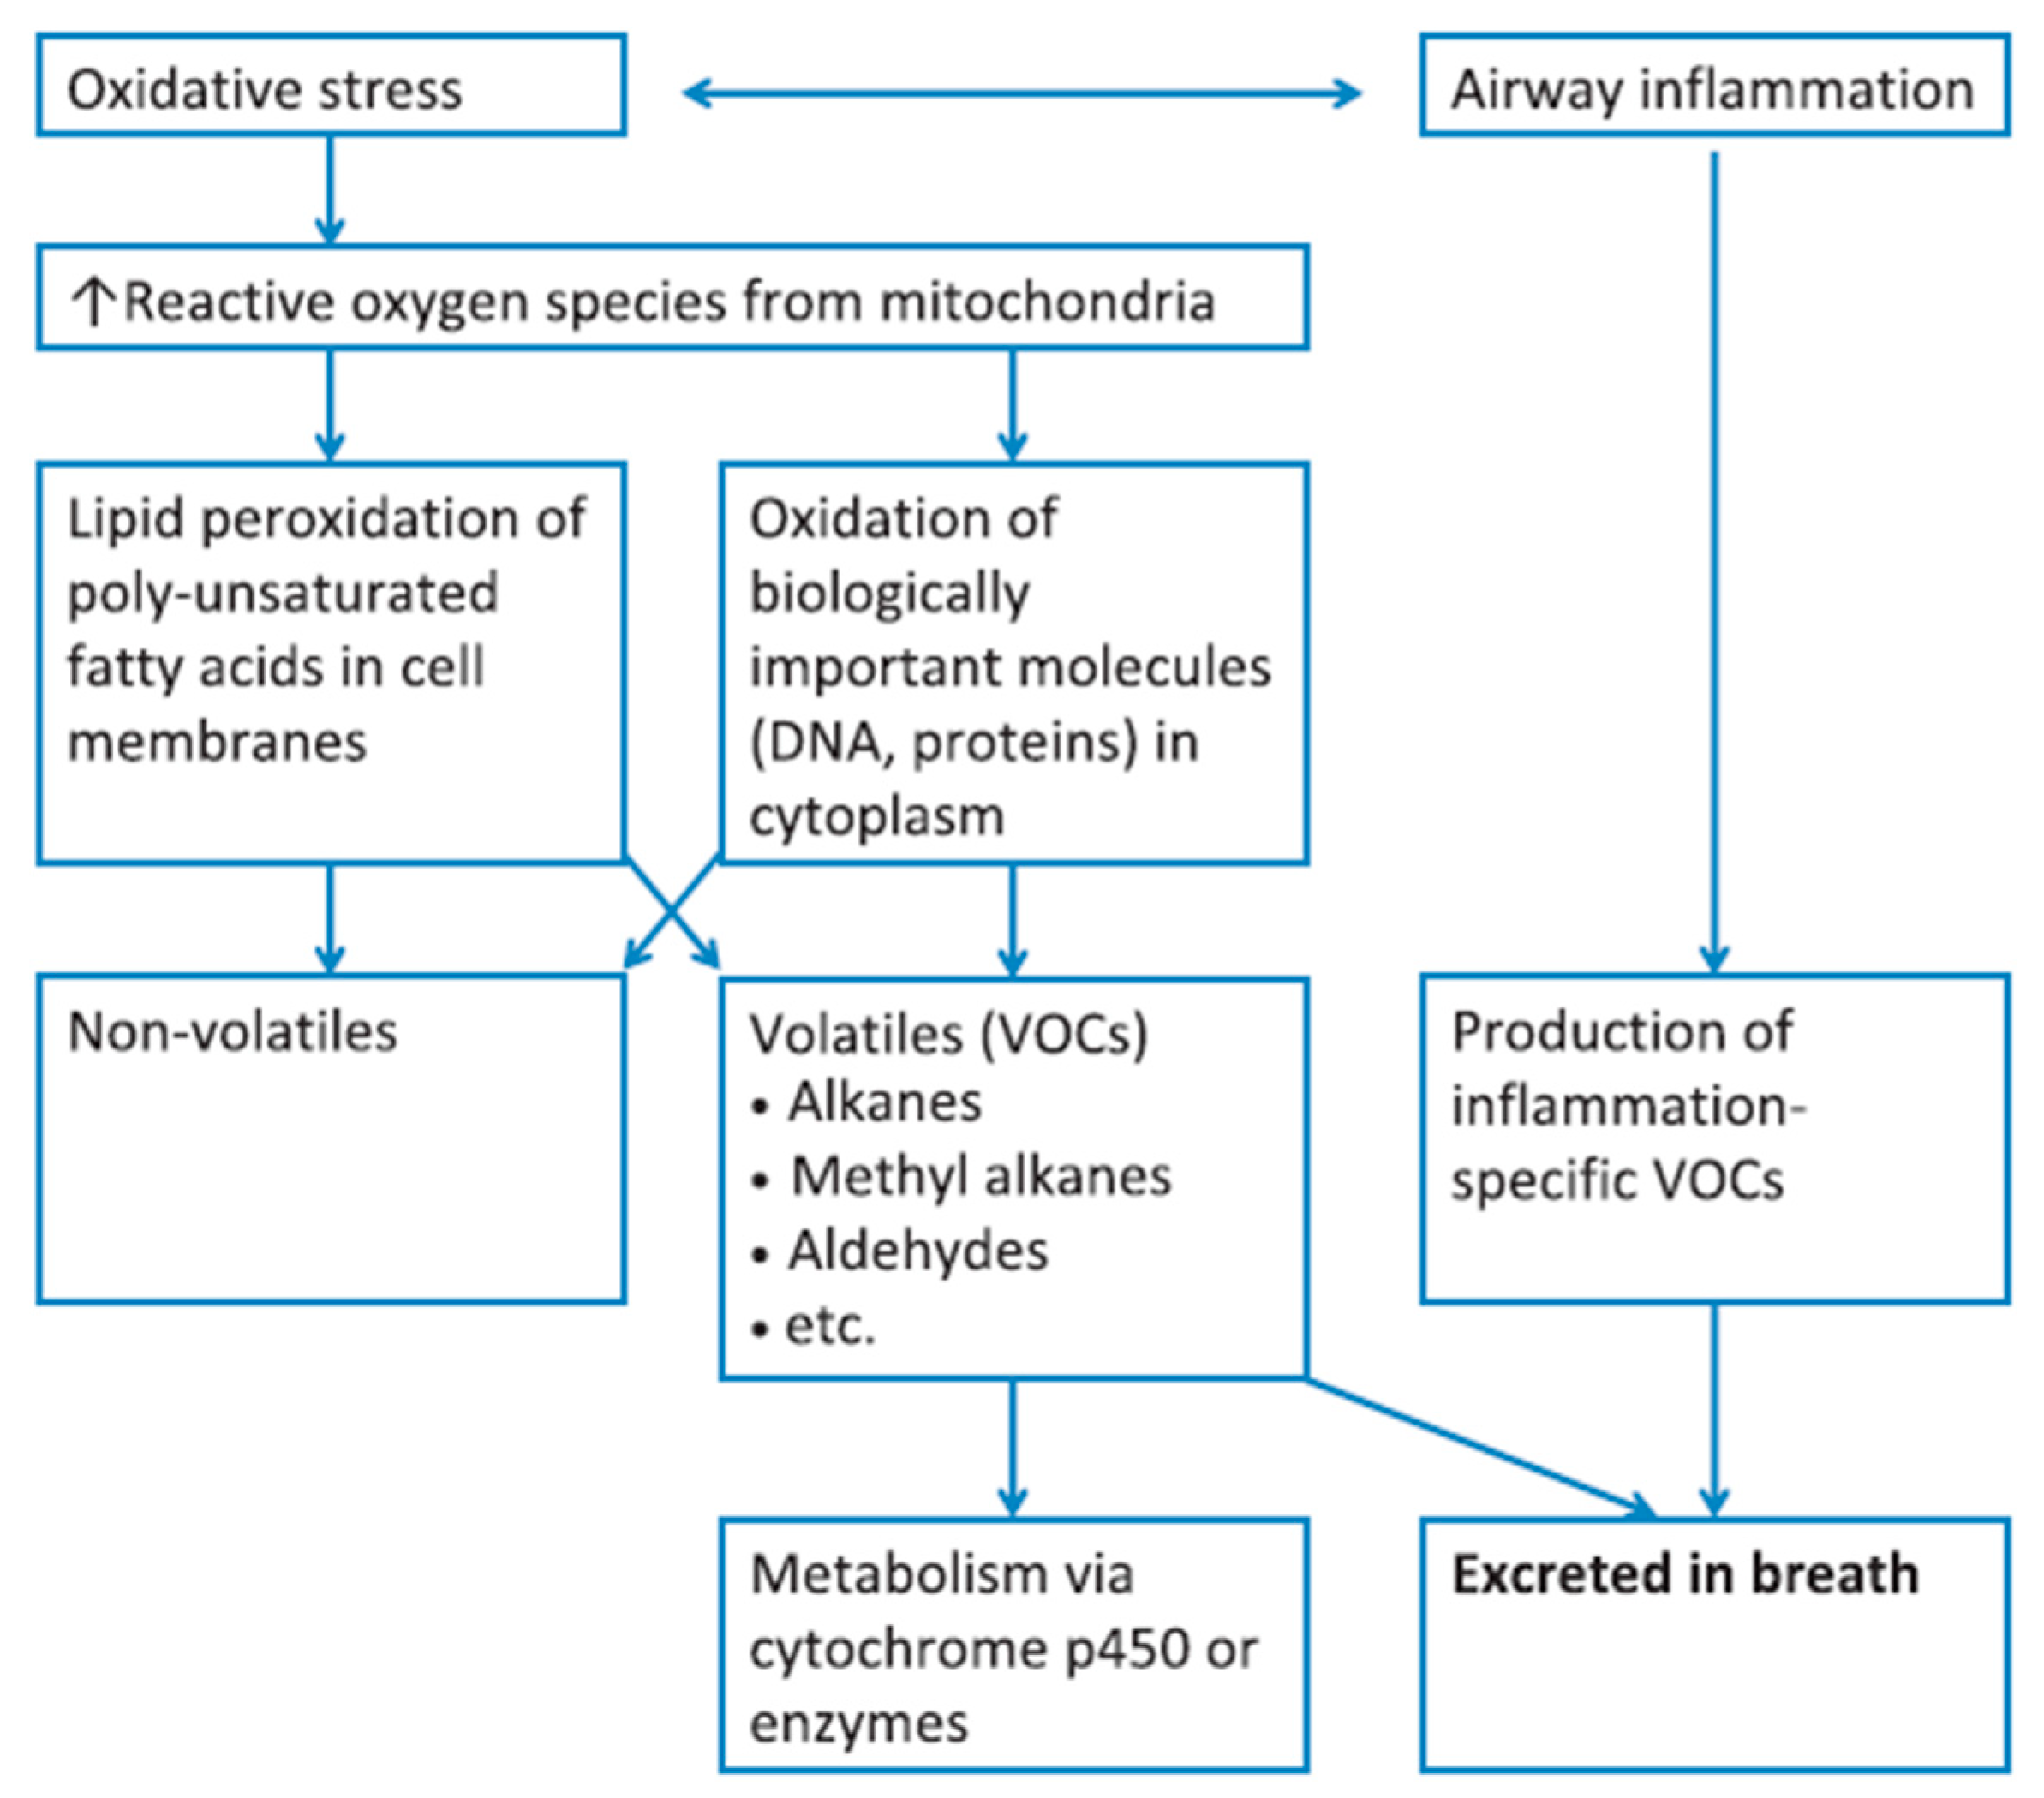 Figure 1. Diagram summarizing the correlation of VOCs present in the exhaled breath, with oxidative stress and inflammatory conditions; metabolic breakdown of larger molecules leads to the formation of exhaled VOCs. Reprinted with permission from ref. [17]. Copyright © 2012 John Wiley & Sons Ltd.
| Disease Type | Diseases | Ref. |
|---|---|---|
| Respiratory | Asthma, COPD, obstructive sleep apnea syndrome, pulmonary arterial hypertension, cystic fibrosis | [19] |
| Malignant | Lung, gastric, head and neck, breast, colon, prostate cancer | [15] |
| Neurodegenerative | Alzheimer’s disease, Parkinson’s diseases, multiple sclerosis | [15] |
| Metabolic | Diabetes, hyperglycemia | [12][31] |
| Bacterial infections | Upper respiratory tract infection, Mycobacterium tuberculosis, Pseudomonas, Helicobacter pylori infection | [32][22] |
| Viral infections | SARS-CoV-2 | [24][25][26] |
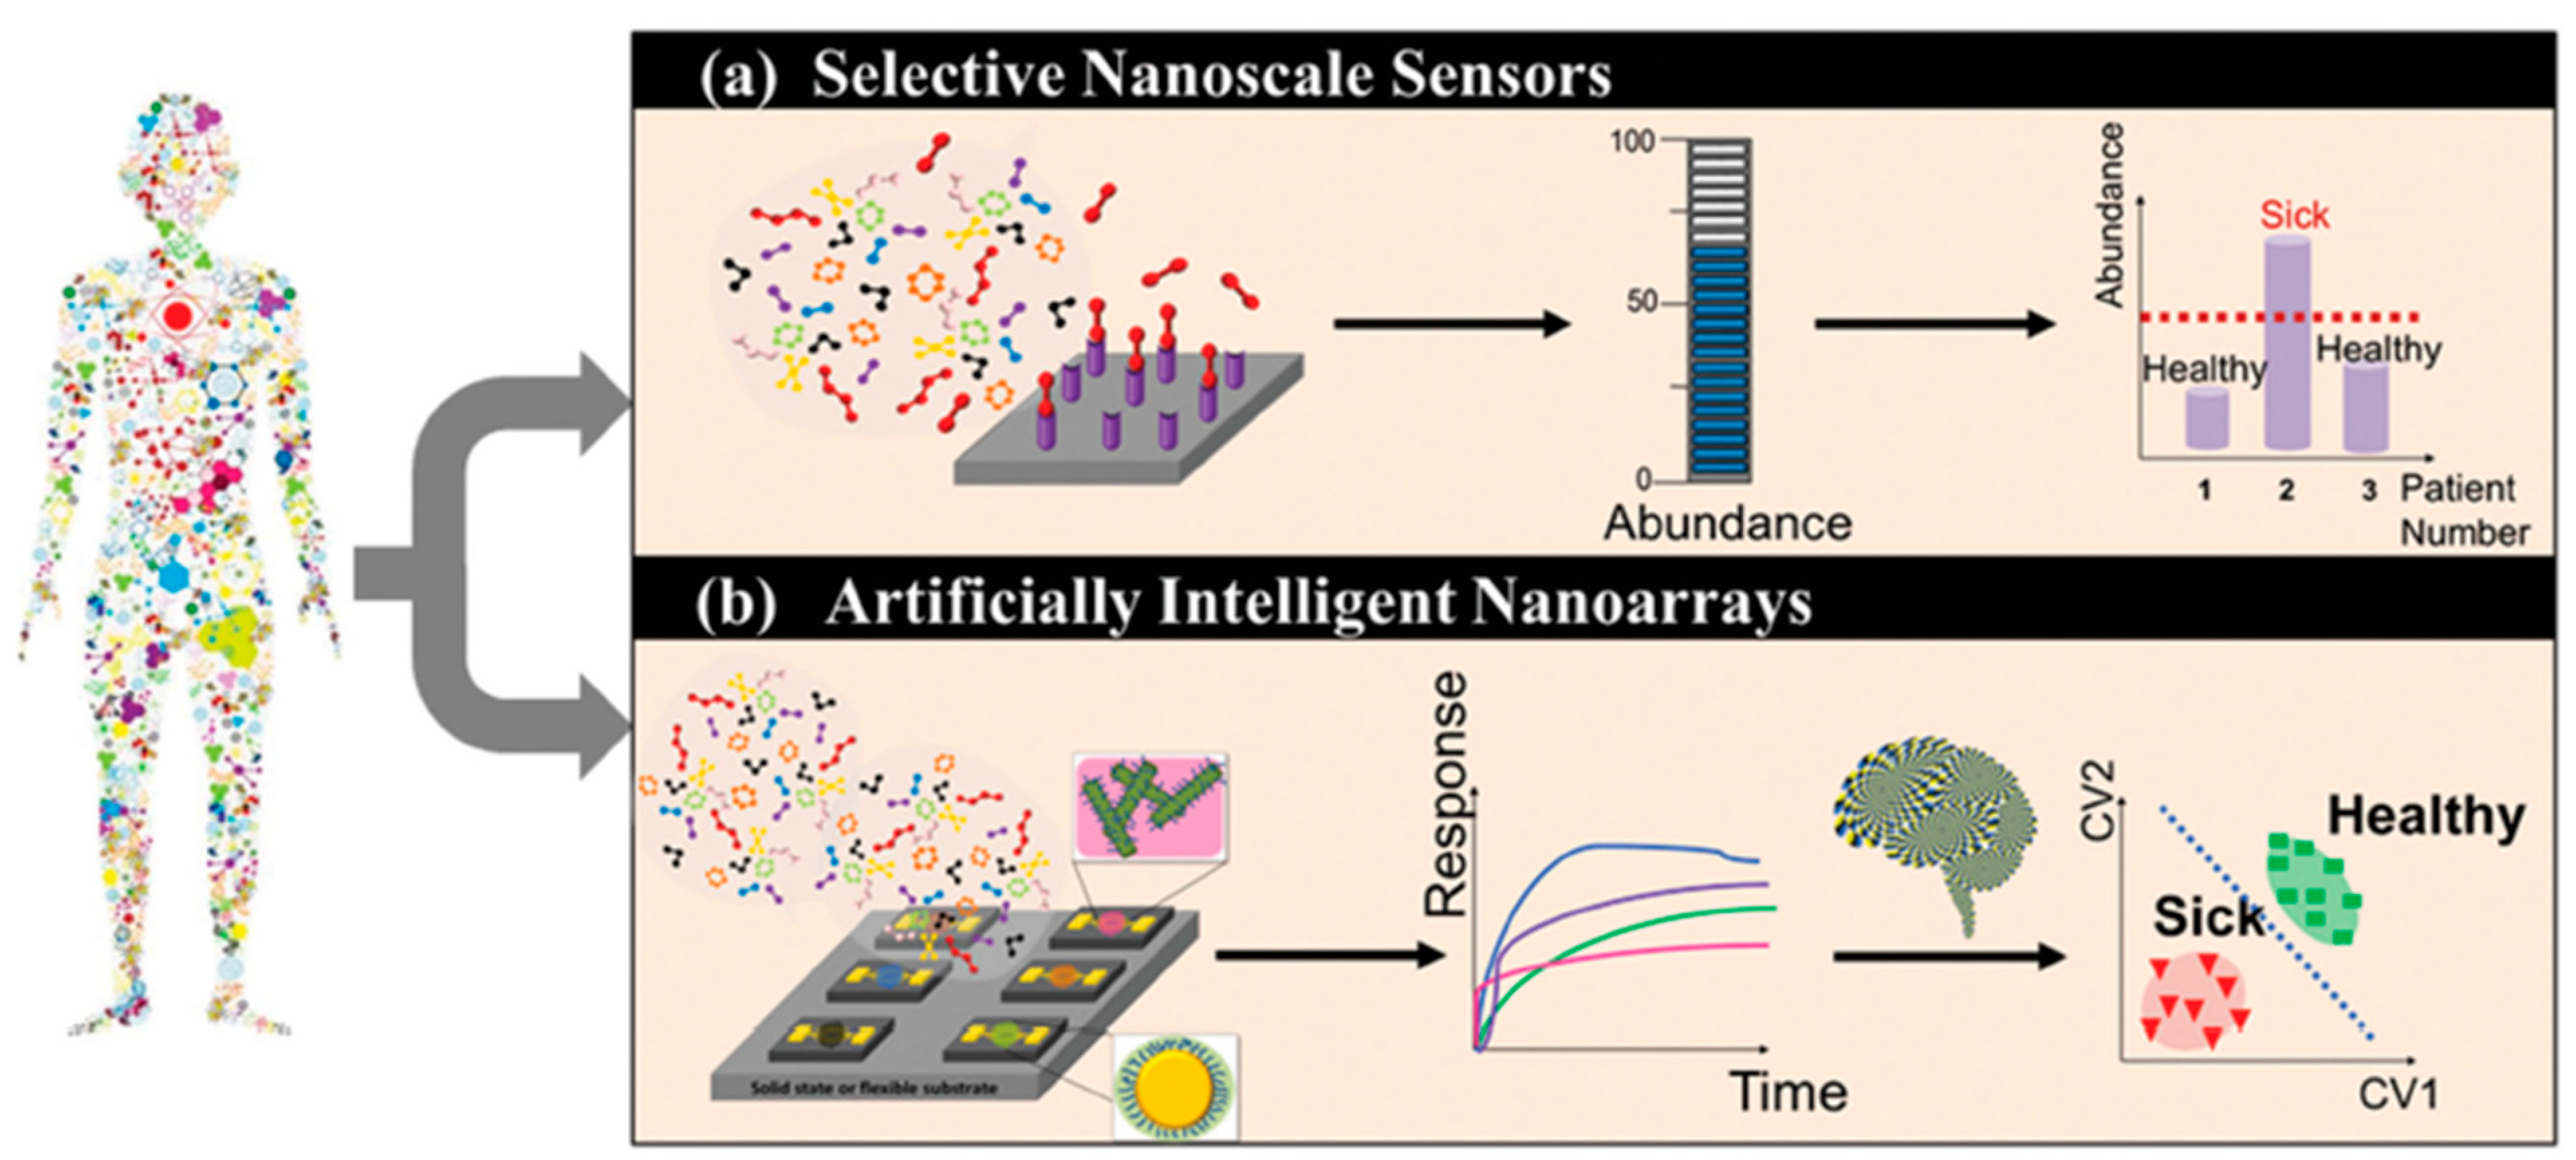 Figure 2. Schematic representation of the working principle of selective sensors and artificially intelligent cross-reactive sensor arrays. Selective sensors contain highly selective elements in order to detect a specific gas-analyte in the presence of a composite gas-mixture. Cross-reactive arrays feature sensors that are sensitive to the majority of the gases present in the gas-mixture. In any case, detecting analyte concentration above a critical value leads to the differentiation between sick and healthy subjects. The response of gas-sensing arrays can be then processed by employing artificial intelligence, machine-learning, and pattern recognition techniques. Reprinted with permission from Ref. [6] Copyright © 2015 Wiley-VCH Verlag GmbH & Co. KGaA, Weinheim.
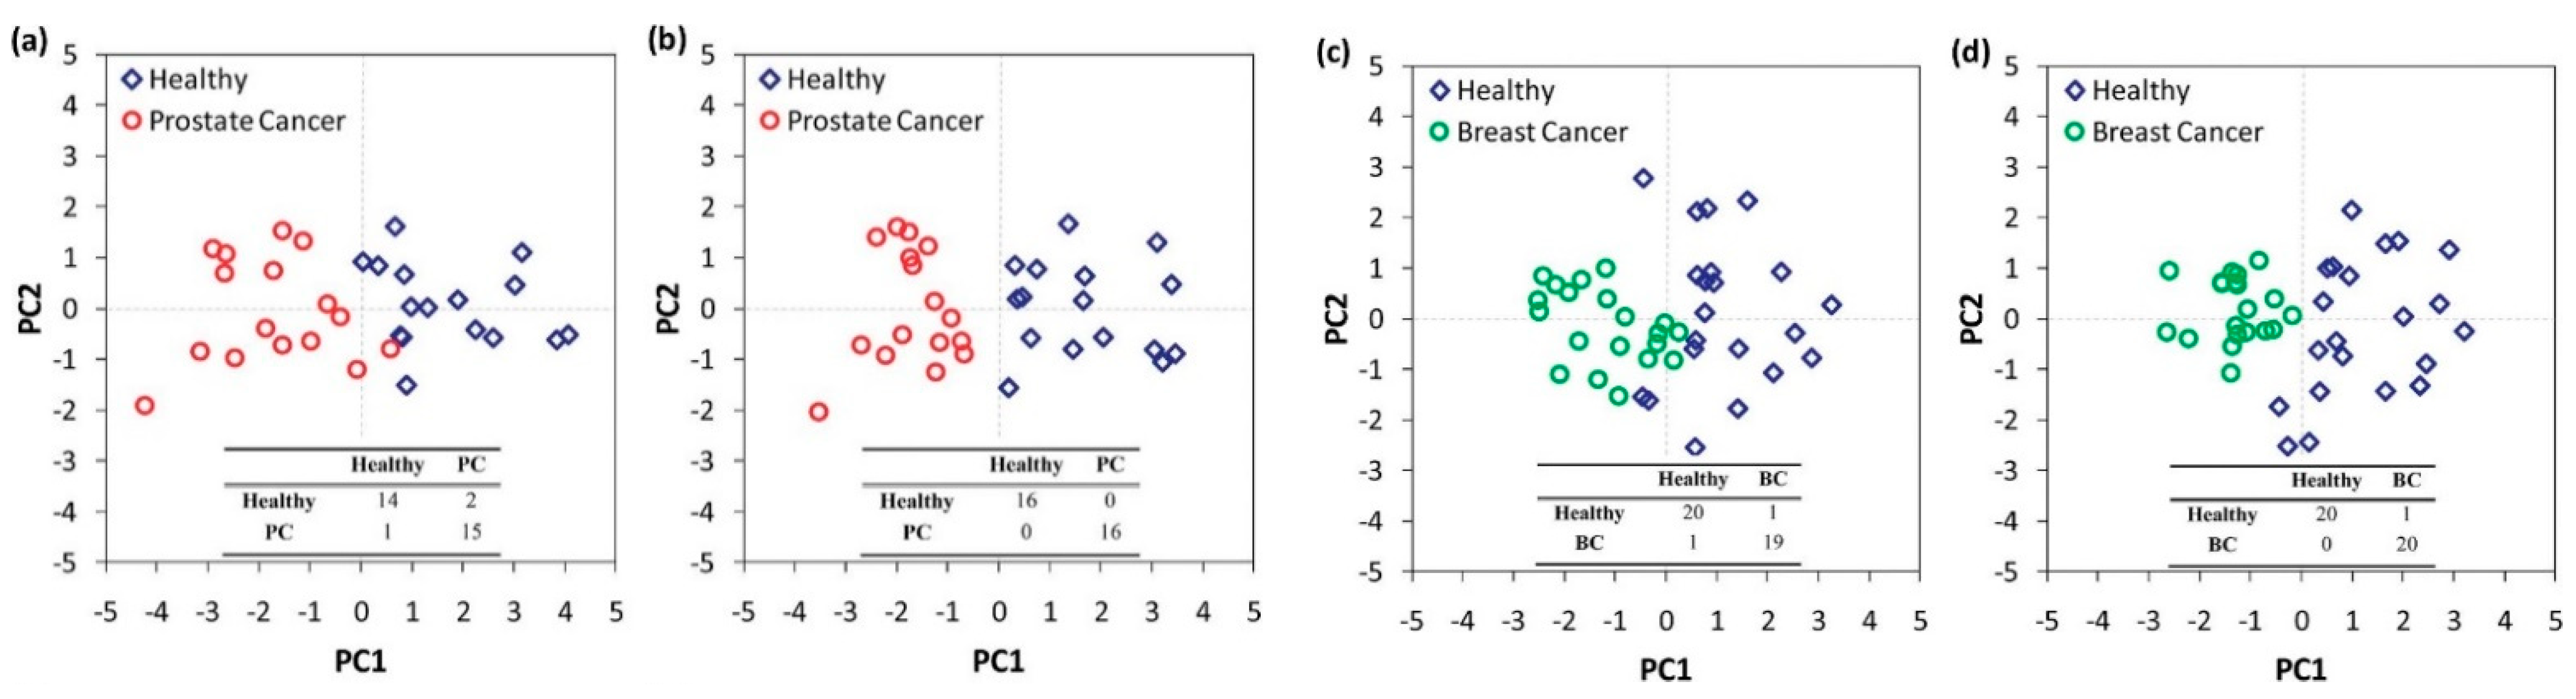 Figure 3. Statistical analysis of the response of a nanomaterial-based, cross-reactive chemiresistor for real-world samples of sick and healthy subjects. The use of PCA permits the differentiation of the groups. Notably, relative humidity compensation reduces the dispersion of different clusters thereby improving the discrimination between healthy and sick subjects. Representative 2D breath-analysis PCA plots for prostate cancer diagnosis: (a) without relative humidity compensation; (b) with relative humidity compensation. PCA plots for breast cancer diagnosis: (c) without relative humidity compensation; (d) with relative humidity compensation. Adapted with permission from Ref. [43] Copyright © 2012, American Chemical Society.
2. Differential Diagnosis and Disease Phenotyping and Staging in Breath Analysis
| Sensing Element | Disease | Targeted VOCs | LOD | Subjects | Classifier | Results | T | Ref. |
|---|---|---|---|---|---|---|---|---|
| In Vivo Studies—Real-World Samples | ||||||||
| Chemiresistor—arrays | ||||||||
| Molecularly capped AuNPs—14 different ligands | Lung cancer | 1-Methyl-4-(1-methyl ethyl) benzene, Toluene, 3,3-Dimethyl pentane, 2,3,4-Trimethyl hexane, Dodecane, 1,1′-1-Butenylidene)bis benzene |
NA | 30 LC, 26 CC, 22 BC, 18 PC, 22 HC | PCA | Good discrimination of cancer types from HC, but not between them. No VOC overlap in abundance between HC and cancer patients. |
RT | [16] |
| Colorectal cancer | 1,1′-(1-Butenylidene)bis benzene, 1,3-Dimethyl benzene, 1-Iodo nonane, (1,1-Dimethylethyl)thio acetic acid, 4-(4-Propylcyclohexyl)-4′-cyano1,1′-biphenyl-4-yl ester benzoic acid, 2-Amino-5-isopropyl-8-methyl-1-azulene carbonitrile |
|||||||
| Breast cancer | 3,3-Dimethyl pentane, 2-Amino-5-isopropyl-8-methyl-1-azulene carbonitrile, 5-(2-Methylpropyl)nonane, 2,3,4-Trimethyl decane, 6-Ethyl-3-octyl ester 2-trifluoromethyl benzoic acid | |||||||
| Prostate cancer | Toluene, 2-Amino-5-isopropyl-8-methyl-1-azulene carbonitrile, 2,2-Dimethyl decane, p-Xylene |
|||||||
| Molecularly capped AuNPs—7 different ligands | Prostate cancer | Toluene, 2-Amino-5-isopropyl-8-methyl-1-azulene carbonitrile, 2,2-Dimethyl decane, p-Xylene |
NA | 9 PC, 10 HC | DFA | 100% specificity, 100% sensitivity | RT | [43] |
| Breast cancer | 3,3-Dimethyl pentane, 2-Amino-5-isopropyl-8-methyl-1-azulene carbonitrile, 5-(2-Methylpropyl)nonane, 2,3,4-Trimethyl decane, 6-Ethyl-3-octyl ester 2-trifluoromethyl benzoic acid | 10 BC, 11 HC | 100% sensitivity, 95% specificity | |||||
| Molecularly capped AuNPs—3 different ligands | Chronic kidney disease | healthy vs. stage 2: Isoprene, Acetone, Styrene, Toluene, 2-Butatone, 2,2,6-Trimethyl octane, 2,4-Dimethyl heptane Stage 2 vs. 3: Isoprene, Acetone, 2,2,6-Trimethyl octane, 2-Butatone, 2,4-Dimethyl heptane Stage 3 vs. 4: Acetone, Ethylene Glycol, Acetoin |
1–5 ppb | 42 CKD, 20 HC | SVM | 79% accuracy early-stage CKD vs. HC 85% accuracy CKD stage 4 vs. stage 5 |
RT | [47] |
| Molecularly capped AuNPs—5 different ligands | Ovarian cancer | Styrene, Nonanal, 2-Ethylhexanol, 3-Heptanone, Decanal, Hexadecane |
ppb level | 17 OV, 26 HC | DFA | 82% accuracy | RT | [45] |
| Molecularly capped AuNPs—8 different ligands | COVID-19 | NA | NA | 49 COVID-19, 33 non-COVID symptomatic, 58 HC |
DFA | 76% accuracy COVID-19 vs. HC 95% accuracy COVID-19 vs. non-COVID symptomatic |
RT | [24] |
| PAH-coated random SWCNTs network—4 different PAHs | Multiple sclerosis | Hexanal, 5-Methyl-undecane | NA | 37 MS, 18 HC | DFA | 80.4% accuracy | RT | [50] |
| Molecularly caped AuNPs/CDs-coated random SWCNTs network—20 different sensing films | Alzheimer’s and Parkinson’s disease | 24 VOCs | 1–5 ppb | 15 AD, 30 PD, 12 HC | DFA | 85% accuracy AD vs. HC 78% accuracy PD vs. HC 84% accuracy AD vs. PD |
RT | [51] |
| Molecularly caped AuNPs/PAH-coated random SWCNTs network—20 different sensing films | 17 diseases (LC, CC, HNC, OC, BLC, PC, KC, GC, CD, UC, IBS, IPD, MS, PDISM, PH, PET, CKD) | 2-Ethylhexanol, 3-Methylhexane, 5-Ethyl-3-methyloctane, Acetone, Ethanol, Ethyl acetate, Ethyl benzene, Isononane, Isoprene, Nonanal, Styrene, Toluene, Undecane |
10 ppb | 813 any of 17 diseases, 591 HC |
DFA, HCA | 86% average accuracy | RT | [52] |
| Ligand capped Au, Pt, and CuNPs—6 different sensing films | Human cutaneous leishmaniasis | 2,2,4-trimethyl pentane, 4-methyl-2-ethyl-1-pentanol, methyl vinyl ketone, nonane, 2,3,5-trimethyl hexane, hydroxy-2,4,6-trimethyl-5-(3-methyl-2 butenyl)cyclohexyl) methyl acetate, 3-ethyl-3-methyl heptane, octane, 2-methyl-6-methylene-octa-1,7-dien-3-ol | NA | 28 HCL, 32 HC | PCA, DFA | 98.2% accuracy, 96.4% sensitivity, 100% specificity | RT | [53] |
| pristine, COOH-, Hex-4T-Hex/DNA/oligomers, PTCDA/TAPC/TCTA monomers or PANI-functionalized SWCNTs | COPD | NH3, NO2, H2S, benzene, 2-propanol, acetone, ethanol, sodium hypochlorite, water | sub-ppb | 12 COPD, 9 HC | PCA | Acetone, ethanol and 2-propanol selective PANI-, TAPC- and COOH-CNTs, respectively. NO2 relevant driver of real-samples classification. Larger clinical trials needed. |
RT | [54] |
| Pristine WO3, 0.008 wt % and 0.042 wt % Pt-WO3 macroporous NFs |
Halitosis | H2S and Methyl mercaptan (in presence of Toluene and Acetone) |
sub-ppm | 4 simulated halitosis breath samples (1 ppm), 4 HC | PCA | Successful classification | 350 °C | [55] |
| 7 different commercial MOS | Lung cancer | Ethyl benzene, 4-Methyl octane, Undecane, 2,3,4-trimethyl hexane |
Down to a few ppb | 37 NSCLC (81.1% I, II), 48 HC |
PCA | 75% accuracy Promising prognostic tool after LC resection surgery |
300 °C | [56] |
| 5 different commercial MOS | Lung cancer, COPD | NA | NA | 32 LC, 38 COPD, 72 HC | PCA, SVM, k-nearest neighbors | LC vs. HC: 91.3% accuracy, 84.4% sensitivity and 94.4% specificity COPD vs. HC: 90.9% accuracy, 81.6% sensitivity and 95.8% specificity |
NA | [57] |
| Field Effect Transistor (FET)—arrays | ||||||||
| Molecularly modified SiNWs | Gastric cancer | 2-Propenenitril, Furfural, 6-Methyl-5-heptene-2-one |
Down to a few ppb | 30 GC, 77 HC | DFA | >85% accuracy | RT | [58] |
| Molecularly modified SiNWs | Gastric cancer | 2-Propenenitril, Furfural, 6-Methyl-5-heptene-2-one |
Down to a few ppb | 149 LC, 40 GC, 56 Asthma/COPD, 129 HC |
DFA, ANN | >80% accuracy | RT | [44] |
| Lung cancer | Heptane, Decane, 2-Methyl pentane, 2-Ethyl-1-hexanol, Propanal, Pentanal, Acetone |
|||||||
| Asthma/COPD | Pentane | |||||||
| Electrochemical sensor | ||||||||
| Commercial NO, CO sensors, carbon electrode with linear-aldehyde selective porous poly tetrafluoroethylene membrane | Diabetes | NO, CO, Formaldehyde, Acrolein, Propanal, Crotonaldehyde, Butanal, Pentanal, Hexanal, Heptanal, Octanal, Nonanal, Decanal, Acetaldehyde | Low ppb | 15 diabetic, 14 HC | LC vs. HC, diabetic vs. HC Cross-sensitivity for aldehyde sensor: Moderate for high level of ethanol and isopropanol/Weak for H2S, NO, methanol, 3-heptanone/None for NO2, propofol, isoprene, or acetone |
RT | [59] | |
| Lung cancer | 3 LC, 3 smokers, 3 HC | |||||||
| Optical—Colorimetric sensor arrays | ||||||||
| 24 chemically reactive colorants | Lung cancer | NA | Low ppm | 92 LC, 137 HC | LPM | Accuracy 81.1% LC vs. HC, 82.5–89% one histology vs. HC, 86.4% ADC vs. SCC |
RT | [60] |
| Optical sensors | ||||||||
| PMTFP-coated optical fiber | Vit. E deficiency | Ethane | pmol/L | 20 HC | NA | NA | RT | [61] |
| Liver diseases, Schizophrenia, Breast cancer, Rheumatoid Arthritis | Pentane | |||||||
| Lung cancer | Heptane, Octane, Decane, Benzene, Toluene, Styrene | |||||||
| Piezoelectric (SAW) sensor arrays | ||||||||
| GC-column/Polyisobutylene-coated SAW, non-coated SAW sensors | Lung cancer | Styrene, Decane, Isoprene, Benzene, Undecane, 1-Hexene, Hexanal, Propyl benzene, Heptanal, 1,2,4-Trimethyl benzene, Methyl cyclopentane | 500 ppb | 20 LC, 15 HC, 7 chronic bronchitis |
ANN | 80% sensitivity and specificity | RT | [6][62] |
| Piezoelectric (QCM) sensor arrays | ||||||||
| 7 different metalloporphyrins |
COPD | NA | NA | 5 COPD per GOLD stage (20), 5 HC | PLS-DA | Fair repeatability of measurements within HC and hypoxemic COPD patients (stage 4) Potential COPD severity assessment |
RT | [63] |
| 8 different metalloporphyrins |
Asthma | NA | NA | 27 asthma, 24 HC | PCA, FNN | 87.5% accuracy | RT | [64] |
| 8 different metalloporphyrins |
Lung cancer | NA | NA | 20 LC, 10 HC | PLS-DA | 85% accuracy LC vs. HC 75% accuracy ADC vs. SCC |
RT | [65] |
| 8 different metalloporphyrins |
Lung cancer | NA | NA | 70 LC, 76 HC | PLS-DA | 81% sensitivity, 100% specificity | RT | [66] |
| 8 different metalloporphyrins |
Tuberculosis | NA | NA | 51 TB (31/51 +HIV), 20 HC | PCA, k-nearest neighbors | 94.1% sensitivity, 90% specificity | RT | [67] |
| 7 different metalloporphyrins |
Halitosis | H2S, Butyric acid, Valeric acid | 10–15 ppb | Oral malodor subjects, HC | PCA | PC1 78% of data variance | 50 °C | [68] |
| 8 different anthocyanins | Asthma | NA | NA | 15 asthma, 27 HC | Factor Analysis | 75% of total variance Repeatability similar to spirometry and eNO |
RT | [69] |
| In vitro studies—Cell lines/Synthetic samples | ||||||||
| Chemiresistor arrays | ||||||||
| CNT-conductive polymer nanocomposites—5 different polymers | Lung cancer | Isopropanol, Tetrahydrofuran, Dichloromethane, Toluene, n-Heptane, Cyclohexane, Methanol, Ethanol, Water | NA | PCA | High sensitivity and selectivity for all the analytes, PC1-PC3 98% of total variance, except the two alkanes |
RT | [70] | |
| Pristine rGO and rGO functionalized with 8 different amine ligands—9 elements | Cancer | Ethanol, 2-Ethylhexanol, Ethyl benzene, Nonanal | 25 ppm | NA | PCA | Successful discrimination of VOCs The LOD and the effect of humidity have to be decreased |
RT | [71] |
| Pristine Pd, ZnO and polypyrrole NWs | Breast cancer | Heptanal | 8.98 ppm | NA | PCA | 73.2% PC1 variance High sensitivity and specificity |
RT | [72] |
| Acetophenone | 798 ppb | |||||||
| 2-Propanol | 129.5 ppm | |||||||
| Isopropyl myristate | 134 ppm | |||||||
| Pristine In2O3 and WO3 NRs, Au, Pt, or Pd NPs-decorated In2O3 and WO3 NRs—8 elements | Diabetes | Acetone | 1.48 ppb | NA | Polar plot | Effective visual discrimination between the gases. Future PCA, DFA, HCA analysis. |
150–300 °C | [73] |
| Asthma | NO2 | 1.9 ppt | ||||||
| Halitosis | H2S | 2.47 ppb | ||||||
| WO3 NTs Pt NPs—WO3 NTs, Pd NPs—WO3 NTs |
Asthma | NO | 50 ppb | NA | NA | NA | 350 °C | [74] |
| Lung cancer | Toluene | 100 ppb | 400 °C | |||||
| Pristine, 0.1% wt GO- and 0.1 wt % thin layered graphite WO3 Hemi tubes | Diabetes | Acetone | 1 ppm | NA | NA | NA | 350 °C | [75] |
| Halitosis | H2S | |||||||
| Electrochemical sensor | ||||||||
| MWCNTs/Au-Ag NPs/GCE | Gastric cancer | 3-Octanone | 0.3 ppb | MGC-803 GC and GES-1 gastric mucosa cell lines | NA | Easy cell line discrimination, high sensitivity, good VOCs selectivity in presence of CO2, acetone and ethanol | RT | [76] |
| Butanone | 0.5 ppb | |||||||
| SiNWs-rGO | Infectious diseases | Cyclohexane, Formaldehyde in presence of Methanol, Ethanol, Acetonitrile, Acetaldehyde and humidity | 1 ppm | NA | Novel electrode platform with increased sensitivity, selectivity and repeatability | [77] | ||
| Piezoelectric (SAW) sensor arrays | ||||||||
| SH-Calix4arene, AuNRs, AgNCs, Calix4arene-AuNRs, Calix4arene-AgNCs |
Lung cancer | Chloroform, Toluene, Isoprene, Acetone, n-Hexane, Ethanol | 1.52–12.34 ppm for CHCl3 1.54–2.64 ppm for toluene |
NA | NA | Sensitivity ↑ for all VOCs Chloroform, toluene: 6–8 times higher sensitivity than individual responses Selectivity ↑: modified AuNRs for CHCl3, modified AgNCs for Toluene |
RT | [78] |
| Pristine or AuNPs-functionalized zeolitic-imidazole-framework nanocrystals (ZIF-8, ZIF-67) | Diabetes | Acetone, Ammonia, Ethanol | acetone 1.1–3.6 ppm, ethanol 0.5–3 ppm NH3 1.6–3.2 ppm |
NA | PCA | Effective discrimination of diabetes biomarkers | RT | [79] |
| Piezoelectric (QCM) sensor arrays | ||||||||
| TiO2-MWCNTS and Cobalt (II) phthalocyanine-silica on Au layers | Diabetes | Acetone | 4.33 ppm | NA | NA | High sensitivity | RT | [80] |
| Asthma | NO | 5.75 ppb | ||||||
| Optical—Colorimetric arrays | ||||||||
| 36 chemically responsive dyes (porphyrin derivatives, NaFluo) | Lung cancer | p-Xylene, Styrene, Isoprene, Hexanal | 50 ppb | NA | HCA, PCA, BPNN | 100% accuracy of kind and concentration discrimination, promising for real-sample experiments | RT | [81] |
| AuNRs-modified metalloporphyrins and pH responsive dyes—36 spots | Lung cancer | Decane, Undecane, Hexanal, Heptanal, 1,2,4-Trimethylbenzene, Benzene | <1 ppm | NA | PCA, HCA | 64.2% accuracy of structurally similar VOCs, 93% photoprotection of metalloporphyrins, ↑ repeatability and long-term stability | RT | [82] |
| Sensor | Diseases/Phenotypes/Stages | Subjects | Classifier | Results | Ref. |
|---|---|---|---|---|---|
| Differential diagnosis | |||||
| Cyranose 320 | NSCLC vs. COPD (GOLD stage I-III) | 10 NSCLC, 10 COPD | PCA, CDA | 85% acc. | [83] |
| LC vs. non-cancer (COPD, asthma, pneumonia, pulmonary embolism, BPN) | 165 LC, 91 non-cancer | SVM | 87.3% acc. | [84] | |
| LC vs. COPD vs. LC/COPD vs. HC | 63 LC, 15 COPD, 79 both, 78 HC | 77.4% acc., 100% accurate LC/COPD classification | |||
| LC vs. non-cancer (COPD, asthma, pneumonia, pulmonary embolism, bronchiectasis, BPN, TB) | 252 LC, 223 non-cancer | LRA | Sens.: 95.8% (S), 96.2% (NS) Spec.: 92.3% (S) 90.6% (NS) |
[85] | |
| Asthma vs. COPD | 20 asthma, 30 COPD | PCA, CDA | 96% acc. Within/between day repeatability, reproducibility of e-Noses |
[86] | |
| Fixed and classic asthma vs. COPD (GOLD stages II-III) | 21 fixed asthma, 40 COPD | PCA, CDA | 88% acc., 85% sens., 90% spec. | [87] | |
| 39 classic asthma, 40 COPD | 83% acc., 91% sens., 90% spec. | ||||
| IPF vs. COPD | 32 IPF, 33 COPD | PCA, CDA | 80% cross-validated acc., Wider patient cohorts and inclusion of more comorbidities needed | [88] | |
| COPD vs. LC vs. BC | 50 COPD, 30 LC, 50 BC | PCA, CDA, CAP | Correct classification values: LC vs. COPD 96.47%, LC vs. BC 93.05%, BC vs. COPD 100%, COPD vs. LC vs. BC 91.35% |
[49] | |
| Bronchial vs. Laryngeal SCC (advanced) | 10 bronchial, 10 laryngeal | JMP Pro | 10% misclassification, 100% sens., 80% spec. | [89] | |
| AD vs. PD vs. HC | 18 AD, 16 PD, 19 HC | LDA | 76.2% sens., 45.8% spec., p < 0.0001 | [90] | |
| AeoNose | ILDs (COP, CTD) vs. COPD, ILDs subgroups (COP, HP, IPF, sarcoidosis, uILD, asbestosis, NSIP, RB-ILD, DIP) |
28 COP, 23 COPD | Athena program, t-test | AUC 0.77, 75% sens., 71% spec. | [91] |
| 25 CTD-ILD, 23 COPD | AUC 0.85, 88% sens., 71% spec. | ||||
| 174 ILDs, 23 COPD | Less accurate discrimination of ILDs subgroups (e.g., AUC IPF vs. CTD-ILD 0.86, COP vs. CTD-ILD 0.82) | ||||
| Asthma vs. CF | 20 asthma (moderate-severe), 13 CF | ANN | AUC 0.90, 89% sens., 77% spec. | [92] | |
| HNSCC vs. LC | 52 HNSCC, 32 LC | ANN | Acc., sens., spec.: 93%, 96%, 88% (best fit), 85%, 85%, 84% (cross-validation) |
[93] | |
| Cancer types | 100 HNSCC, 40 bladder, 28 colon cancer | ANN | Acc., sens., spec.: 81%, 79%, 81% HNSCC vs. colon cancer, 84%, 80%, 86% HNSCC vs. bladder cancer, 84%, 88%, 79% Colon vs. bladder cancer |
[94] | |
| SpiroNose | LC vs. COPD vs. asthma vs. HC | 31 LC, 31 COPD, 37 asthma, 45 HC | PCA | Cross-validation values 78–88%, repeatability ↑ | [95] |
| ILD subgroups: | 141 sarcoidosis, 85 IPF, 33 CTD-ILD, 25 HP, 11 IPAF, 10 NSIP | PLS-DA | Acc., sens., spec.: 77%, 75%, 84% IPF vs. HP, 94%, 98%, 85% IPF vs. CTD-ILD, 92%, 92%, 90% IPF vs. NSIP, 89%, 87%, 100% IPF vs. IPAF, 75%, 100%, 67% CTD-ILD vs. IPAF, 98%, 90%, 100% CTC-ILD vs. NSIP, 90%, 94%, 72% HP vs. sarcoidosis, 91%, 92%, 88% (training), 91%, 95%, 79% (validation) IPF vs. non-IPF |
[96] | |
| Chemiresistor-based alkane sensor |
LC vs. HC LC vs. COPD |
12 LC, 12 COPD, 13 HC | MANOVA | LC: 83.3% sens., 88% spec. Sensor acc no smoke-dependence |
[97] |
| MOS, electrochemical, hot wire, and catalytic | LC vs. COPD | 48 LC, 52 COPD | 8 different | 76.9–84.75% acc., 75–81.36% sens., 78.79–88.14 spec. Highest acc. With KPCA-XGBoost |
[98] |
| LC vs. COPD | 33 LC, 28 COPD | PCA-SVM, KPCA-SVM, PCA-XGBoost, KPCA-XGBoost | 82.52–96% acc., 78.33–95% sens., 85–96.67% spec. Highest acc. With KPCA-XGBoost |
[99] | |
| Organically-coated AuNPs and SWCNTs based chemiresistor | LC (I/II) vs. BPN | 16 LC, 30 BPN | DFA | 87% acc., 75% sens., 93% spec. Low LC sample → careful interpretation |
[100] |
| BC vs. benign | 30 HC, 15 BBT, 13 DCIS, 96 BC | DFA | Acc., sens., spec.: 88.3%, 90.6%, 83.3% BC vs. BBT/HC, 71.2–82%, 62.6–80%, 75.7–82.3% BC vs. BBT, 81.4–84.4%, 83–83.3%, 81–92% BC vs. DCIS |
[101] | |
| Gca vs. OLGIM groups (0-IV) | 99 Gca, 155 OLGIM 0, 136 OLGIM I-II, 34 OLGIM III-IV, 53 PUD | DFA | Acc., sens., spec.: 92%, 73%, 98% Gca vs. 0–IV, 84%, 90%, 80% Gca vs. 0, 87%, 97%, 84% Gca vs. 0–II, 90%, 93%, 80% Gca vs. III-IV, 85%, 93%, 80% Gca vs. I–IV, 87%, 87%, 87% Gca vs. PUD |
[102] | |
| Gca vs. benign gastric conditions | 37 Gca, 32 ulcers, 61 less severe conditions | DFA | 89% sens., 90% spec. 84% sens., 87% spec. |
[103] | |
| ulcer vs. less severe | |||||
| AD vs. PD AD vs. PD vs. HC |
15 AD, 30 PD, 12 HC | DFA | AD vs. PD: 84% acc., 80% sens., 87% spec. Feasible overall discrimination, with large PD/HC overlap |
[51] | |
| NA-NOSE | BC, benign breast conditions, normal mammographs | 11 BC, 14 benign, 7 normal mammographs | PCA/ANOVA/Student’s t-test, SVM | 94% sens., 80% spec. for benign vs. BC and negative mammography, Similar results with both methods | [104] |
| MCNPs-based chemiresistor—6 sensors-array | IBD vs. IBS | 71 IBD (35 UC, 36 CD), 26 IBS | ANN | 81/88% acc., 92/73% sens., 53/100% spec. (real/artificial) | [105] |
| CD vs. UC | 75/96% acc., 75/100% sens., 47/93% spec. (real/artificial) | ||||
| Molecularly modified SiNW FET | Gca vs. LC | 40 Gca, 149 LC, 56 asthma/COPD | DFA, ANN | 92% acc., 93% LC, and 85% Gca correct classification | [44] |
| LC vs. asthma and COPD | 89% acc., 92% sens., 80% spec. | ||||
| MOS gas sensor array | Gca vs. gastric ulcer patients | 49 Gca, 30 gastric ulcer | Back-propagation Neural network | 93% acc., 94.38% sens., 89.93% spec. Classification acc. Of malignant, benign, normal subjects: 92.54%, 93.17%, 92.49%. |
[106] |
| OC vs. benign and HC | 86 OC, 51 benign, 114 HC | PCA, k-NN | Acc., sens., spec.: 85%, 6%, 84% (cross-validation/strict prediction), 87%, 89%, 86% (prediction/strict prediction), 86%, 84%, 85% (cross-validation/most probable pred.), 100%, 100%, 100% (prediction/most probable pred.) |
[107] | |
| AD vs. PD vs. HC | 20 AD, 20 PD, 20 HC | PCA | Effective discrimination of AD vs. PD and HC | [108] | |
| BIONOTE | CLD vs. NC-CLD | 65 CLD, 39 NC-CLD | PLS-DA, radar plot | Successful discrimination, 16 cirrhotic patients misclassified | [109] |
| Commercial (MQ) gas sensors | CKD vs. diabetes vs. HC high creatinine, HC low creatinine | 84 CKD, 24 diabetes, 54 HC high creatinine, 54 HC low creatinine | Radar plots, PCA, SVM, PLS-regression, HCA | PCA: 96.64% of total variance expressed in PC1–3 SVM: 100% correct classification of samples |
[110] |
| Disease histology/phenotyping | |||||
| Tor Vergata e-Nose | SCC vs. ADC | 10 SCC, 10 ADC | PLS-DA | 75% correct classification | [65] |
| 24 colorants | SCC vs. ADC | 22 SCC, 50 ADC | LPM | 86.4% acc. | [60] |
| SCLC vs. NSCLC | 9 SCLC, 83 NSCLC | 78.1% acc. (moderate) | |||
| UV-irradiated pristine, Au, Pt, Au/Pt, Ni, Fe-doped WO3NWs | LC vs. HC | 4 SCLC, 8 SCC, 10 ADC, 12 HC | PCA | 98.6 % acc. | [111] |
| SCLC vs. NSCLC, SCC vs. ADC | DFA | Acc.: 84.5% SCLC vs. NSCLC,77.5% SCC vs. ADC | |||
| Molecularly capped AuNPs and SWCNT based chemiresistors | LC with vs. without EGFR mutation | 19 with EGFR, 34 without EGFR | DFA | 83% acc., 79% sens., 85% spec. | [100] |
| Cyranose 320, Tor Vergata, Common In-vent, Owlstone Lonestar | Clinically stable vs. unstable episodes of asthma | 22 partly controlled persistent asthma | PCA | Correct classification: 95% baseline vs. loss of control, 86% loss of control vs. recovery Owlstone Lonestar the most prominent |
[112] |
| Cyranose 320 | Asthma inflammatory phenotypes | 24 EOS., 10 NEUTR., 18 PAUC. | PCA | Acc., sens., spec.: 73%, 60%, 79% EOS. vs. NEUTR., 74%, 55%, 87% EOS vs. PAUC., 89%, 94%, 80% NEUTR. vs. PAUC. | [113] |
| Uncontrolled asthma-like symptoms | Training set: 65 cluster 1, 22 cluster 2, 34 cluster 3 | one-way ANOVA, Kruskal-Wallis |
Significant differences concerning chest tightness during exercise, dyspnea and gender | [114] | |
| HC and controlled vs. partly controlled and uncontrolled asthma | 10 HC, 9 controlled, 7 partly, 12 uncontrolled | PCA, radar plot | Good predictive ability Cross-validated AUC 0.80, 79% sens., 84% spec. |
[115] | |
| Organically-coated AuNPs and SWCNT-based chemiresistor | BC subtypes | 12 LuminalA, 42 LuminalB, 12 Triple Negative, 16 HER2+, 14 HER2 equivocal | DFA | Acc., sens., spec.: LuminalA vs. others 81.3–87.7%, 75–87.5%, 82.1–87.5% LuminalB vs. others78.1–86.3%, 83.3–85.3%, 74.1–87.2% HER2+ vs. others 81.3–82.4%, 81.3–91%, 80.7–81.3% Triple neg, vs. others 82.9–90.3%, 83.3–93.3%, 82.9–89.4% Luminal vs. non-Luminal 70.8–87.7%, 70.4–88.1%, 71.4–87.1% LuminalA vs. LuminalB 85.7–94%, 75–91.7%, 88.2–95.2% HER2 status/luminal 85.7–100%, 85.7–100%, 83.3–100% HER2 status/non-luminal 90.9%, 90.9%, 90.9% |
[101] |
| Disease staging | |||||
| Tor Vergata e-Nose | LC Stage I vs. II/III/IV | 40 stage I, 18 stage II, 6 III/IV | PLS-DA | Sens.: stage I 90% vs. stage II-IV 57% (+ metabolic diseases), stage I 96% vs. stage II-IV 60% (LC only) |
[66] |
| 24 colorants | LC Stage I/II vs. LC stage III/IV | 41 SCLC, 42 NSCLC | LPM | 79.3 % acc. (moderate) | [60] |
| 11 sensor-array (MOS, electrochemical, hot wire and catalytic) | LC Stage III vs. IV | 44 stage II, 46 stage IV | PCA-SVM, KPCA-SVM, PCA-XGBoost, KPCA-XGBoost | 70.42–82.42% acc., 45–81% sens., 79–95.5% spec. | [99] |
| Organically-coated AuNPs and SWCNTs based chemiresistor | OLGIM stages | 155 OLGIM 0, 136 OLGIM I-II, 34 OLGIM III-IV, 7 Dysplasia | DFA | Acc., sens., spec.: 0-II vs. III-IV and dysplasia 61%, 83%, 60%, 0 vs. I-II 43%, 45%, 41%, 0 vs. III-IV 66%, 90%, 61%, 0 vs. I-IV 50%, 50%, 50%, I-II vs. III-IV 64%, 80%, 60% | [102] |
| GCa I-II vs. III-IV | 17 GCa I-II, 18 GCa III-IV | DFA | 89% sens., 94% spec. | [103] | |
| Molecularly modified SiNW FET | LC staging (I-II vs. III-IV) | 34 early stage, 110 advanced stage | DFA, ANN | 81% acc., 34.5%sens.,95% spec. | [44] |
| GCa staging (I-II vs. III-IV) | 86.5% correct classification, 84.6 early stage, 87.5 advanced | ||||
| Cyranose 320 | Bronchial/Laryngeal in situ vs. advanced |
bronchial: 10 in situ, 10 advanced, laryngeal: 12 in situ, 10 advanced | JMP Pro | 21% misclassification rate, 82% sens., 75% spec. | [89] |
| BIONOTE | Liver cirrhosis (A, B, C Child–Pugh) | NA | PLS-DA | Successful discrimination | [109] |
2.1. The Case for Lung Diseases
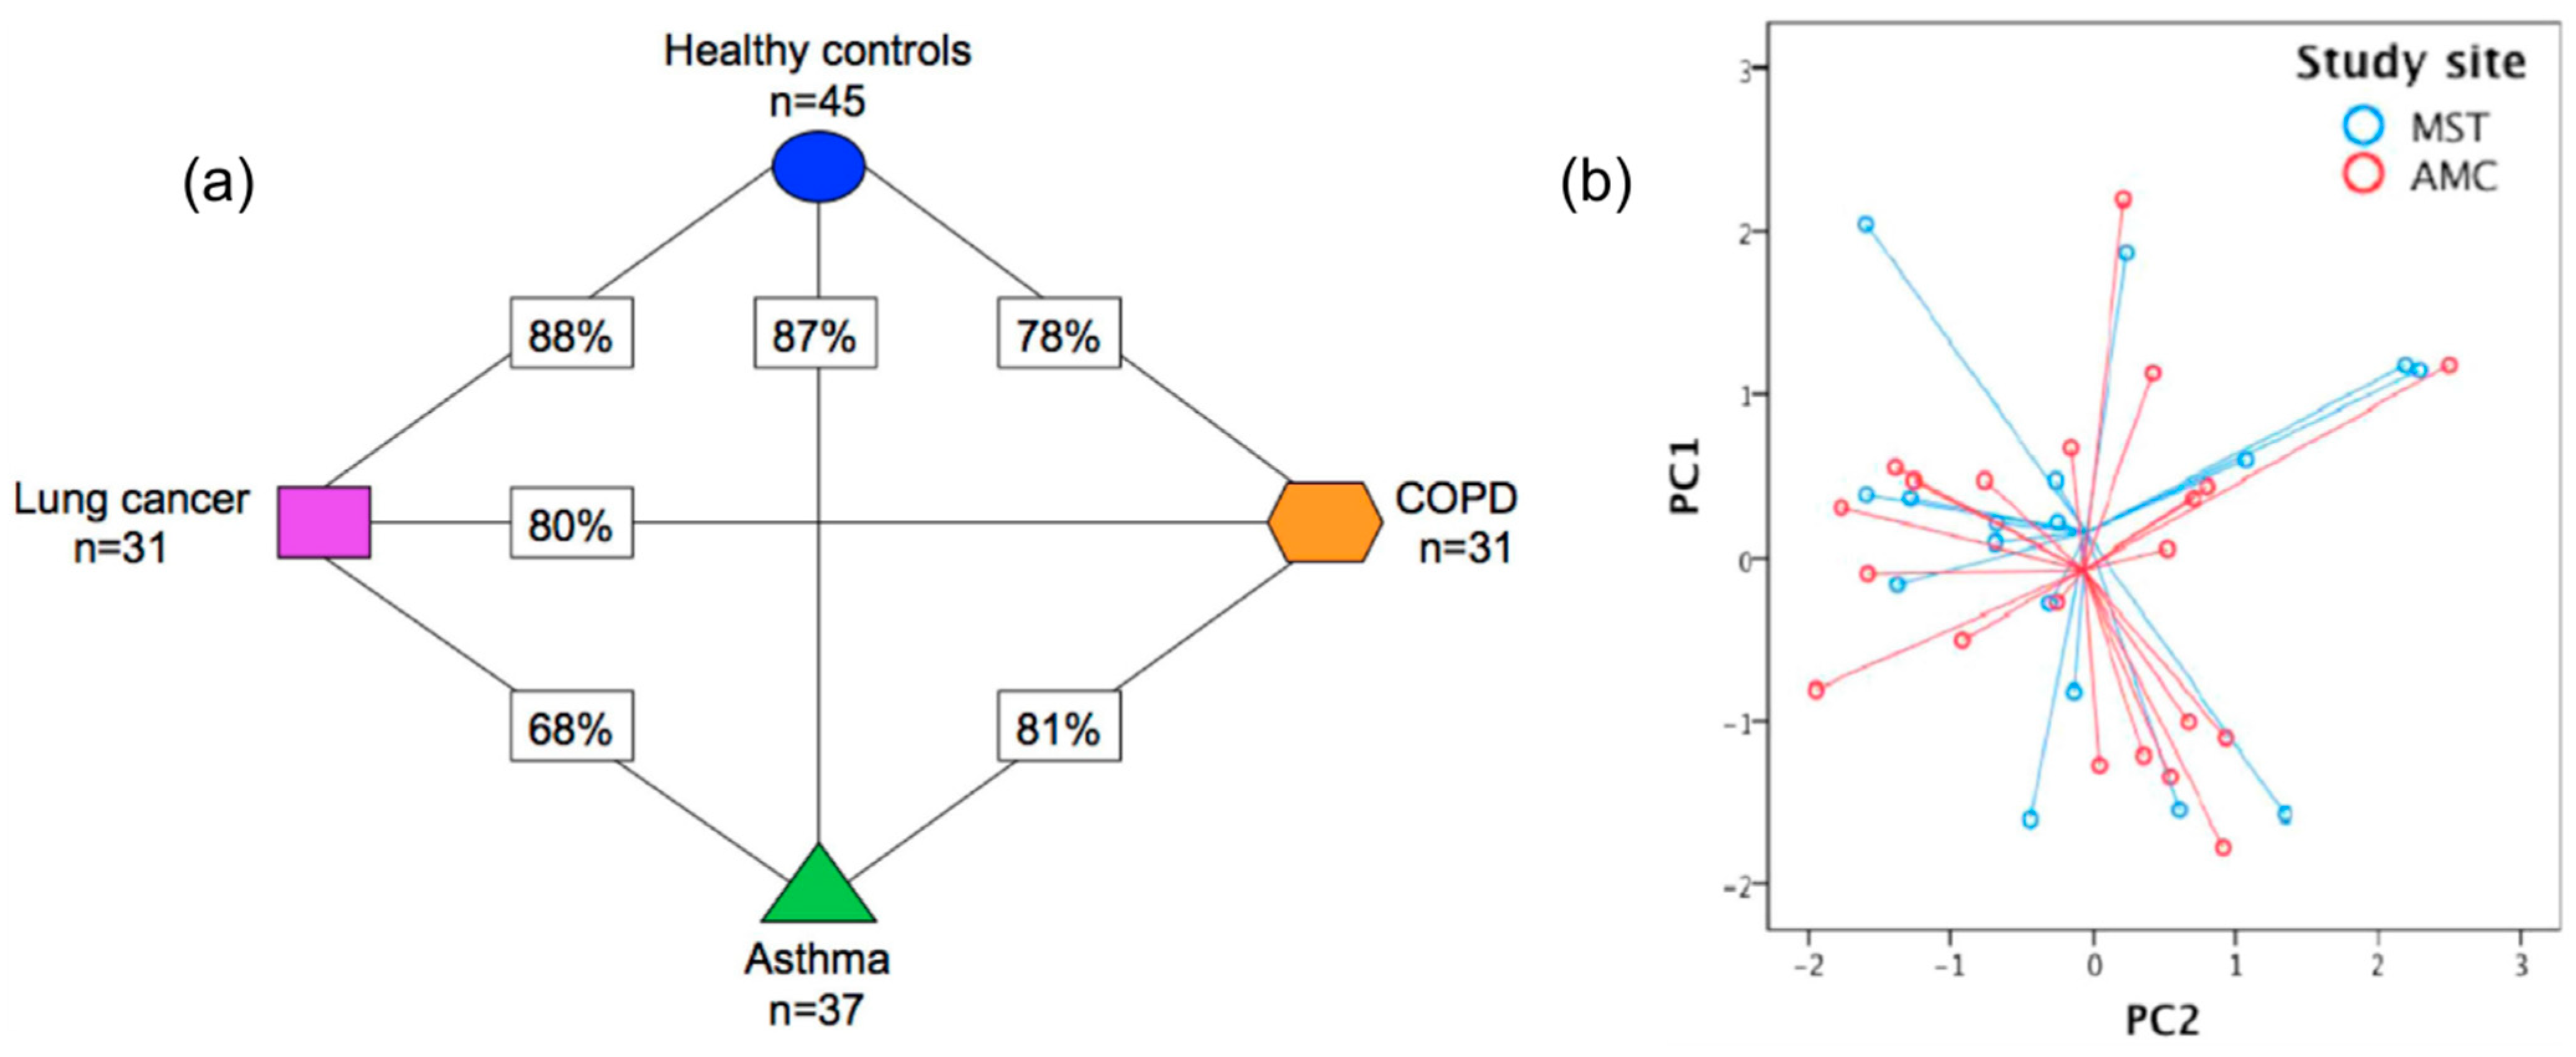 Figure 4. (a) Presentation of the cross-validation percentages of the differentiation of asthma, COPD, LC patients, and HC, using SpiroNose; (b) PCA plot of breathprints collected from asthmatic patients at the Academic Medical Center (AMC), Amsterdam and Medical Spectrum Twente (MST), Enschede, for which no significant differentiation is observed (p = 0.892). Adapted with permission from Ref. [95]. Copyright © 2015 IOP Publishing Ltd.
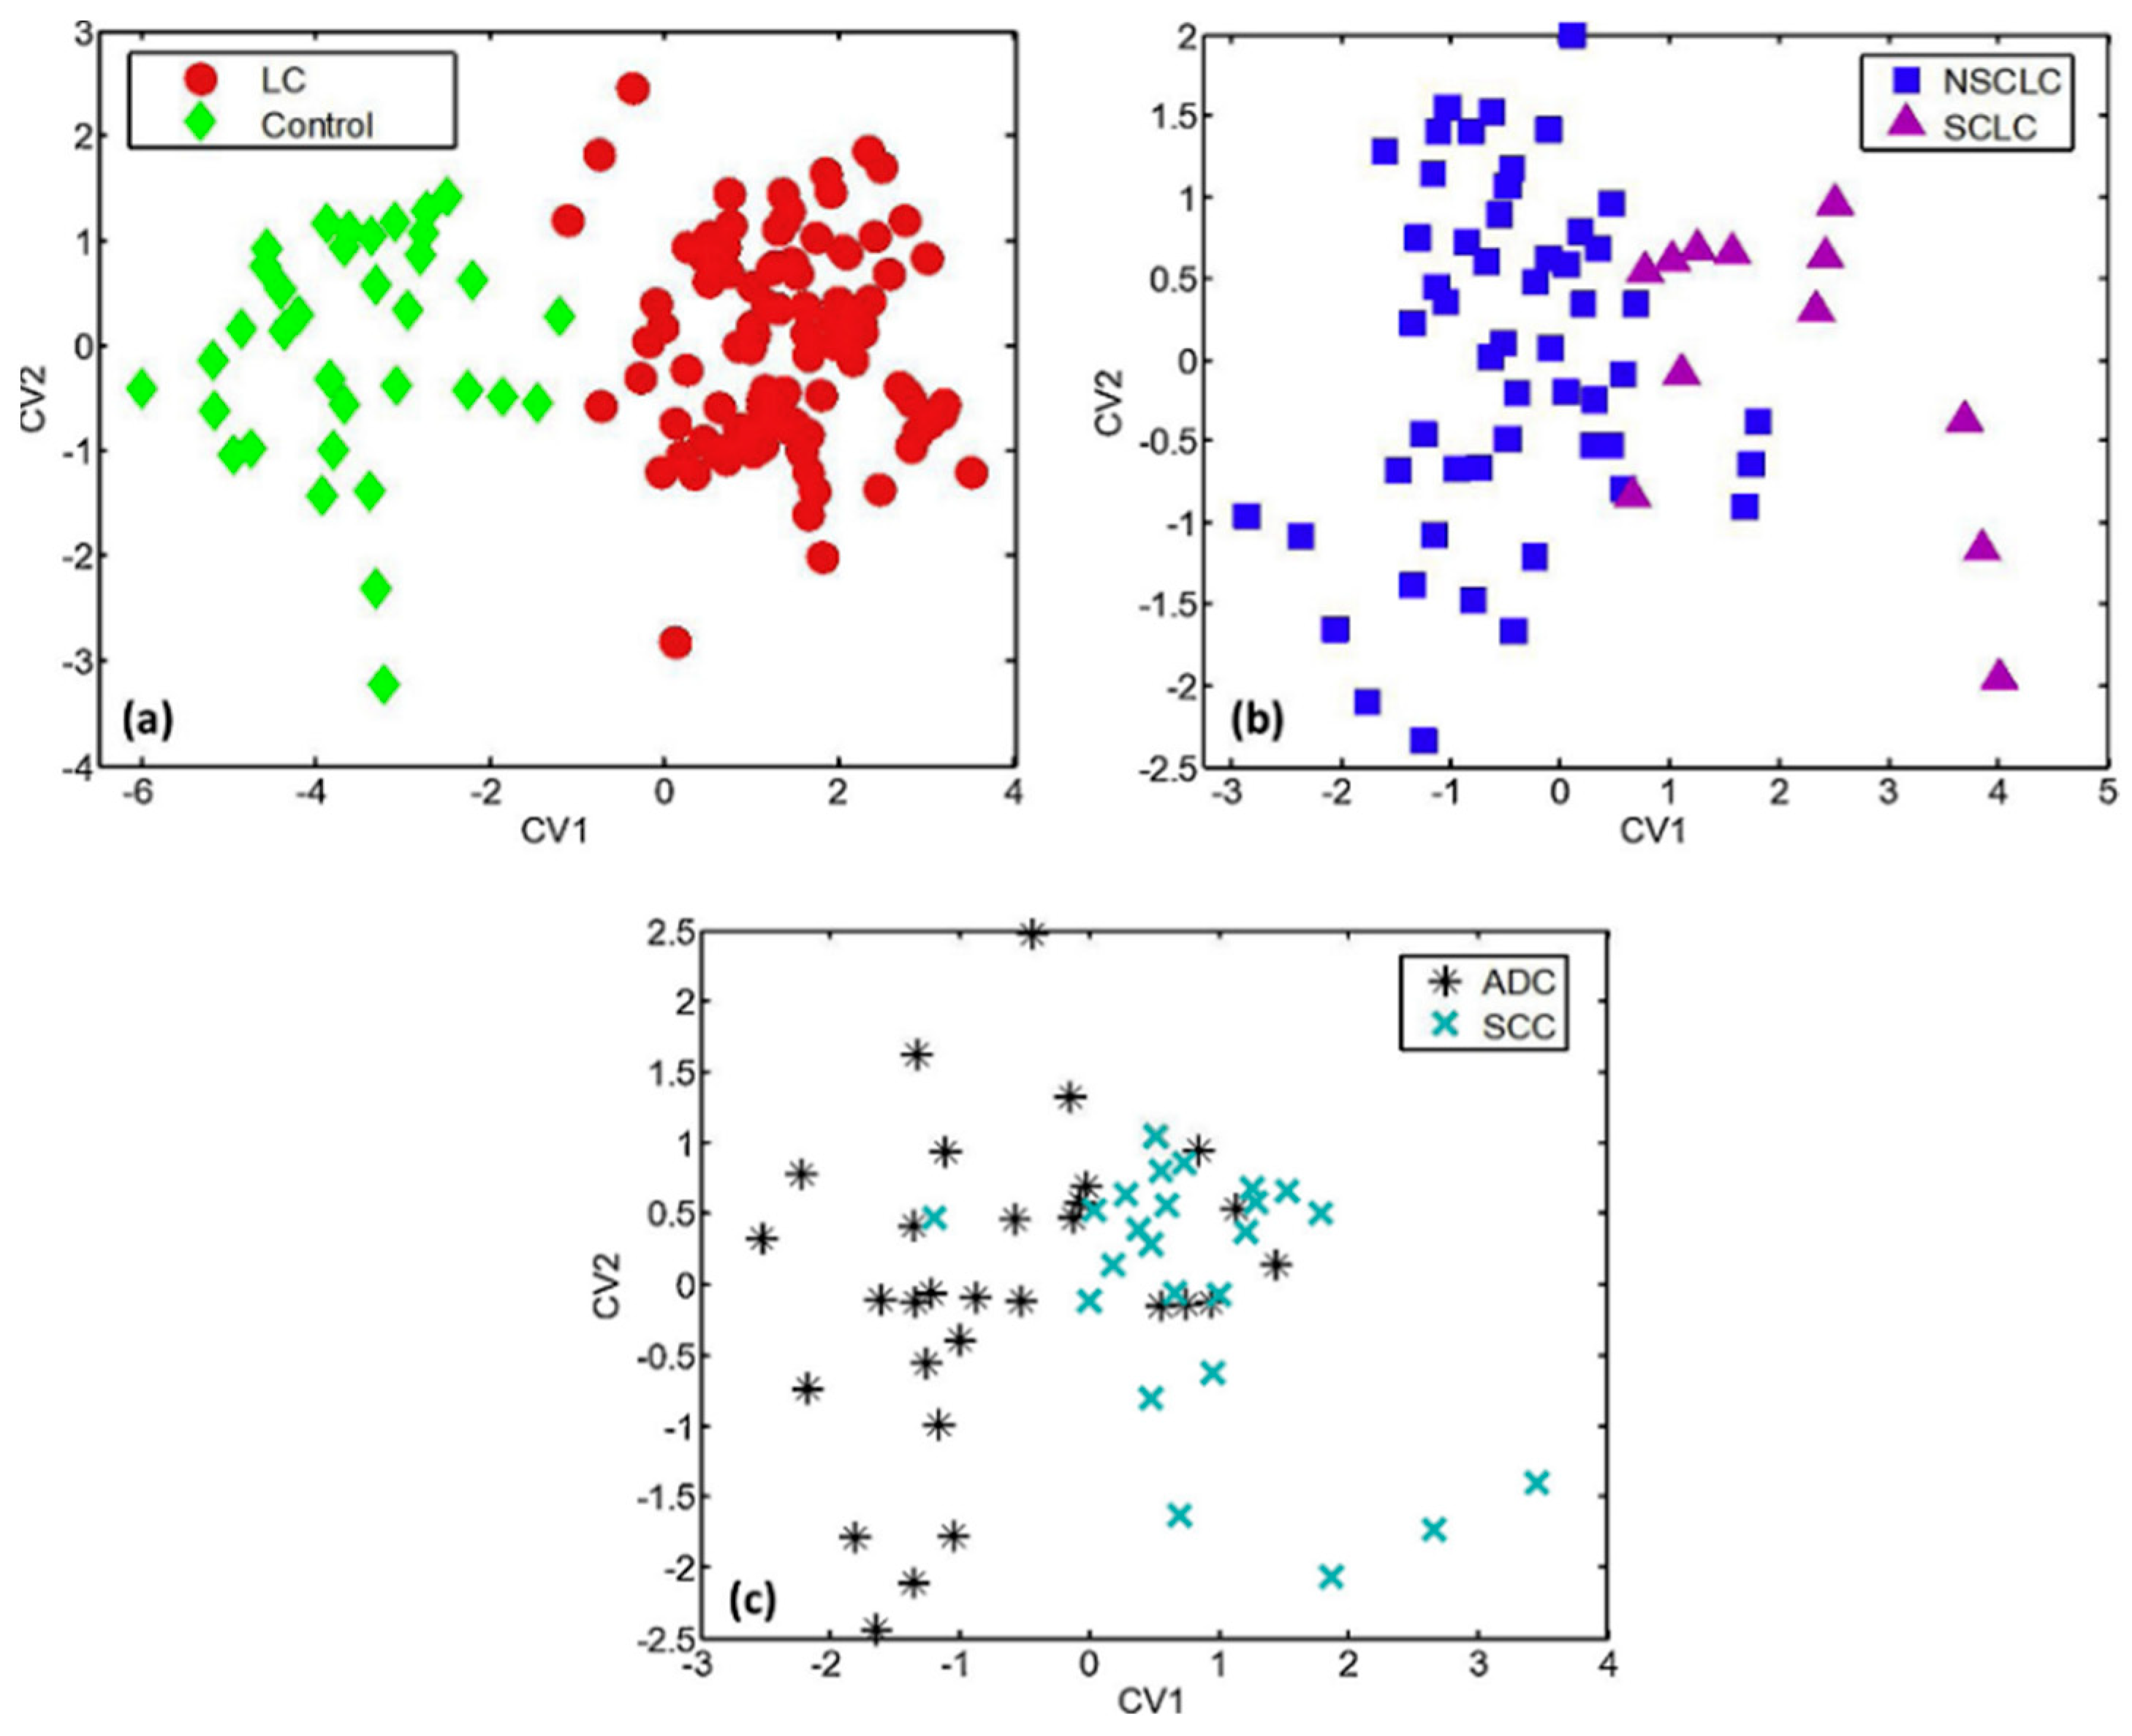 Figure 5. DFA plots representing the discrimination of (a) LC patients from HC; (b) SCLC from NSCLC patients; and (c) SCC from ADC patients, using a 6-sensor array of UV-irradiated (394 nm) pristine or metal-doped WO3NWs. The arrays achieved the detection of lung cancer but also the prediction of LC histological subtypes. Reprinted with permission from Ref. [111]. Copyright © 2020 Published by Elsevier B.V.
2.2. Cancers
2.3. Liver, Renal, and Intestinal Diseases
2.4. Neurodegenerative Diseases
3. Conclusions
This entry is adapted from the peer-reviewed paper 10.3390/s22031238
References
- Chen, T.; Liu, T.; Li, T.; Zhao, H.; Chen, Q. Exhaled breath analysis in disease detection. Clin. Chim. Acta 2021, 515, 61–72.
- Gashimova, E.; Temerdashev, A.; Porkhanov, V.; Polyakov, I.; Perunov, D.; Azaryan, A.; Dmitrieva, E. Investigation of different approaches for exhaled breath and tumor tissue analyses to identify lung cancer biomarkers. Heliyon 2020, 6, e04224.
- Phillips, M.; Cataneo, R.N.; Saunders, C.; Hope, P.; Schmitt, P.; Wai, J. Volatile biomarkers in the breath of women with breast cancer. J. Breath Res. 2010, 4, 026003.
- Oakley-Girvan, I.; Davis, S.W. Breath based volatile organic compounds in the detection of breast, lung, and colorectal cancers: A systematic review. Cancer Biomarkers 2017, 21, 29–39.
- Pite, H.; Morais-Almeida, M.; Rocha, S.M. Metabolomics in asthma: Where do we stand? Curr. Opin. Pulm. Med. 2018, 24, 94–103.
- Vishinkin, R.; Haick, H. Nanoscale Sensor Technologies for Disease Detection via Volatolomics. Small 2015, 11, 6142–6164.
- Broza, Y.Y.; Vishinkin, R.; Barash, O.; Nakhleh, M.K.; Haick, H. Synergy between nanomaterials and volatile organic compounds for non-invasive medical evaluation. Chem. Soc. Rev. 2018, 47, 4781–4859.
- Tisch, U.; Haick, H. Chemical sensors for breath gas analysis: The latest developments at the Breath Analysis Summit 2013. J. Breath Res. 2014, 8, 027103.
- Song, G.; Qin, T.; Liu, H.; Xu, G.B.; Pan, Y.Y.; Xiong, F.X.; Gu, K.S.; Sun, G.P.; Chen, Z.D. Quantitative breath analysis of volatile organic compounds of lung cancer patients. Lung Cancer 2010, 67, 227–231.
- Ma, H.; Li, X.; Chen, J.; Wang, H.; Cheng, T.; Chen, K.; Xu, S. Analysis of human breath samples of lung cancer patients and healthy controls with solid-phase microextraction (SPME) and flow-modulated comprehensive two-dimensional gas chromatography (GC × GC). Anal. Methods 2014, 6, 6841–6849.
- Hakim, M.; Broza, Y.Y.; Barash, O.; Peled, N.; Phillips, M.; Amann, A.; Haick, H. Volatile organic compounds of lung cancer and possible biochemical pathways. Chem. Rev. 2012, 112, 5949–5966.
- Wilson, A.D. Advances in electronic-nose technologies for the detection of volatile biomarker metabolites in the human breath. Metabolites 2015, 5, 140–163.
- Bag, A.; Lee, N.E. Recent Advancements in Development of Wearable Gas Sensors. Adv. Mater. Technol. 2021, 6, 2000883.
- Bos, L.D.; Sterk, P.J.; Fowler, S.J. Breathomics in the setting of asthma and chronic obstructive pulmonary disease. J. Allergy Clin. Immunol. 2016, 138, 970–976.
- Broza, Y.Y.; Haick, H. Nanomaterial-based sensors for detection of disease by volatile organic compounds. Nanomedicine 2013, 8, 785–806.
- Peng, G.; Hakim, M.; Broza, Y.Y.; Billan, S.; Abdah-Bortnyak, R.; Kuten, A.; Tisch, U.; Haick, H. Detection of lung, breast, colorectal, and prostate cancers from exhaled breath using a single array of nanosensors. Br. J. Cancer 2010, 103, 542–551.
- Fens, N.; van der Schee, M.P.; Brinkman, P.; Sterk, P.J. Exhaled breath analysis by electronic nose in airways disease. Established issues and key questions. Clin. Exp. Allergy 2013, 43, 705–715.
- Wang, M.; Sheng, J.; Wu, Q.; Zou, Y.; Hu, Y.; Ying, K.; Wan, H.; Wang, P. Confounding effect of benign pulmonary diseases in selecting volatile organic compounds as markers of lung cancer. J. Breath Res. 2018, 12, 046013.
- Hashoul, D.; Haick, H. Sensors for detecting pulmonary diseases from exhaled breath. Eur. Respir. Rev. 2019, 28, 190011.
- Meyer, N.; Dallinga, J.W.; Nuss, S.J.; Moonen, E.J.C.; van Berkel, J.J.B.N.; Akdis, C.; van Schooten, F.J.; Menz, G. Defining adult asthma endotypes by clinical features and patterns of volatile organic compounds in exhaled air. Respir. Res. 2014, 15, 136.
- Corradi, M.; Poli, D.; Bouza, M. Observation of nonanoic acid and aldehydes in exhaled breath of patients with lung cancer Observation of nonanoic acid and aldehydes in exhaled breath of patients with lung cancer. J. Breath Res. 2017, 11, 26004.
- Boots, A.W.; Van Berkel, J.J.B.N.; Dallinga, J.W.; Smolinska, A.; Wouters, E.F.; Van Schooten, F.J. The versatile use of exhaled volatile organic compounds in human health and disease. J. Breath Res. 2012, 6, 027108.
- Haick, H.; Cohen-Kaminsky, S. Detecting lung infections in breathprints: Empty promise or next generation diagnosis of infections. Eur. Respir. J. 2015, 45, 21–24.
- Shan, B.; Broza, Y.Y.; Li, W.; Wang, Y.; Wu, S.; Liu, Z.; Wang, J.; Gui, S.; Wang, L.; Zhang, Z.; et al. Multiplexed Nanomaterial-Based Sensor Array for Detection of COVID-19 in Exhaled Breath. ACS Nano 2020, 14, 12125–12132.
- Giovannini, G.; Haick, H.; Garoli, D. Detecting COVID-19 from Breath: A Game Changer for a Big Challenge. ACS Sens. 2021, 6, 1408–1417.
- Grassin-Delyle, S.; Roquencourt, C.; Moine, P.; Saffroy, G.; Carn, S.; Heming, N.; Fleuriet, J.; Salvator, H.; Naline, E.; Couderc, L.J.; et al. Metabolomics of exhaled breath in critically ill COVID-19 patients: A pilot study. EBioMedicine 2021, 63, 103154.
- BreFenceTM Go COVID-19 Breath Test System Rapid Breath Test for COVID-19 Detection. Available online: https://secureservercdn.net/160.153.138.177/8g1.9f8.myftpupload.com/wp-content/uploads/2021/05/Breathonix-BreFence-Go-Breath-Test-System.pdf (accessed on 25 November 2021).
- HSA Grants Provisional Authorisation for ‘BreFence Go COVID-19 Breath Test System’ and ‘Traciex Breathalyser’ for Detection of COVID-19 Infection. Available online: https://www.hsa.gov.sg/announcements/regulatory-updates/hsa-grants-provisional-authorisation-for-brefence-go-covid-19-breath-test-system-and-traciex-breathalyser-for-detection-of-covid-19-infection (accessed on 25 November 2021).
- Provisional Authorisation for COVID-19 Tests—Breathonix Pte Ltd. Available online: https://www.hsa.gov.sg/docs/hprg-mdb/breathonix_brefence-go-covid-19-breath-test-system_provisional-authorisation-for-covid-19-tests_19052021.pdf (accessed on 25 November 2021).
- Wang, C.; Sun, B.; Guo, L.; Wang, X.; Ke, C.; Liu, S.; Zhao, W.; Luo, S.; Guo, Z.; Zhang, Y.; et al. Volatile organic metabolites identify patients with breast cancer, cyclomastopathy, and mammary gland fibroma. Sci. Rep. 2014, 4, 5383.
- Pereira, J.; Porto-Figueira, P.; Cavaco, C.; Taunk, K.; Rapole, S.; Dhakne, R.; Nagarajaram, H.; Câmara, J.S. Breath analysis as a potential and non-invasive frontier in disease diagnosis: An overview. Metabolites 2015, 5, 3–55.
- Gaida, A.; Holz, O.; Nell, C.; Schuchardt, S.; Lavae-Mokhtari, B.; Kruse, L.; Boas, U.; Langejuergen, J.; Allers, M.; Zimmermann, S.; et al. A dual center study to compare breath volatile organic compounds from smokers and non-smokers with and without COPD. J. Breath Res. 2016, 10, 026006.
- Neerincx, A.H.; Vijverberg, S.J.H.; Bos, L.D.J.; Brinkman, P.; van der Schee, M.P.; de Vries, R.; Sterk, P.J.; Maitland-van der Zee, A.H. Breathomics from exhaled volatile organic compounds in pediatric asthma. Pediatr. Pulmonol. 2017, 52, 1616–1627.
- Amal, H.; Haick, H. Point of care breath analysis systems. In Advanced Nanomaterials for Inexpensive Gas Microsensors: Synthesis, Integration and Applications, 1st ed.; Llobet, E., Ed.; Elsevier Inc.: Amsterdam, The Netherlands; Oxford, UK; Cambridge, MA, USA, 2019; pp. 315–334.
- Basanta, M.; Jarvis, R.M.; Xu, Y.; Blackburn, G.; Tal-Singer, R.; Woodcock, A.; Singh, D.; Goodacre, R.; Paul Thomas, C.L.; Fowler, S.J. Non-invasive metabolomic analysis of breath using differential mobility spectrometry in patients with chronic obstructive pulmonary disease and healthy smokers. Analyst 2010, 135, 315–320.
- Zhou, X.; Xue, Z.; Chen, X.; Huang, C.; Bai, W.; Lu, Z.; Wang, T. Nanomaterial-based gas sensors used for breath diagnosis. J. Mater. Chem. B 2020, 8, 3231–3248.
- Ratiu, I.A.; Ligor, T.; Bocos-Bintintan, V.; Mayhew, C.A.; Buszewski, B. Volatile Organic Compounds in Exhaled Breath as Fingerprints of Lung Cancer, Asthma and COPD. J. Clin. Med. 2020, 10, 32.
- Oliveira, Luciana Fontes de; Mallafré-Muro, Celia; Giner, Jordi; Perea, Lidia; Sibila, Oriol; Pardo, Antonio; Marco, Santiago; Breath analysis using electronic nose and gas chromatography-mass spectrometry: A pilot study on bronchial infections in bronchiectasis. Clinica Chimica Acta 2021, 526, 6-13, .
- Tisch, U.; Haick, H. Nanomaterials for cross-reactive sensor arrays. MRS Bull. 2010, 35, 797–803.
- Van Der Schee, M.P.; Fens, N.; Brinkman, P.; Bos, L.D.J.; Angelo, M.D.; Nijsen, T.M.E.; Raabe, R.; Knobel, H.H.; Vink, T.J.; Sterk, P.J. Effect of transportation and storage using sorbent tubes of exhaled breath samples on diagnostic accuracy of electronic nose analysis. J. Breath Res. 2013, 7, 016002.
- Behera, B.; Joshi, R.; Anil Vishnu, G.K.; Bhalerao, S.; Pandya, H.J. Electronic nose: A non-invasive technology for breath analysis of diabetes and lung cancer patients. J. Breath Res. 2019, 13, 24001.
- Madianos, L.; Skotadis, E.; Patsiouras, L.; Filippidou, M.K.; Chatzandroulis, S.; Tsoukalas, D. Nanoparticle based gas-sensing array for pesticide detection. J. Environ. Chem. Eng. 2018, 6, 6641–6646.
- Konvalina, G.; Haick, H. Effect of humidity on nanoparticle-based chemiresistors: A comparison between synthetic and real-world samples. ACS Appl. Mater. Interfaces 2012, 4, 317–325.
- Shehada, N.; Cancilla, J.C.; Torrecilla, J.S.; Pariente, E.S.; Brönstrup, G.; Christiansen, S.; Johnson, D.W.; Leja, M.; Davies, M.P.A.; Liran, O.; et al. Silicon Nanowire Sensors Enable Diagnosis of Patients via Exhaled Breath. ACS Nano 2016, 10, 7047–7057.
- Kahn, N.; Lavie, O.; Paz, M.; Segev, Y.; Haick, H. Dynamic Nanoparticle-Based Flexible Sensors: Diagnosis of Ovarian Carcinoma from Exhaled Breath. Nano Lett. 2015, 15, 7023–7028.
- Phillips, C.O.; Syed, Y.; Parthaláin, N.M.; Zwiggelaar, R.; Claypole, T.C.; Lewis, K.E. Machine learning methods on exhaled volatile organic compounds for distinguishing COPD patients from healthy controls. J. Breath Res. 2012, 6, 036003.
- Marom, O.; Nakhoul, F.; Tisch, U.; Shiban, A.; Abassi, Z.; Haick, H. Gold nanoparticle sensors for detecting chronic kidney disease and disease progression. Nanomedicine 2012, 7, 639–650.
- Koureas, M.; Kirgou, P.; Amoutzias, G.; Hadjichristodoulou, C.; Gourgoulianis, K.; Tsakalof, A. Target analysis of volatile organic compounds in exhaled breath for lung cancer discrimination from other pulmonary diseases and healthy persons. Metabolites 2020, 10, 317.
- Rodríguez-Aguilar, M.; Díaz de León-Martínez, L.; Gorocica-Rosete, P.; Pérez-Padilla, R.; Domínguez-Reyes, C.A.; Tenorio-Torres, J.A.; Ornelas-Rebolledo, O.; Mehta, G.; Zamora-Mendoza, B.N.; Flores-Ramírez, R. Application of chemoresistive gas sensors and chemometric analysis to differentiate the fingerprints of global volatile organic compounds from diseases. Preliminary results of COPD, lung cancer and breast cancer. Clin. Chim. Acta 2021, 518, 83–92.
- Ionescu, R.; Broza, Y.; Shaltieli, H.; Sadeh, D.; Zilberman, Y.; Feng, X.; Glass-Marmor, L.; Lejbkowicz, I.; Müllen, K.; Miller, A.; et al. Detection of multiple sclerosis from exhaled breath using bilayers of polycyclic aromatic hydrocarbons and single-wall carbon nanotubes. ACS Chem. Neurosci. 2011, 2, 687–693.
- Tisch, U.; Schlesinger, I.; Ionescu, R.; Nassar, M.; Axelrod, N.; Robertman, D.; Tessler, Y.; Azar, F.; Marmur, A.; Aharon-Peretz, J.; et al. Detection of Alzheimer’s and Parkinson’s disease from exhaled breath using nanomaterial-based sensors. Nanomedicine 2013, 8, 43–56.
- Nakhleh, M.K.; Amal, H.; Jeries, R.; Broza, Y.Y.; Aboud, M.; Gharra, A.; Ivgi, H.; Khatib, S.; Badarneh, S.; Har-Shai, L.; et al. Diagnosis and Classification of 17 Diseases from 1404 Subjects via Pattern Analysis of Exhaled Molecules. ACS Nano 2017, 11, 112–125.
- Welearegay, T.G.; Diouani, M.F.; Österlund, L.; Ionescu, F.; Belgacem, K.; Smadhi, H.; Khaled, S.; Kidar, A.; Cindemir, U.; Laouini, D.; et al. Ligand-Capped Ultrapure Metal Nanoparticle Sensors for the Detection of Cutaneous Leishmaniasis Disease in Exhaled Breath. ACS Sens. 2018, 3, 2532–2540.
- Freddi, S.; Emelianov, A.V.; Bobrinetskiy, I.I.; Drera, G.; Pagliara, S.; Kopylova, D.S.; Chiesa, M.; Santini, G.; Mores, N.; Moscato, U.; et al. Development of a Sensing Array for Human Breath Analysis Based on SWCNT Layers Functionalized with Semiconductor Organic Molecules. Adv. Healthc. Mater. 2020, 9, 2000377.
- Choi, S.J.; Ku, K.H.; Kim, B.J.; Kim, I.D. Novel Templating Route Using Pt Infiltrated Block Copolymer Microparticles for Catalytic Pt Functionalized Macroporous WO3 Nanofibers and Its Application in Breath Pattern Recognition. ACS Sens. 2016, 1, 1124–1131.
- Chang, J.; Lee, D.; Ban, S.; Oh, J.; Youn, M.; Kim, S.; Park, S.; Persaud, K.; Jheon, S. Chemical Analysis of volatile organic compounds in exhaled breath for lung cancer diagnosis using a sensor system. Sens. Actuators B. Chem. 2018, 255, 800–807.
- Binson, V.A.; Subramoniam, M.; Mathew, L. Discrimination of COPD and lung cancer from controls through breath analysis using a self-developed e-nose. J. Breath Res. 2021, 15, 46003.
- Shehada, N.; Brönstrup, G.; Funka, K.; Christiansen, S.; Leja, M.; Haick, H. Ultrasensitive silicon nanowire for real-world gas sensing: Noninvasive diagnosis of cancer from breath volatolome. Nano Lett. 2015, 15, 1288–1295.
- Obermeier, J.; Trefz, P.; Wex, K.; Sabel, B.; Schubert, J.K.; Miekisch, W. Electrochemical sensor system for breath analysis of aldehydes, CO and NO. J. Breath Res. 2015, 9, 016008.
- Mazzone, P.J.; Wang, X.; Xu, Y. Exhaled Breath Analysis with a Colorimetric Sensor Array for the Identification and Characterization of Lung Cancer. J. Thorac. Oncol. 2012, 7, 137–142.
- Silva, L.I.B.; Freitas, A.C.; Rocha-Santos, T.A.P.; Pereira, M.E.; Duarte, A.C. Breath analysis by optical fiber sensor for the determination of exhaled organic compounds with a view to diagnostics. Talanta 2011, 83, 1586–1594.
- Chen, X.; Cao, M.; Li, Y.; Hu, W.; Wang, P.; Ying, K.; Pan, H. A study of an electronic nose for detection of lung cancer based on a virtual SAW gas sensors array and imaging recognition method. Meas. Sci. Technol. 2005, 16, 1535–1546.
- Incalzi, R.A.; Pennazza, G.; Scarlata, S.; Santonico, M.; Petriaggi, M.; Chiurco, D.; Pedone, C.; D’Amico, A. Reproducibility and Respiratory Function Correlates of Exhaled Breath Fingerprint in Chronic Obstructive Pulmonary Disease. PLoS ONE 2012, 7, e45396.
- Montuschi, P.; Santonico, M.; Mondino, C. Diagnostic Performance of an Electronic Nose, Fractional Exhaled Nitric Oxide, and Lung Function Testing in Asthma. Chest 2010, 137, 790–796.
- Santonico, M.; Lucantoni, G.; Pennazza, G.; Capuano, R.; Galluccio, G.; Roscioni, C.; La Delfa, G.; Consoli, D.; Martinelli, E.; Paolesse, R.; et al. In situ detection of lung cancer volatile fingerprints using bronchoscopic air-sampling. Lung Cancer 2012, 77, 46–50.
- Gasparri, R.; Santonico, M.; Valentini, C.; Sedda, G.; Borri, A.; Petrella, F.; Maisonneuve, P.; Pennazza, G.; D’Amico, A.; Di Natale, C.; et al. Volatile signature for the early diagnosis of lung cancer. J. Breath Res. 2016, 10, 016007.
- Zetola, N.M.; Modongo, C.; Matsiri, O.; Tamuhla, T.; Mbongwe, B.; Matlhagela, K.; Sepako, E.; Catini, A.; Sirugo, G.; Martinelli, E.; et al. Diagnosis of pulmonary tuberculosis and assessment of treatment response through analyses of volatile compound patterns in exhaled breath samples. J. Infect. 2017, 74, 367–376.
- Pennazza, G.; Marchetti, E.; Santonico, M.; Mantini, G.; Mummolo, S.; Marzo, G.; Paolesse, R.; D’Amico, A.; Di Natale, C. Application of a quartz microbalance based gas sensor array for the study of halitosis. J. Breath Res. 2008, 2, 017009.
- Fasola, S.; Ferrante, G.; Sabatini, A.; Santonico, M.; Zompanti, A.; Grasso, S.; Antonelli Incalzi, R.; La Grutta, S. Repeatability of exhaled breath fingerprint collected by a modern sampling system in asthmatic and healthy children. J. Breath Res. 2019, 13, 036007.
- Castro, M.; Kumar, B.; Feller, J.F.; Haddi, Z.; Amari, A.; Bouchikhi, B. Chemical Novel e-nose for the discrimination of volatile organic biomarkers with an array of carbon nanotubes (CNT) conductive polymer nanocomposites (CPC) sensors. Sens. Actuators B. Chem. 2011, 159, 213–219.
- Liu, B.; Huang, Y.; Kam, K.W.; Cheung, W.F.; Zhao, N.; Zheng, B. Functionalized graphene-based chemiresistive electronic nose for discrimination of disease-related volatile organic compounds. Biosens. Bioelectron. X 2019, 1, 100016.
- Xu, Y.; Lee, H.; Hu, Y.; Huang, J.; Kim, S.; Yun, M. Detection and identification of breast cancer volatile organic compounds biomarkers using highly-sensitive single nanowire array on a chip. J. Biomed. Nanotechnol. 2013, 9, 1164–1172.
- Kim, G.S.; Park, Y.; Shin, J.; Song, Y.G.; Kang, C.Y. Metal oxide nanorods-based sensor array for selective detection of biomarker gases. Sensors 2021, 21, 1922.
- Koo, W.T.; Choi, S.J.; Kim, N.H.; Jang, J.S.; Kim, I.D. Catalyst-decorated hollow WO3 nanotubes using layer-by-layer self-assembly on polymeric nanofiber templates and their application in exhaled breath sensor. Sens. Actuators B Chem. 2016, 223, 301–310.
- Choi, S.J.; Fuchs, F.; Demadrille, R.; Grévin, B.; Jang, B.H.; Lee, S.J.; Lee, J.H.; Tuller, H.L.; Kim, I.D. Fast responding exhaled-breath sensors using WO3 hemitubes functionalized by graphene-based electronic sensitizers for diagnosis of diseases. ACS Appl. Mater. Interfaces 2014, 6, 9061–9070.
- Zhang, Y.; Gao, G.; Liu, H.; Fu, H.; Fan, J.; Wang, K.; Chen, Y.; Li, B.; Zhang, C.; Zhi, X.; et al. Identification of volatile biomarkers of gastric cancer cells and ultrasensitive electrochemical detection based on sensing interface of Au-Ag alloy coated MWCNTs. Theranostics 2014, 4, 154–162.
- Gautam, V.; Kumar, A.; Kumar, R.; Jain, V.K.; Nagpal, S. Silicon nanowires/reduced graphene oxide nanocomposite based novel sensor platform for detection of cyclohexane and formaldehyde. Mater. Sci. Semicond. Process. 2021, 123, 105571.
- Kus, F.; Altinkok, C.; Zayim, E.; Erdemir, S.; Tasaltin, C.; Gurol, I. Surface acoustic wave (SAW) sensor for volatile organic compounds (VOCs) detection with calixarene functionalized Gold nanorods (AuNRs) and silver nanocubes (AgNCs). Sens. Actuators B Chem. 2021, 330, 129402.
- Bahos, F.A.; Sainz-Vidal, A.; Sánchez-Pérez, C.; Saniger, J.M.; Gràcia, I.; Saniger-Alba, M.M.; Matatagui, D. ZIF nanocrystal-based surface acousticwave (SAW) electronic nose to detect diabetes in human breath. Biosensors 2019, 9, 4.
- Tao, W.; Lin, P.; Ai, Y.; Wang, H.; Ke, S.; Zeng, X. Multichannel quartz crystal microbalance array: Fabrication, evaluation, application in biomarker detection. Anal. Biochem. 2016, 494, 85–92.
- Zhao, S.; Lei, J.; Huo, D.; Hou, C.; Luo, X.; Wu, H.; Fa, H.; Yang, M. Chemical A colorimetric detector for lung cancer related volatile organic compounds based on cross-response mechanism. Sens. Actuators B. Chem. 2018, 256, 543–552.
- Huo, D.; Xu, Y.; Hou, C.; Yang, M.; Fa, H. A novel optical chemical sensor based AuNR-MTPP and dyes for lung cancer biomarkers in exhaled breath identification. Sens. Actuators B Chem. 2014, 199, 446–456.
- Dragonieri, S.; Annema, J.T.; Schot, R.; Van Der Schee, M.P.C.; Spanevello, A.; Carratú, P.; Resta, O.; Rabe, K.F.; Sterk, P.J. An electronic nose in the discrimination of patients with non-small cell lung cancer and COPD. Lung Cancer 2009, 64, 166–170.
- Tirzite, M.; Bukovskis, M.; Strazda, G.; Jurka, N.; Taivans, I. Detection of lung cancer in exhaled breath with an electronic nose using support vector machine analysis. J. Breath Res. 2017, 11, 036009.
- Tirzïte, M.; Bukovskis, M.; Strazda, G.; Jurka, N.; Taivans, I. Detection of lung cancer with electronic nose and logistic regression analysis. J. Breath Res. 2019, 13, 016006.
- Fens, N.; Zwinderman, A.H.; Van Der Schee, M.P.; De Nijs, S.B.; Dijkers, E.; Roldaan, A.C.; Cheung, D.; Bel, E.H.; Sterk, P.J. Exhaled Breath Profiling Enables Discrimination of Chronic Obstructive Pulmonary Disease and Asthma. Am. J. Respir. Crit. Care Med. 2009, 180, 1076–1082.
- Fens, N.; Roldaan, A.C.; van der Schee, M.P.; Boksem, R.J.; Zwinderman, A.H.; Bel, E.H.; Sterk, P.J. External validation of exhaled breath profiling using an electronic nose in the discrimination of asthma with fixed airways obstruction and chronic obstructive pulmonary disease. Clin. Exp. Allergy 2011, 41, 1371–1378.
- Dragonieri, S.; Scioscia, G.; Quaranta, V.N.; Carratu, P.; Venuti, M.P.; Falcone, M.; Carpagnano, G.E.; Foschino Barbaro, M.P.; Resta, O.; Lacedonia, D. Exhaled volatile organic compounds analysis by e-nose can detect idiopathic pulmonary fibrosis. J. Breath Res. 2020, 14, 047101.
- Fielding, D.; Hartel, G.; Pass, D.; Davis, M.; Brown, M.; Dent, A.; Agnew, J.; Dickie, G.; Ware, R.S.; Hodge, R. Volatile organic compound breath testing detects in-situ squamous cell carcinoma of bronchial and laryngeal regions and shows distinct profiles of each tumour. J. Breath Res. 2020, 14, 046013.
- Bach, J.P.; Gold, M.; Mengel, D.; Hattesohl, A.; Lubbe, D.; Schmid, S.; Tackenberg, B.; Rieke, J.; Maddula, S.; Baumbach, J.I.; et al. Measuring compounds in exhaled air to detect Alzheimer’s disease and Parkinson’s disease. PLoS ONE 2015, 10, e0132227.
- Krauss, E.; Haberer, J.; Maurer, O.; Barreto, G.; Drakopanagiotakis, F.; Degen, M.; Seeger, W.; Guenther, A. Exploring the ability of electronic nose technology to recognize interstitial lung diseases (ILD) by non-invasive breath screening of exhaled volatile compounds (VOC): A pilot study from the european ipf registry (eurIPFreg) and biobank. J. Clin. Med. 2019, 8, 1698.
- Bannier, M.A.G.E.; Van De Kant, K.D.G.; Jöbsis, Q.; Dompeling, E. Feasibility and diagnostic accuracy of an electronic nose in children with asthma and cystic fibrosis. J. Breath Res. 2019, 13, 36009.
- van Hooren, M.R.A.; Leunis, N.; Brandsma, D.S.; Dingemans, A.M.C.; Kremer, B.; Kross, K.W. Differentiating head and neck carcinoma from lung carcinoma with an electronic nose: A proof of concept study. Eur. Arch. Oto-Rhino-Laryngol. 2016, 273, 3897–3903.
- van de Goor, R.M.G.E.; Leunis, N.; van Hooren, M.R.A.; Francisca, E.; Masclee, A.; Kremer, B.; Kross, K.W. Feasibility of electronic nose technology for discriminating between head and neck, bladder, and colon carcinomas. Eur. Arch. Oto-Rhino-Laryngol. 2017, 274, 1053–1060.
- De Vries, R.; Brinkman, P.; Van Der Schee, M.P.; Fens, N.; Dijkers, E.; Bootsma, S.K.; De Jongh, F.H.C.; Sterk, P.J. Integration of electronic nose technology with spirometry: Validation of a new approach for exhaled breath analysis. J. Breath Res. 2015, 9, 046001.
- Moor, C.C.; Oppenheimer, J.C.; Nakshbandi, G.; Aerts, J.G.J.V.; Brinkman, P.; Maitland-Van Der Zee, A.H.; Wijsenbeek, M.S. Exhaled breath analysis by use of eNose technology: A novel diagnostic tool for interstitial lung disease. Eur. Respir. J. 2021, 57, 2002042.
- Tan, J.L.; Yong, Z.X.; Liam, C.K. Using a chemiresistor-based alkane sensor to distinguish exhaled breaths of lung cancer patients from subjects with no lung cancer. J. Thorac. Dis. 2016, 8, 2772–2783.
- Binson, V.A.; Subramoniam, M.; Sunny, Y.; Mathew, L. Prediction of Pulmonary Diseases with Electronic Nose Using SVM and XGBoost. IEEE Sens. J. 2021, 21, 20886–20895.
- Chen, K.; Liu, L.; Nie, B.; Lu, B.; Fu, L.; He, Z.; Li, W.; Pi, X.; Liu, H. Recognizing lung cancer and stages using a self-developed electronic nose system. Comput. Biol. Med. 2021, 131, 104294.
- Shlomi, D.; Abud, M.; Liran, O.; Bar, J.; Gai-Mor, N.; Ilouze, M.; Onn, A.; Ben-Nun, A.; Haick, H.; Peled, N. Detection of Lung Cancer and EGFR Mutation by Electronic Nose System. J. Thorac. Oncol. 2017, 12, 1544–1551.
- Barash, O.; Zhang, W.; Halpern, J.M.; Hua, Q.L.; Pan, Y.Y.; Kayal, H.; Khoury, K.; Liu, H.; Davies, M.P.A.; Haick, H. Differentiation between genetic mutations of breast cancer by breath volatolomics. Oncotarget 2015, 6, 44864–44876.
- Amal, H.; Leja, M.; Funka, K.; Skapars, R.; Sivins, A.; Ancans, G.; Liepniece-karele, I.; Kikuste, I.; Lasina, I.; Haick, H. Detection of precancerous gastric lesions and gastric cancer through exhaled breath. Gut 2016, 65, 400–407.
- Xu, Z.; Broza, Y.Y.; Ionsecu, R.; Tisch, U.; Ding, L.; Liu, H.; Song, Q.; Pan, Y.; Xiong, F.; Gu, K. A nanomaterial-based breath test for distinguishing gastric cancer from benign gastric conditions. Br. J. Cancer 2013, 108, 941–950.
- Shuster, G.; Gallimidi, Z.; Reiss, A.H.; Dovgolevsky, E.; Billan, S.; Abdah-Bortnyak, R.; Kuten, A.; Engel, A.; Shiban, A.; Tisch, U.; et al. Classification of breast cancer precursors through exhaled breath. Breast Cancer Res. Treat. 2011, 126, 791–796.
- Karban, A.; Nakhleh, M.K.; Cancilla, J.C.; Vishinkin, R.; Rainis, T.; Koifman, E.; Jeries, R.; Ivgi, H.; Torrecilla, J.S.; Haick, H. Programmed Nanoparticles for Tailoring the Detection of Inflammatory Bowel Diseases and Irritable Bowel Syndrome Disease via Breathprint. Adv. Healthc. Mater. 2016, 5, 2339–2344.
- Daniel, D.; Thangavel, K. Breathomics for gastric cancer classification using back-propagation neural network. J. Med. Signals Sens. 2016, 6, 172–182.
- Raspagliesi, F.; Bogani, G.; Benedetti, S.; Grassi, S.; Ferla, S.; Buratti, S. Detection of ovarian cancer through exhaled breath by electronic nose: A prospective study. Cancers 2020, 12, 2408.
- Lau, H.C.; Yu, J.B.; Lee, H.W.; Huh, J.S.; Lim, J.O. Investigation of exhaled breath samples from patients with Alzheimer’s disease using gas chromatography-mass spectrometry and an exhaled breath sensor system. Sensors 2017, 17, 1783.
- Pennazza, G.; Santonico, M.; Vernile, C.; Antonelli Incalzi, R.; De Vincentis, A.; Picardi, A. Breathprinting of liver diseases. In Proceedings of the 2015 18th AISEM Annual Conference, Trento, Italy, 3–5 February 2015; pp. 1–3.
- Saidi, T.; Zaim, O.; Moufid, M.; El Bari, N.; Ionescu, R.; Bouchikhi, B. Exhaled breath analysis using electronic nose and gas chromatography–mass spectrometry for non-invasive diagnosis of chronic kidney disease, diabetes mellitus and healthy subjects. Sens. Actuators B Chem. 2018, 257, 178–188.
- Saidi, T.; Moufid, M.; de Jesus Beleño-Saenz, K.; Welearegay, T.G.; El Bari, N.; Lisset Jaimes-Mogollon, A.; Ionescu, R.; Bourkadi, J.E.; Benamor, J.; El Ftouh, M.; et al. Non-invasive prediction of lung cancer histological types through exhaled breath analysis by UV-irradiated electronic nose and GC/QTOF/MS. Sens. Actuators B Chem. 2020, 311, 127932.
- Brinkman, P.; van de Pol, M.A.; Gerritsen, M.G.; Bos, L.D.; Dekker, T.; Smids, B.S.; Sinha, A.; Majoor, C.J.; Sneeboer, M.M.; Knobel, H.H.; et al. Exhaled breath profiles in the monitoring of loss of control and clinical recovery in asthma. Clin. Exp. Allergy 2017, 47, 1159–1169.
- Plaza, V.; Crespo, A.; Giner, J.; Merino, J.L.; Ramos-Barbón, D.; Mateus, E.F.; Torrego, A.; Cosio, B.G.; Agustí, A.; Sibila, O. Inflammatory asthma phenotype discrimination using an electronic nose breath analyzer. J. Investig. Allergol. Clin. Immunol. 2015, 25, 431–437.
- Farraia, M.; Rufo, J.C.; Paciência, I.; Castro, F.; Ana, M.; Rama, T.; Rocha, S.M.; Delgado, L.; Brinkman, P.; Moreira, A. Human volatilome analysis using eNose to assess uncontrolled asthma in a clinical setting. Allergy 2020, 75, 1630–1639.
- Tenero, L.; Sandri, M.; Piazza, M.; Paiola, G.; Zaffanello, M.; Piacentini, G. Electronic nose in discrimination of children with uncontrolled asthma. J. Breath Res. 2020, 14, 046003.
- van der Vliet, A.; Janssen-Heininger, Y.M.W.; Anathy, V. Oxidative stress in chronic lung disease: From mitochondrial dysfunction to dysregulated redox signaling. Mol. Aspects Med. 2018, 63, 59–69.
- Rodríguez-Aguilar, M.; Ramírez-García, S.; Ilizaliturri-Hernández, C.; Gómez-Gómez, A.; Van-Brussel, E.; Díaz-Barriga, F.; Medellín-Garibay, S.; Flores-Ramírez, R. Ultrafast gas chromatography coupled to electronic nose to identify volatile biomarkers in exhaled breath from chronic obstructive pulmonary disease patients: A pilot study. Biomed. Chromatogr. 2019, 33, e4684.
- Chen, X.; Muhammad, K.G.; Madeeha, C.; Fu, W.; Xu, L.; Hu, Y.; Liu, J.; Ying, K.; Chen, L.; Yurievna, G.O. Calculated indices of volatile organic compounds (VOCs) in exhalation for lung cancer screening and early detection. Lung Cancer 2021, 154, 197–205.
- Schleich, F.N.; Zanella, D.; Stefanuto, P.; Bessonov, K.; Smolinska, A.; Dallinga, J.W.; Henket, M.; Paulus, V.; Guissard, F.; Graff, S.; et al. Exhaled Volatile Organic Compounds Are Able to Discriminate between Neutrophilic and Eosinophilic Asthma. Am. J. Respir. Crit. Care Med. 2019, 200, 444–453.
- Stefanuto, P.H.; Zanella, D.; Vercammen, J.; Henket, M.; Schleich, F.; Louis, R.; Focant, J.F. Multimodal combination of GC×GC-HRTOFMS and SIFT-MS for asthma phenotyping using exhaled breath. Sci. Rep. 2020, 10, 16159.
- Buszewski, B.; Ligor, T.; Jezierski, T.; Wenda-Piesik, A.; Walczak, M.; Rudnicka, J. Identification of volatile lung cancer markers by gas chromatography-mass spectrometry: Comparison with discrimination by canines. Anal. Bioanal. Chem. 2012, 404, 141–146.
- Fuchs, P.; Loeseken, C.; Schubert, J.K.; Miekisch, W. Breath gas aldehydes as biomarkers of lung cancer. Int. J. Cancer 2010, 126, 2663–2670.
- Muñoz-Lucas, M.Á.; Jareño-Esteban, J.; Gutiérrez-Ortega, C.; López-Guijarro, P.; Collado-Yurrita, L.; Quintana-Díaz, M.; Callol-Sánchez, L. Influence of Chronic Obstructive Pulmonary Disease on Volatile Organic Compounds in Patients with Non-Small Cell Lung Cancer. Arch. Bronconeumol. 2020, 56, 801–805.
- Poli, D.; Carbognani, P.; Corradi, M.; Goldoni, M.; Acampa, O.; Balbi, B.; Bianchi, L.; Rusca, M.; Mutti, A. Exhaled volatile organic compounds in patients with non-small cell lung cancer: Cross sectional and nested short-term follow-up study. Respir. Res. 2005, 6, 71.
- Koureas, M.; Kalompatsios, D.; Amoutzias, G.D.; Hadjichristodoulou, C.; Gourgoulianis, K.; Tsakalof, A. Comparison of targeted and untargeted approaches in breath analysis for the discrimination of lung cancer from benign pulmonary diseases and healthy persons. Molecules 2021, 26, 2609.
- Zou, Y.; Zhang, X.; Chen, X.; Hu, Y.; Ying, K.; Wang, P. Optimization of volatile markers of lung cancer to exclude interferences of non-malignant disease. Cancer Biomarkers 2014, 14, 371–379.
- Fu, X.-A.; Li, M.; Knipp, R.J.; Nantz, M.H.; Bousamra, M. Noninvasive detection of lung cancer using exhaled breath. Cancer Med. 2014, 3, 174–181.
- Ii, M.B.; Schumer, E.; Li, M.; Knipp, R.J.; Nantz, M.H.; Van Berkel, V.; Fu, X. Quantitative analysis of exhaled carbonyl compounds distinguishes benign from malignant pulmonary disease. J. Thorac. Cardiovasc. Surg. 2014, 148, 1074–1081.
- Li, M.; Yang, D.; Brock, G.; Knipp, R.J.; Bousamra, M.; Nantz, M.H.; Fu, X.A. Breath carbonyl compounds as biomarkers of lung cancer. Lung Cancer 2015, 90, 92–97.
- Ibrahim, B.; Basanta, M.; Cadden, P.; Singh, D.; Douce, D.; Woodcock, A.; Fowler, S.J. Non-invasive phenotyping using exhaled volatile organic compounds in asthma. Thorax 2011, 66, 804–809.
- Fens, N.; De Nijs, S.B.; Peters, S.; Dekker, T.; Knobel, H.H.; Vink, T.J.; Willard, N.P.; Zwinderman, A.H.; Krouwels, F.H.; Lutter, R.; et al. Exhaled air molecular profiling in relation to inflammatory subtype and activity in COPD. Eur. Respir. J. 2011, 38, 1301–1309.
- Basanta, M.; Ibrahim, B.; Dockry, R.; Douce, D.; Morris, M.; Singh, D.; Woodcock, A.; Fowler, S.J. Exhaled volatile organic compounds for phenotyping chronic obstructive pulmonary disease: A cross-sectional study. Respir. Res. 2012, 13, 72.
- Van Vliet, D.; Smolinska, A.; Jöbsis, Q.; Rosias, P.P.R.; Muris, J.W.M.; Dallinga, J.W.; Van Schooten, F.J.; Dompeling, E. Association between exhaled inflammatory markers and asthma control in children. J. Breath Res. 2016, 10, 016014.
- Van Vliet, D.; Smolinska, A.; Jöbsis, Q.; Rosias, P.; Muris, J.; Dallinga, J.; Dompeling, E.; Van Schooten, F.J. Can exhaled volatile organic compounds predict asthma exacerbations in children? J. Breath Res. 2017, 11, 016016.
- Robroeks, C.M.; Van Berkel, J.J.; Jöbsis, Q.; Van Schooten, F.J.; Dallinga, J.W.; Wouters, E.F.; Dompeling, E. Exhaled volatile organic compounds predict exacerbations of childhood asthma in a 1-year prospective study. Eur. Respir. J. 2013, 42, 98–106.
- Pizzini, A.; Filipiak, W.; Wille, J.; Ager, C.; Wiesenhofer, H.; Kubinec, R.; Blaško, J.; Tschurtschenthaler, C.; Mayhew, C.A.; Weiss, G.; et al. Analysis of volatile organic compounds in the breath of patients with stable or acute exacerbation of chronic obstructive pulmonary disease. J. Breath Res. 2018, 12, 036002.
- D’Amico, A.; Pennazza, G.; Santonico, M.; Martinelli, E.; Roscioni, C.; Galluccio, G.; Paolesse, R.; Di Natale, C. An investigation on electronic nose diagnosis of lung cancer. Lung Cancer 2010, 68, 170–176.
- Phillips, M.; Cataneo, R.N.; Ditkoff, B.A.; Fisher, P.; Greenberg, J.; Gunawardena, R.; Kwon, C.S.; Tietje, O.; Wong, C. Prediction of breast cancer using volatile biomarkers in the breath. Breast Cancer Res. Treat. 2006, 99, 19–21.
- Tiele, A.; Daulton, E.; Ifeachor, E.; Eyre, V.; Clarke, S. Breath-based non-invasive diagnosis of Alzheimer ’ s disease : A pilot study Breath-based non-invasive diagnosis of Alzheimer’ s disease: A pilot study. J. Breath Res. 2020, 14, 026003.
- Das, S.; Pal, M. Review-Non-Invasive Monitoring of Human Health by Exhaled Breath Analysis: A Comprehensive Review. J. Electrochem. Soc. 2020, 167, 037562.
- Sakumura, Y.; Koyama, Y.; Tokutake, H.; Hida, T.; Sato, K.; Itoh, T.; Akamatsu, T.; Shin, W. Diagnosis by volatile organic compounds in exhaled breath from lung cancer patients using support vector machine algorithm. Sensors 2017, 17, 287.