Your browser does not fully support modern features. Please upgrade for a smoother experience.
Please note this is an old version of this entry, which may differ significantly from the current revision.
Subjects:
Engineering, Industrial
Cement has long been recognized as an energy- and emission-intensive construction material. Cement production has recently experienced significant growth despite its high energy consumption, resource usage, and carbon emissions.
- life cycle assessment
- blended cement
- clinker substitution
- greenhouse gas (GHG) reduction
- environmental impacts
1. Introduction
Cement production is a multiplex process that uses numerous raw materials, non-renewable energy, electricity, and heat energy, as well as air and water as auxiliary resources [1,2,3]. This process significantly impacts our environment due to its raw material and high energy use and processing [4]. The main environmental problems are energy use and air emissions, wastewater production, solid waste production, and noise. Therefore, cement is a widely used construction material whose production has an enormous environmental impact, especially with regard to carbon dioxide (CO2, a greenhouse gas) emissions and energy consumption [5,6]. A significant amount of CO2 (900–1000 kg/ton of cement production) is emitted during the heating of the limestone and clay to 1450 °C in cement production [7,8]. Cement production, the second largest industrial source of carbon emissions, contributes about 5–10% of global anthropogenic CO2 emissions [9,10] and 3% of total greenhouse gas (GHG) emissions [2,11,12]. Cement production accounts for about 12–15% of total industrial energy usage globally [11,13]. Cement industries are most concerned about NOX and SO2, among other air pollutants. These emissions are both direct and indirect. Most carbon dioxide (CO2) emissions are direct emissions from calcium carbonate (CaCO3) calcination to calcium oxide (CaO) during clinker production [14,15], while indirect emissions are caused by burning fossil fuels, used in calcination, material processing, transportation, and cement grinding [15,16]. Regardless of production technology and location, direct and indirect CO2 emissions contribute approximately equal amounts of CO2 emissions [17].
Global cement production is estimated to emit 4.3 Gigatonnes (Gt) of CO2 eq/year by 2050 if there is no mitigation effort, representing a 260% increase over 1990 emission levels [18,19]. Various mitigation strategies are available for reducing GHG emissions from cement production, including improving energy efficiency, switching to alternative fuels, and using recycled materials as aggregate. The production and transportation of cement materials result in a significant carbon footprint. Numerous initiatives are underway to mitigate its environmental impacts. Notably, using by-products has emerged as a noteworthy development in this regard. Assessing the possible environmental impacts of different cement products is of utmost importance toward reducing their harmful effects on climate change, ecosystem quality, human health, and the resources required for cement production. Among the most effective ways to reduce resource consumption and carbon emissions from cement production is to use industrial waste as an alternative material and fuel [20]. Alternative fuels are often employed in the kiln and calciner to reduce non-renewable fossil fuel usage and pollutant emissions from fuel burning [21]. Another possible method is to use alternative materials, such as supplementary cementitious materials (SCMs), industrial by-products, and waste. The properties of these SCMs enable them to be used as partial or complete substitutes for clinker in Portland cement during cement production. Also, SCM application can improve the industrial relationship between the cement industry and other sectors because SCMs are primarily composed of waste from other industries [12]. Various SCMs, such as blast furnace slag (BFS) from the steel industry, as well as ground limestone powder (GLP) and fly ash (FA) from the coal industry, are available for reducing carbon emissions from Portland cement production and for producing low-carbon blended cement [22,23,24].
Despite concerns regarding the global availability of fly ash and slags, South Africa has a relatively abundant supply of both [25], which could be a tremendous opportunity for the local cement industry to use these two wastes to produce eco-blends. Approximately 40 million tons of fly ash are produced annually in South Africa [25]. Furthermore, roughly 9.3 kWh per ton of energy consumption are required to process FA as an SCM in cement [26]. FA is used in this study under the ‘no allocation’ principle [27,28], indicating that no upstream environmental impacts from coal-fired power plants have been allocated to FA. BFS is a solid by-product of the iron–steel metallurgical industry that has been stored for a long period, occupying large land spaces and causing environmental pollution in the soil, underground water, and air. FA and ground granulated blast furnace slag (GGBFS) are widely used in cement production, which reduces the consumption of natural resources and their environmental impact. Also, achieving environmental protection through comprehensive waste resource use is advantageous. FA is a by-product that usually results from burning coal for electricity generation in coal-fired power plants. Although FA can be used directly as a cement substitute [28], it can also be combined with conventional raw materials to produce Portland cement [29]. FA as a cement substitute can improve the properties of cement strength and durability and reduce GHG emissions [30], as well as the strength development rate [31]. GGBFS is a by-product of hot metal production in the blast furnaces of steel plants, produced by water-quenching slag [15] and used as a partial substitute for Portland cement in cement production. It can increase technical properties, such as strength, permeability, and corrosion resistance, when used as a substitute in Portland cement production [32]. Using GGBFS in cement production consumes fewer raw materials and reduces GHGs, mainly CO2 and other environmental impacts [33,34,35], thereby improving the cement’s technical properties [36,37,38].
In South Africa, the age of cement plants ranges between 5 and more than 70 years [39]. Limestone, shells, and chalk or marl are among the most used raw materials in cement production, along with clay, shale, slate, silica sand, iron ore, blast furnace slag, and gypsum. Some cement plants in the country use only low-grade limestone as a raw material for clinker production [40]. Portland Cement (CEM I) is the most commonly produced cement product in South Africa, followed by blended cement products such as CEM II–CEM III, with 16 integrated cement plants within the country [41,42] using the dry process [18,43,44]. CEM I cement is Portland cement with more than 95% clinker content. CEM II cement refers to Portland cement with clinker content between A (80–94% clinker ratio) and B (65–79% clinker ratio). Gypsum, plus other pozzolanic components such as fly ash, blast furnace slag, micro silica and ground limestone, are present in CEM II cement. CEM III cement refers to Portland cement with clinker content between A (35–64% clinker ratio) and B (20–34% clinker) [40,42]. CEM III contains gypsum and GGBFS. Since blended cement needs a finer grind and is produced with different cement constituents, blended cement production requires more electricity than Portland cement production. South African cement products are sold within the country and to other Southern African countries, including Namibia, Swaziland, Lesotho, and Botswana. The CO2 released during clinker production, an intermediate stage in cement production, is the primary GHG emission. Clinker production, where the raw meal is converted into clinker, is the most energy-intensive and emission-prone stage in cement production, [3,45].
In 2019, South Africa ranked seventh in the world and first in Africa regarding GHG emissions, mainly due to its dependence on coal [46]. Burning fossil fuels accounts for about half of the CO2 emissions associated with clinker production, while the remaining emissions are from limestone calcination [47]. The cement industry in South Africa plays a vital role in meeting the government’s developmental goals to reduce GHG emissions. Still, it is also one of the country’s largest emitters of GHGs, accounting for 1% of total emissions. Therefore, the cement sector must take action to mitigate and reduce its carbon footprint in order to fulfill both the national development and international climate change commitments.
Furthermore, the total energy required for cement production is influenced by location, production efficiency, technology, the energy mix used to generate electricity, and kiln fuel selection [47]. Several methods have been proposed for reducing CO2 emissions, conserving non-renewable fossil fuels, reducing fuel costs, and preventing waste incineration and landfilling. These include reducing the clinker/cement ratio, using waste or raw materials as fuel, and upgrading the current technology [48,49,50]. Cement production can also use non-carbonate materials, reducing CO2 emissions, but the amounts used in South Africa are low and unreported. Despite recent increases in the use of alternative fuels, further improvements are still possible. In cement production, burning fossil fuels contributes to significant amounts of GHG emissions, so substituting the fuels used in the cement industry can reduce these GHG emissions.
When implementing the clinker substitution strategy in the cement industry, it is essential to evaluate its environmental impacts comprehensively. Life cycle assessment (LCA) is a suitable standard tool used to measure not only the global warming potential (GWP) of blended cements, also called SCM-based cements, but their additional effects on ecosystems, human health, and resource availability. Rather than limiting the impact assessment to the production stage of cement only, LCA can assess the entire life cycle of cement, starting from the extraction of raw materials to its end disposal. Since 2009, LCA has been carried out on blended cements in order to assess how eco-friendly they are when substituting clinker with SCMs in blended cements. Despite this, there has been no attempt to gather and compare these LCAs. Consequently, an updated publication is necessary in order to consolidate these existing LCAs and provide direction and assistance to researchers and stakeholders in the emerging field of SCM-based cement.
The cementitious properties of GGBFS make it an ideal substitute for clinker in cement production. For instance, in CEM III products, GGBFS substitution ranges from 21 to 95%, depending on the type of blend of cement products. The following are the advantages of Portland FA and Portland GGBFS blended cement: both are abundant and cost-effective, have the same cost as PC, reduce other environmental impacts from landfills and dams when used as CSMs in cement production, demonstrate the same performance as traditional Portland cement, and reduce carbon emissions from cement production. Likewise, Portland limestone has a similar price to Portland cement, is abundant in many countries, has the same performance as Portland cement, and uses the same equipment as traditional Portland cement.
2. The Characterization Results of the Impact Indicators (Midpoint Analysis)
The impacts of each environmental impact category were calculated using different units to make it easier to compare the different scenarios. Table 2 presents the comparative characterization results of 1 kg of CEM I, CEM II/B-L, CEM II/B-V, and CEM III/A at the midpoint method. The impact categories studied in this work were divided into three impact groups (atmospheric, resource depletion, and toxicity) in order to enable visual analysis of the results. The atmospheric impacts consist of GWP, PMFP, ODP, EOFP, and HOFP, whereas resource depletion impacts include TAP, FEP, MEP, FFP, SOP, WCP, and LOP, and toxicity includes IRP, TETP, FETP, METP, HTPc, and HTPnc.
Table 2. Midpoint characterization results of different types of cement produced in South Africa (per kg of cement).
| Impact Category. | Unit | CEM I | CEM II/B-L | CEM II/B-V | CEM III/A |
|---|---|---|---|---|---|
| Atmospheric impacts | |||||
| GWP | kg CO2 eq | 0.993 | 0.856 | 0.706 | 0.641 |
| ODP | kg CFC11 eq | 1.94 × 10⁻⁷ | 1.80 × 10⁻⁷ | 1.53 × 10⁻⁷ | 1.68 × 10⁻⁷ |
| HOFP | kg NOx eq | 2.10 × 10⁻³ | 1.86 × 10⁻³ | 1.55 × 10⁻³ | 1.45 × 10⁻³ |
| PMFP | kg PM2.5 eq | 7.93 × 10⁻⁴ | 7.28 × 10⁻⁴ | 6.19 × 10⁻⁴ | 6.86 × 10⁻⁴ |
| EOFP | kg NOx eq | 2.12 × 10⁻³ | 1.88 × 10⁻³ | 1.56 × 10⁻³ | 1.46 × 10⁻³ |
| Resource depletion impacts | |||||
| TAP | kg SO2 eq | 2.44 × 10⁻³ | 2.25 × 10⁻³ | 1.92 × 10⁻³ | 2.17 × 10⁻³ |
| FEP | kg P eq | 3.16 × 10⁻⁴ | 2.81 × 10⁻⁴ | 2.36 × 10⁻⁴ | 2.42 × 10⁻⁴ |
| WCP | m3 | 1.36 × 10⁻³ | 1.22 × 10⁻³ | 1.02 × 10⁻³ | 1.07 × 10⁻³ |
| MEP | kg N eq | 1.93 × 10⁻⁵ | 1.72 × 10⁻⁵ | 1.44 × 10⁻⁵ | 1.47 × 10⁻⁵ |
| SOP | kg Cu eq | 2.16 × 10⁻³ | 1.85 × 10⁻³ | 1.53 × 10⁻³ | 1.28 × 10⁻³ |
| FFP | kg oil eq | 0.139 | 0.123 | 0.103 | 0.109 |
| LOP | m2a crop eq | 7.83 × 10⁻³ | 6.93 × 10⁻³ | 5.86 × 10⁻³ | 6.33 × 10⁻³ |
| Toxicity impact | |||||
| IRP | kBq Co-60 eq | 9.97 × 10⁻³ | 9.29 × 10⁻³ | 8.01 × 10⁻³ | 8.82 × 10⁻³ |
| FETP | kg 1,4-DCB | 1.58 × 10⁻² | 1.44 × 10⁻² | 1.26 × 10⁻² | 1.45 × 10⁻² |
| METP | kg 1,4-DCB | 2.14 × 10⁻² | 1.95 × 10⁻² | 1.70 × 10⁻² | 1.95 × 10⁻² |
| TETP | kg 1,4-DCB | 1.04 | 0.927 | 0.796 | 0.902 |
| HTPc | kg 1,4-DCB | 2.44 × 10⁻² | 2.20 × 10⁻² | 1.86 × 10⁻² | 1.98 × 10⁻² |
| HTPnc | kg 1,4-DCB | 0.497 | 0.448 | 0.383 | 0.415 |
Generally, CEM III/A demonstrates the highest reduction in all impact categories, followed by CEM II/B-V and CEM II/B-L. This study showed that the impact on GWP was reduced by 14% in CEM II/B-L, 29% in CEM II/B-V, and 35% in CEM III/A, compared to CEM I.
Stafford et al. [93] stated that GWP is the most studied impact category in the LCA literature on cement production. Eco-blend cement significantly reduces GWP when compared to traditional PC. This study discovered that CEM III/A eco-blend cement emits 0.64 kg CO2, compared to CEM I and CEM II/B-L, which release 0.99 kg CO2 eq and 0.86 kg CO2 eq, respectively. As shown in Figure 2, this study compared the characterization result of CEM III/A with 36–65% GGBFS substitution to that of CEM I. Similarly, as shown in Figure 3, the GWP of CEM II/B-V eco-blend cement is 0.71 kg CO2 eq. With regard to the atmospheric impacts, CEM III/A shows the lowest contribution to GWP and HOFP, followed by CEM II/B-V, which contributes to PMFP, EOFP, and ODP.
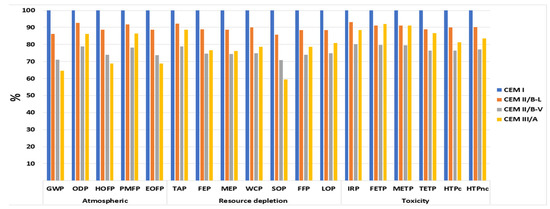
Figure 2. GWP of eco-blend cement versus traditional Portland cement in South Africa.
3. Contribution Analysis at the Midpoint
Figure 3 presents results for each impact category, but evaluating the different processes’ contributions to the final values is also essential. The LCIA results were divided into five production processes: clinkering, raw material, electricity usage, transportation, and fuel usage [67,93,103,108,110], which are comparatively studied and interpreted. The raw material process covers the extraction of limestone for clinker and cement production, including the inputs and outputs relevant to plant operation and control. Clinkering includes all emissions released directly by the kiln during clinker production. Fuel usage consists of the production of fuels used for thermal energy during cement and clinker production. The electricity stage includes electrical energy used to produce both clinker and cement. The transportation consists of the land transportation (via trucks and trains) of raw materials and fuels.
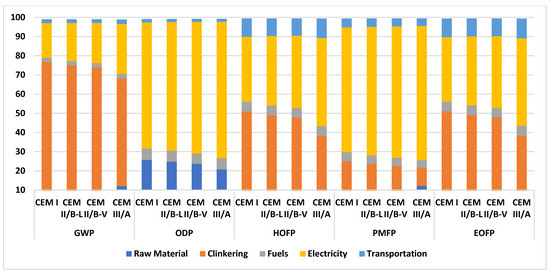
Figure 3. Contribution analysis results for atmospheric impacts at the midpoint.
The results show that the clinkering and electricity usage stages significantly contribute to atmospheric impact categories. The clinkering stage contributes the most to the GWP (76% in CEM I to 75% in CEM II/B-L, 73% in CEM II/B-V, and 56% in CEM III/A). As a result of the low clinker–cement ratio compared to CEM I, CEM II/B-L, CEM II/B-V, and CEM III/A have a low negative impact on the environment, according to our results. HOFP and EOFP have the same values (42% in CEM I to 40% in CEM II/B-L, 39% in CEM II/B-V, and 29% in CEM III/A). These values are expected, since clinker production is the most intensive and presents the highest atmospheric emissions. These results are similar to those from other studies in the literature [48,103,108,109,110], which determined that clinkering is the primary cause of GWP, HOFP, and EOFP in cement production. Electricity usage is the major contributor to the ODP (66% in CEM I to 67% in CEM II/B-L, 69% in CEM II/B-V, and 71% in CEM III/A) and PMFP (65% in CEM I to 67% in CEM II/B-L, 68% in CEM II/B-V, and 70% in CEM III/A). CEM III/A showed the highest values in both ODP and PMFP due to GGBFS substitution. As a result, cement production with GGBFS, to some extent, increases electricity usage while significantly improving the benefits of land resources and material savings, as well as reducing the environmental impact of cement. This study discovered that electricity usage is the major contributor to PMFP, similar to the study of Çankaya and Pekey [110] in Turkey, which is also linked to PMFP because South Africa and Turkey both depend on fossil fuels for electricity generation.
The impact contributions of resource depletion categories are more homogeneous. The results show that raw materials and fuel usage are the major contributors to resource depletion impact categories, as shown in Figure 4. This result was primarily due to the massive coal reserves in South Africa. Raw materials mainly contribute to SOP (100% in CEM I, CEM II/B-L, CEM II/B-V, and CEM III/A). This is in line with the other literature [109,110]. Raw materials also contribute to WCP (73% in CEM I to 72% in CEM II/B-L, 71% in CEM II/B-V, and 68% in CEM III/A) and LOP (31% in CEM I to 32% CEM II/B-L, 33% in CEM II/B-V, and 37% in CEM III/A). Fuel usage contributes most to FFP (100% in CEM II/B-L, CEM II/B-V, and CEM III/A), as well as MEP and FEP, which have the same values (96% in CEM I, CEM II/B-L, and CEM II/B-V, and 95% in CEM III/A), and LOP (38% in CEM I, CEM II/B-L, and CEM II/B-V, and 36% in CEM III/A). These results are similar to what was found in the other literature [109,110].
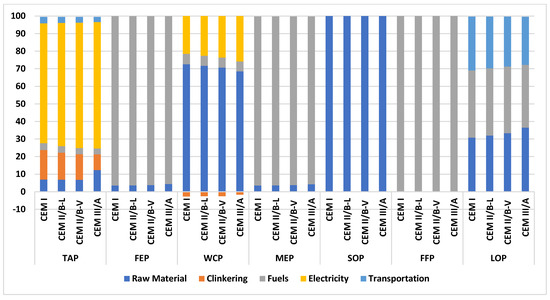
Figure 4. Contribution analysis results for resource depletion impacts at the midpoint.
Fuel usage (38% in CEM I to 38% CEM II/B-L, 38% in CEM II/B-V, and 36% in CEM III/A), transportation (31% in CEM I to 29% CEM II/B-L, 28% in CEM II/B-V, and 27% in CEM III/A), and raw materials (31% in CEM I to 32% CEM II/B-L, 33% in CEM II/B-V, and 37% in CEM III/A) are the major contributors to LOP. Electricity is the highest contributor to TAP (68% in CEM I to 70% CEM II/B-L, 71% in CEM II/B-V, and 72% in CEM III/A) and the clinkering stage also contributes (17% in CEM I to 15% in CEM II/B-L and CEM II/B-V, and 9% in CEM III/A). In this study, raw materials and fuel usage are the main contributors to eutrophication impacts (FEP and MEP). This result is similar to those from studies in Brazil [109], Spain [103], and Southern Europe [48], which showed that clinkering and electricity usage significantly impact FEM and MEP.
The results show that raw materials contribute the most significantly regarding toxicity impact categories, as shown in Figure 5. Raw materials contribute 93% in CEM I, CEM II/B-L, CEM II/B-V, and CEM III/A to FETP and IRP; 91% in CEM I, CEM II/B-L, CEM II/B-V, and CEM III/A to METP; 80% in CEM I, CEM II/B-L, CEM II/B-V, and CEM III/A to HTPnc; and 75% in CEM to 74% in CEM II/B-L and CEM II/B-V, and 72% in CEM III/A to HTPc. However, transportation (49% in CEM I to 47% in CEM II/B-L, 45% in CEM II/B-V, and 42% in CEM III/A) and raw materials also contribute (30% in CEM I to 31% in CEM II/B-L, 34% in CEM II/B-V, and 39% in CEM III/A) to TETP. These results were attributable to the significantly high material usage and direct air emission. This study shows that the raw materials stage mainly contributes to TETP, METP, and FETP. This result is similar to those of studies in Turkey [110] and Brazil [109] regarding cement production. This study also shows that raw materials contribute to HTPc and HTPnc. This result aligns with a study by Palermo et al. [109], compared to the studies by Çankaya & Pekey [110] and García-Gusano et al. [103] that showed electricity usage contributes mainly to HTPc and HTPnc.
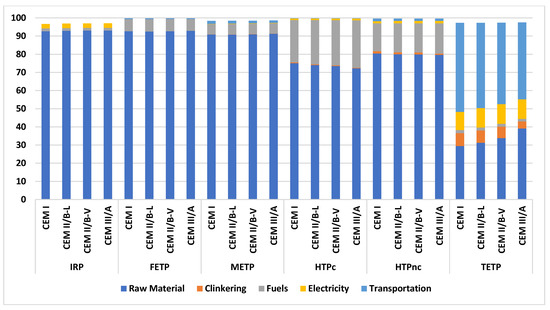
Figure 5. Contribution analysis results for toxicity impacts at the midpoint.
The GWP results of atmospheric impacts show a 14% reduction in CEM II/B-L, 29% in CEM II/B-V, and 35% in CEM III/A, compared to CEM I. This indicates that using SCMs (industrial by-products) as clinker substitutes significantly reduces the environmental impact per kg of cement finished products in South Africa. The impact of CEM III/A cement production, as measured by TAP, is lower than that of CEM I production, due to the higher GGBFS content used in Portland blast furnace slag-blended cement production. The size of GGBFS is smaller (1–2 mm) than clinker (10–40 mm). Furthermore, clinker has a poorer grindability than GBFS, so, theoretically, GBFS should have a lower acidification potential. Although using GGBFS may require additional efforts because of lower grindability and extra drying requirements, it still has a lower environmental impact than other by-products when used as a substitute for clinker. Overall, replacing clinker with GGBFS is still a beneficial practice.
This entry is adapted from the peer-reviewed paper 10.3390/cleantechnol5030045
This entry is offline, you can click here to edit this entry!