Quantum dots are very interesting materials for different opto-electronic applications. Among the different quantum dots available, semiconductor quantum dots of PbS became very popular and are extensively studied. This chapter focuses on the current understanding of the superlattice formation process induced via self-assembly of PbS quantum dots as probed by the Grazing incidence small angle X-ray scattering techniques (GISAXS/GIWAXS).
- GISAXS
- GIWAXS
- quantum dot
- self-assembly
- grazing incidence scattering
- superlattices
- in-situ
1. Why study Quantum Dots?
Nanoparticles (NPs) have been the subject of immense research in the last few decades, focusing on understanding their behavior at the atomic scale. NPs are being used widely in almost all fields of research such as medicine, agriculture, food packaging, sensing devices, coatings and many more [1][2][3][4][5][6][7][8][9][10][11][12][13]. The wide use of NPs comes from their intrinsic amazing property of high surface area to volume ratio which makes them exhibiting interesting chemical, physical, electronic, magnetic properties which differ from the bulk scale ones. A special class of NPs are quantum dots (QDs), which are nm-sized particles with a tunable band gap with size variation [14][15]. QDs are zero dimension nanoparticles. Electrons residing on the dot occupy quantized energy levels. The degree of confinement in QDs is size dependent and it affects the occupied density of states which causes changes in electrical and optical properties [16]. Thanks to the peculiar physical properties, QDs have been long since used as fluorescence materials [17][18][19][20] and in optoelectronics applications [21][22][23][24].
In their solid form, QDs can self-assemble forming ordered structures, called superlattices, whose formation is under extensive study [25][26]. The most common form of self-assembly is driven by solvent evaporation (drop casting), wherein the solvent is evaporated at a calculated rate and the QDs begin to self-assemble to minimize the surface energy [27][28][29][30][31][32].
2. PbS Quantum Dots
PbS quantum dots (or nanocrystals) have been studied extensively due to their application in organic solar cells allowing a high efficiency of 7.9%, [33] as electron blocking layers in solar cells, [34] and in photodetector [35]. Moreover, devices based on superlattices of colloidal PbS QDs are also being investigated [26][36].
3. Brief Introduction to GISAXS/GIWAXS
Depending on if the detector is placed far away or close to the sample, a smaller or larger scattering angular range is probed, allowing it to cover the gracing incidence small angle X-ray scattering (GISAXS) or the gracing incidence wide angle X-ray scattering (GIWAXS) range, respectively. Typically, we distinguish between GISAXS (length-scales in the 1–1000 nm range) and GIWAXS (0.1–1 nm). Using two dimensional detectors, the scattering signal in the direction parallel (y direction) or perpendicular (z direction) to the substrate is collected at once (Figure 1).
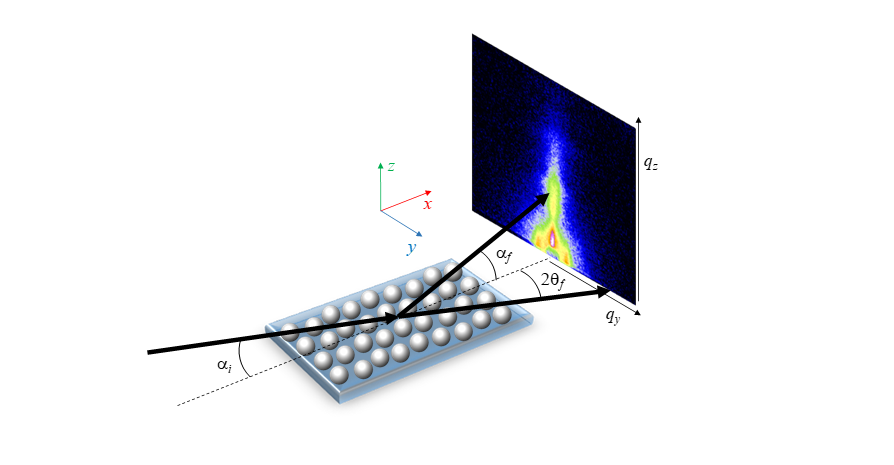
Figure 1. Schematic of a GISAXS/GIWAXS experimental setup showing the incident (i) and the scattered angles along the horizontal (2θf ) and vertical (αf) direction. X-rays are coming along the x direction.
When using GISAXS/GIWAXS for QD superlattices, some important advantages exist: (1) the penetration of X-rays in the substrate is quite limited when αi ≈ αcsubstrate, so the background is generally low; (2) the scattering intensity of the thin layer (or submonolayer) supported on the substrate can be greatly enhanced due to the minimum penetration in the substrate and maximum intensity of the evanescent wave when αi ≈ αcsubstrate; (3) as the footprint of the beam is as long as the length of the sample along the beam path (typically mm to cm), large scattering intensity is collected at the detector and statistically meaningful information can be obtained; (4) it is possible to run experiments in the second and sub-second timescales when using synchrotron radiation; (5) GISAXS/GIWAXS investigations at the solid–liquid, liquid–air and liquid–liquid interface can be performed. Moreover, information about the surface region, the bulk of the deposited film or even beneath the substrate surface, such as buried clusters of nanoparticles can be probed by adjusting the incident angle with respect to the sample and substrate critical angles.
4. Recent research work reviewed
The mechanism of superlattice formation via self-assembly of PbS QDs deposited onto silicon substrates via drop casting technique was studied by M. Corricelli et al. using both in-situ and ex-situ GISAXS/GIWAXS [28]. The effect of size and concentration of organic capped PbS QDs on the superlattice formation and the final superlattice structural ordering was studied. PbS QDs of 2.7 nm and 3.3 nm diameter were investigated at three different initial concentrations dispersed in toluene. In-situ GISAXS results revealed that the onset of superlattice formation for PbS QDs of 2.7 nm occurs earlier than the 3.3 nm PbS QDs.
As can be seen from Figure 1, there is formation of layered structures with a characteristic repeating distance of (111) and (002) fcc superlattice planes. There were no deviations reported in the GISAXS pattern from the fcc pattern. With increasing initial QD concentration it was observed that the GISAXS intensity reduces and there is a lower degree of assembly order.

Figure 2. GISAXS patters for PbS2.7 (a–c) and PbS3.3 (d–f) indicating the process of formation of layered structures. Frames shown are at the end of the self-assembly process occurring during drying (30 min). Reprinted with permission from Ref. [28]. Copyright 2014, Royal Society of Chemistry.
This observation could be the result of entropic effects and repulsions due to coulomb potential becoming important when ensembles of QDs of such small sizes come close to each other as a result of increasing concentration. Ex-situ GISAXS measurements on these quantum dots showed that there was no change in the fcc structural ordering even after aging in air, suggesting good stability of the structures. Nevertheless, a contraction of the unit cell parameters was observed for both sets of PbS QDs (10% for PbS2.7 and 7% for PbS3.3) due to the oxidation of quantum dots in air. Ex-situ GIWAXS studies showed that the PbS2.7 were reported to be more spherical and not showing preferential ordering as compared to the PbS3.3 which showed (110) preferred orientational ordering.
The kinetics of self-assembly of larger 5.6 nm PbS QDs with oleic acid (OA) ligands were studied using in-situ GISAXS by Weidman et al. [29]. GISAXS measurements of PbS5.6 QDs self-assembly were performed by drop casting process, although spin coated samples gave similar lattice assembly. The results extracted from GISAXS patterns showed that the PbS5.6 QDs self-assembled into a bcc superlattice starting from fcc orientation in the colloidal suspension and going through a body centered tetragonal (bct) orientation, which was likened to a Bain-like distortion. However, the superlattice evolution is not a complete Bain distortion which was also earlier reported by Bian et al., [37][38] and is depicted in Figure 3.
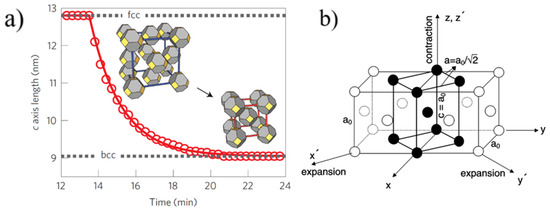
Figure 3. (a) Temporal contraction observed for 5.6 nm PbS quantum dots (QDs). (b) Bain distortion observed during the fcc–bcc transformation in martensite steel. (a): Reproduced with permission from Ref. [29]. Copyright 2016, Springer Nature. (b): Reprinted with permission from Ref. [38]. Copyright 2001, Elsevier.
Bain distortion, commonly observed in martensite steel, involves a change in all the three lattice parameters a, b and c (contraction along c and expansion along a and b) when going from a fcc to bcc via a bct transformation [38]. Weidman and coworkers only observed a contraction in the length of the c axis along the [001] direction, while the a and b axes remained constant. A decrease in the c axis implies a decreased distance between the nanocrystals, possibly due to ligand interdigitation. A contrasting result in the c axis contraction observed for PbS QDs with respect to other soft material systems is that the contraction reported here is at a 45° inclination with respect to the surface normal while it is rather observed normal to the surface in other soft material systems due to the vertical direction of solvent evaporation. The GISAXS patterns for the three unit cells observed during PbS5.6 superlattice formation are given in Figure 4.
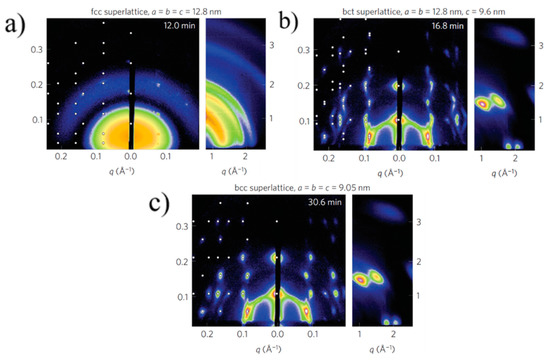
Figure 4. GISAXS patterns showing fcc (a) to bcc (c) transformation via an intermediate bct (b) superlattice formation. Adapted with permission from Ref. [29]. Copyright 2016, Springer Nature.
Another useful information extracted from the GIWAXS/GISAXS measurement of the PbS5.6 QDs is the change over time of the tilt angle of the nanocrystals (NC) and the superlattice (SL), relative to the substrate (Figure 5). Both SL and NCs have an exponential change of the tilt angle with time which is reported to be in accordance with the superlattice densification which is also exponential. The superlattice contracts due to the c axis shortening and also rotates followed by the rotation of the NCs in order to obtain the directional interaction with the neighboring NCs. This suggests that the ligands attached to the faces of the NCs drive the transformation from fcc to bcc, packing more efficiently around the NC cores, in agreement to what reported by Goodfellow et al. [39].
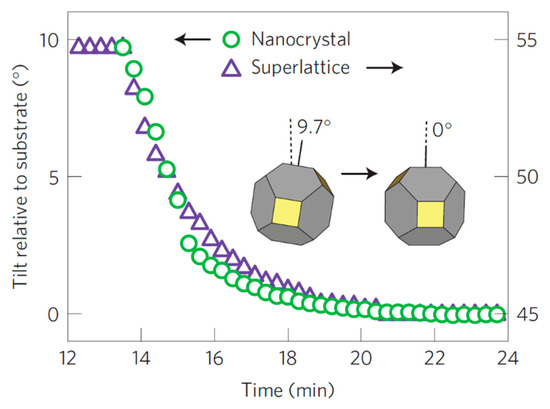
Figure 5. Temporal evolution of the superlattice (SL) and nanocrystal (NCs) tilt angle with respect to the substrate occurring during the fcc-to-bcc transformation in 5.6 nm PbS QDs. Adapted with permission from Ref. [29]. Copyright 2016, Springer Nature.
With respect to the ligands, S. Maiti et al. replaced the oleic acid (OA) surface ligands by conductive tetrabutylammonium tetrathiafulvalene dicarboxylate (TTFDA) ligands and have reported in-situ GISAXS measurements during the ligand exchange at the air–liquid interface (Figure 6) [32]. The effect of ligand exchange was measured as an additional 6% observed superlattice contraction to the initial 5% contraction occurring during self-assembly due to inter-digitization of the ligands, owing to their smaller size. The bi-dentate cross-linker (tetrathiafulvalene dicarboxylate) added, locks the nanocrystal because of its structure and size. Hence, the superlattice does not undergo further lattice contraction after ligand exchange. In this way, superlattices with the desired interparticle spacing can be achieved by freezing contraction by addition of such geometrical ligands to the nanocrystals.
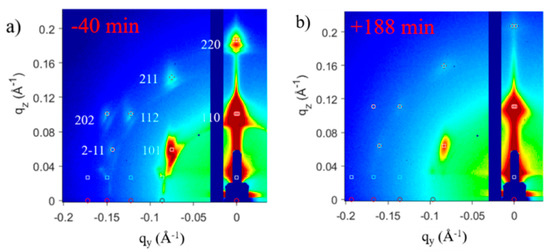
Figure 6. GISAXS patterns for 6.8 nm PbS QD superlattices (a) before and (b) after ligand exchange from oleic acid to tetrabutylammonium tetrathiafulvalene dicarboxylate. Time zero is defined here as the time when ligand exchange is started. Adapted with permission from Ref. [32]. Copyright 2018, American Chemical Society.
The change in the (011) diffraction peak observed in the in-plane GISAXS profiles (Figure 7) of the superlattice during drying suggests a clear contraction of the system while the bcc arrangement was retained throughout the self-assembly process.

Figure 7. (a) In-plane GISAXS line profiles before and after ligand exchange, showing temporal superlattice contraction. Time zero is defined here as the time when ligand exchange is started. (b) Onset of superlattice while some solvent is still present (in green color). (c) Complete drying of NCs leads to a lateral contraction with the OA ligands as spacers. (d) Ligand induced contraction of the superlattice. Adapted with permission from Ref. [32]. Copyright 2018, American Chemical Society.
It is interesting to highlight some differences between the works of Weidman [29] and Maiti [32]. Figure 8 shows the comparison between the lattice contractions reported in the two works. The systems under study in these two works are PbS QDs of comparable size (5.6 nm vs 6.8 nm) and with oleic acid as surface ligand so the two works can be well compared. While Maiti et al. report a modest 5% contraction, the contraction percentage reported by Weidman et al. is about 30%. Moreover, Maiti et al. did not observe neither fcc nor bct intermediate structures, but only a bcc lattice along the whole self-assembly process. The main difference between this two works is that while Weidman et al. used a large angle of incidence αi=0.25° and their GISAXS measurements are more sensitive to what happens in the bulk of the drying droplet and at the liquid–substrate interface, Maiti et al. [32] performed the GISAXS measurement mostly at the liquid–air interface using αi=0.15°, practically in coincidence of the system critical angle αi=0.14°. It can thus be concluded that the self-assembly process at the liquid–air interface, in the bulk of the suspension and in contact with the substrate, may differ significantly. This could be the result of the different evaporation rates, capillary forces and interactions occurring in the different regions of the evolving system. This aspect should stimulate future research in this direction.

Figure 8. Comparison of the contraction in oleic acid (OA)-capped PbS QD assemblies during drying reported by (a) Weidman et al. (30%) and (b) S Maiti et al., (5%). (a): Adapted with permission from Ref. [29]. Copyright 2016, Springer Nature. (b): Adapted with permission. From Ref. [32]. Copyright 2018, American Chemical Society.
Epitaxial growth for superlattice formation of PbS QDs has been also investigated by GISAXS using a monolayer of PbS QDs serving as the substrate for the PbS QD superlattice formation [40]. Such layers allow for efficient electronic coupling, important for their application in devices [41][42]. Hence a very fundamental structural understanding is a key to fabricate heterostructures giving rise to desired properties.
An adlayer of PbS spherical nanocrystals was deposited onto a “template” made of either hexagonal or square periodically assembled PbS NCs and they were functionalized with copper β-tetraaminophtalocyanine (CuTAPc) ligands at room temperature. Figure 9 shows a schematic of the process of ligand induced assembly, where abbreviations SP and CP stand for spherical particle and cubic particle.
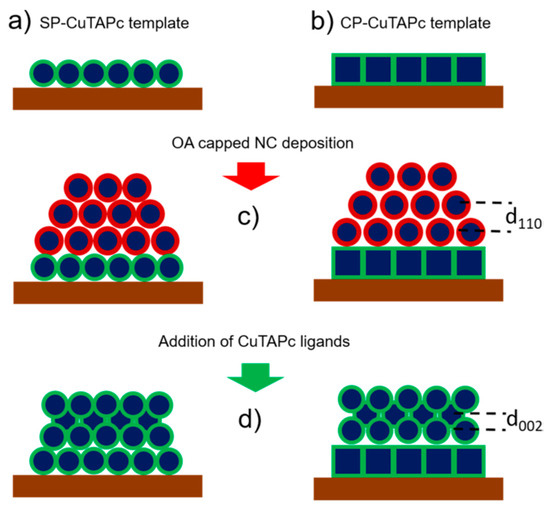
Figure 9. (a) A template of SP-CuTAPc ordered NCs and (b) A template of CP-CuTAPc ordered NCs. (c) sDeposition of OA capped NCs on the templates. (d) Ligand induced assembly. Reprinted with permission from Ref. [40]. Copyright 2019, American Chemical Society.
First, we will examine the GISAXS and GIXD profiles of PbS NC deposition on the SP-CuTAPc template. The GISAXS patterns (Figure 10) with the oleic acid capped ligands show a bct ordering of the superlattice with the [110]SL being perpendicular to the template. The GISAXS patterns for the ligand induced assembly has a bcc ordering of the superlattice with [002]SL normal to the template. The GISAXS patterns have distinct and pronounced spots which prove superlattice formation of the quantum dots.

Figure 10. GISAXS patterns of (a) OA-capped PbS SP NCs deposited on an SP template showing the bct ordering with [110]SL normal to the template and (b) ligand induced assembly for the SP-copper β-tetraaminophtalocyanine (CuTAPc) template showing the bcc ordering with [001]SL normal to the template. Reprinted with permission from Ref. [40]. Copyright 2019, American Chemical Society.
The authors show that the type of superlattice formed in the oleic acid capped PbS NC overlayer depends on the degree of interfacial mismatch between the template and the adlayer. A small positive mismatch value induced the bct superlattice formation (Figure 10a), while large negative mismatch induced fcc superlattice formation (Figure 11a). The two lattices transform in bcc structure upon the ligand exchange process, where oleic acid is exchanged for a short bifunctional (cross-linking) ligand (Figure 10b and Figure 11b). This structural change occurs via Bain-like distortion, where superlattice parameters changes and NCs rotation are triggered by the ligand exchange. All these changes can be greatly detected by the inspection of the GISAXS patterns.

Figure 11. GISAXS patterns of (a) OA-capped PbS SP NCs deposited on a CP template showing the fcc ordering with [111]SL normal to the template and (b) ligand induced assembly for the CP-CuTAPc template showing the bcc ordering with [001]SL normal to the template. Reprinted with permission from Ref. [40]. Copyright 2019, American Chemical Society.
GIXD patterns were used to investigate NC orientation inside the superlattice. The GIXD profiles for the OA capped NC superlattices grown on top of the hexagonal template show two diffraction peaks for the {111}NC planes and for the {200}NC planes of similar intensity (Figure 12a), suggesting no preferential atomic arrangement of the NCs. Upon ligand exchange, the 200 peak becomes dominant, indicating preferential atomic orientation induced by a strong in-plane interaction between {200}NC facets induced by ligand cross-linking.
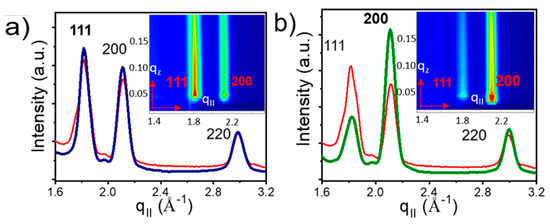
Figure 12. GIXD profiles of (a) deposited OA-capped PbS QDs with diffraction peaks observed for {111} and {200}, (b) ligand induced assembly for the SP-CuTAPc template where the dominant peak being {200}. Reprinted with permission from Ref. [40]. Copyright 2019, American Chemical Society.
In contrast to the SP-CuTAPc template, the CP-CuTAPc template shows the same scattering intensity before and after the ligand exchange, with a strong signal for the {200}NC planes (Figure 13), suggesting preferential atomic orientation already before ligand exchange is performed. This orientation is retained upon ligand exchange on the square template, as the GIXD signal does not change during the exchange process. These results provide clear proof that both the nature of the template and the ligand used strongly influence the self-assembly of the nanocrystals, allowing for tune packing, orientation and inter-planar distances of the superlattices.

Figure 13. GIXD profiles of (a) deposited CP with oleic acid capped ligands and (b) ligand induced assembly for the CP-CuTAPc template. They both show the same diffraction peak of {200}. Reprinted with permission from Ref. [40]. Copyright 2019, American Chemical Society.
5. Conclusion
In this chapter we have presented many recent examples from various research works wherein authors have used GISAXS/GIWAXS techniques to understand the formation and structure of superlattices of PbS quantum dots. The examples discussed here clearly show the potential of GISAXS and GIWAXS to study not only the structural details of the superlattices in a static manner, but most importantly the kinetic parameters during the superlattice evolution process. Key parameters such as interparticle distances, lattice parameters, tilt of lattice planes and tilt of particles as well as degree of lattice/particle alignment can all be obtained by GISAXS/GIWAXS analysis statically or dynamically, over time, temperature, vapor exposure etc. The evolution of these parameters with time and the extent of how much they change during the superlattice formation is a function of the processing conditions (i.e., evaporation rate), of the surface energies in the game (surface tensions and adsorption energies at the interfaces) and of the quantum dot size.
Even more relevant for the field of quantum dots assembly, the examples provided here show how GISAXS/GIWAXS can be employed to follow the structural transformations associated to the ligand exchange process. These experiments can be performed both at the solid–liquid and at the liquid–air interfaces. We believe that this particular application will enable scientific breakthrough in QD science, as it can provide valuable information on ligand conformation, ligand affinity towards the nanocrystals and anisotropic distribution/interaction.
Moreover, GISAXS/GIWAXS have also been used to study the growth of binary superlattices, which are another kind of superlattice, giving rise to interesting properties. [43][44][45] It is also important to mention that combining results coming from other techniques such as XRR, TEM, SEM and AFM with observations from GISAXS/GIWAXS can provide a very in-depth information about the thermodynamic and kinetics of the QD self-assembly process. We thus foresee that the use of GISAXS/GIWAXS, the development of specific mathematical models to simulate experimental patterns and coupling with macroscopic property measurements and other complementary techniques will keep increasing in the years to come, contributing to the increase in knowledge in QD science.
This entry is adapted from the peer-reviewed paper 10.3390/nano10112240
References
- Pöttler, M.; Cicha, I.; Unterweger, H.; Janko, C.; Friedrich, R.P.; Alexiou, C. Nanoparticles for regenerative medicine. Nanomedicine 2019, 14, 1929–1933.
- Lui, C.N.P.; Tsui, Y.P.; Ho, A.S.L.; Shum, D.K.Y.; Chan, Y.S.; Wu, C.T.; Li, H.W.; Tsang, S.C.E.; Yung, K.K.L. neural stem cells harvested from live brains by antibody-conjugated magnetic nanoparticles. Angew. Chemie Int. Ed. 2013, 52, 12298–12302.
- Chou, P.; Chen, H.; Liu, I.; Chen, C.; Liou, J. Nitrogen oxide (NO2) gas sensing performance of. IEEE Sens. J. 2015, 15, 3759–3763.
- Guo, T.; Lin, M.; Huang, J.; Zhou, C.; Tian, W.; Yu, H.; Jiang, X.; Ye, J.; Shi, Y.; Xiao, Y.; et al. The recent advances of magnetic nanoparticles in medicine. J. Nanomater. 2018, 2018.
- Liu, R.; Lal, R. Potentials of engineered nanoparticles as fertilizers for increasing agronomic productions. Sci. Total Environ. 2015, 514, 131–139.
- Nair, R.; Varghese, S.H.; Nair, B.G.; Maekawa, T.; Yoshida, Y.; Kumar, D.S. Nanoparticulate material delivery to plants. Plant Sci. 2010, 179, 154–163.
- Muhamad, N.; Plengsuriyakarn, T.; Na-Bangchang, K. Application of active targeting nanoparticle delivery system for chemotherapeutic drugs and traditional/herbal medicines in cancer therapy: A systematic review. Int. J. Nanomed. 2018, 13, 3921–3935.
- Pérez-López, B.; Merkoçi, A. Nanoparticles for the development of improved (Bio)sensing systems. Anal. Bioanal. Chem. 2011, 399, 1577–1590.
- Bashouti, M.Y.; De La Zerda, A.S.; Geva, D.; Haick, H. Designing thin film-capped metallic nanoparticles configurations for sensing applications. J. Phys. Chem. C 2014, 118, 1903–1909.
- Weir, A.; Westerhoff, P.; Fabricius, L.; Hristovski, K.; Von Goetz, N. Titanium dioxide nanoparticles in food and personal care products. Environ. Sci. Technol. 2012, 46, 2242–2250.
- Ruiz-Hitzky, E.; Darder, M.; Aranda, P.; Ariga, K. Advances in biomimetic and nanostructured biohybrid materials. Adv. Mater. 2010, 22, 323–336.
- Hajipour, M.J.; Fromm, K.M.; Akbar Ashkarran, A.; Jimenez de Aberasturi, D.; de Larramendi, I.R.; Rojo, T.; Serpooshan, V.; Parak, W.J.; Mahmoudi, M. Antibacterial properties of nanoparticles. Trends Biotechnol. 2012, 30, 499–511.
- Kango, S.; Kalia, S.; Celli, A.; Njuguna, J.; Habibi, Y.; Kumar, R. Surface modification of inorganic nanoparticles for development of organic-inorganic nanocomposites—A review. Prog. Polym. Sci. 2013, 38, 1232–1261.
- Baskoutas, S.; Terzis, A.F. Size-dependent band gap of colloidal quantum dots. J. Appl. Phys. 2006, 99, 013708.
- Erni, R.; Browning, N.D. Quantification of the size-dependent energy gap of individual cdse quantum dots by valence electron energy-loss spectroscopy. Ultramicroscopy 2007, 107, 267–273.
- Barbagiovanni, E.G.; Lockwood, D.J.; Simpson, P.J.; Goncharova, L.V. Quantum confinement in Si and Ge nanostructures: Theory and experiment. Appl. Phys. Rev. 2014, 1, 011302.
- Resch-Genger, U.; Grabolle, M.; Cavaliere-Jaricot, S.; Nitschke, R.; Nann, T. Quantum dots versus organic dyes as fluorescent labels. Nat. Methods 2008, 5, 763–775.
- Grabolle, M.; Spieles, M.; Lesnyak, V.; Gaponik, N.; Eychmüller, A.; Resch-Genger, U. Determination of the fluorescence quantum yield of quantum dots: Suitable procedures and achievable uncertainties. Anal. Chem. 2009, 81, 6285–6294.
- Zheng, J.; Zhang, C.; Dickson, R.M. Highly fluorescent, water-soluble, size-tunable gold quantum dots. Phys. Rev. Lett. 2004, 93, 5–8.
- Jin, Y.; Gao, X. Plasmonic fluorescent quantum dots. Nat. Nanotechnol. 2009, 4, 571–576.
- Rivoire, K.; Buckley, S.; Song, Y.; Lee, M.L.; Vučković, J. Photoluminescence from In 0.5Ga 0.5As/GaP quantum dots coupled to photonic crystal cavities. Phys. Rev. B Condens. Matter Mater. Phys. 2012, 85, 1–5.
- Cao, A.; Liu, Z.; Chu, S.; Wu, M.; Ye, Z.; Cai, Z.; Chang, Y.; Wang, S.; Gong, Q.; Liu, Y. A facile one-step method to produce craphene-cds quantum dot nanocomposites as promising optoelectronic materials. Adv. Mater. 2010, 22, 103–106.
- Park, Y.J.; Kim, M.; Song, A.; Kim, J.Y.; Chung, K.B.; Walker, B.; Seo, J.H.; Wang, D.H. Light-emitting transistors with high color purity using perovskite quantum dot emitters. ACS Appl. Mater. Interfaces 2020, 12, 35175–35180.
- Bhattacharya, B.P.; Mi, Z. Quantum-dot optoelectronic devices. Proc. IEEE 2007, 95, 1723–1740.
- Boles, M.A.; Engel, M.; Talapin, D.V. Self-assembly of colloidal nanocrystals: From intricate structures to functional materials. Chem. Rev. 2016, 116, 11220–11289.
- Balazs, D.M.; Loi, M.A. Lead-chalcogenide colloidal-quantum-dot solids: Novel assembly methods, electronic structure control, and application prospects. Adv. Mater. 2018, 30, 1800082.
- Josten, E.; Wetterskog, E.; Glavic, A.; Boesecke, P.; Feoktystov, A.; Brauweiler-Reuters, E.; Rücker, U.; Salazar-Alvarez, G.; Brückel, T.; Bergstrm, L. Superlattice growth and rearrangement during evaporation-induced nanoparticle self-assembly. Sci. Rep. 2017, 7, 1–9.
- Corricelli, M.; Altamura, D.; Curri, M.L.; Sibillano, T.; Siliqi, D.; Mazzone, A.; Depalo, N.; Fanizza, E.; Zanchet, D.; Giannini, C.; et al. GISAXS and GIWAXS study on self-assembling processes of nanoparticle based superlattices. CrystEngComm 2014, 16, 9482–9492.
- Weidman, M.C.; Smilgies, D.M.; Tisdale, W.A. Kinetics of the self-assembly of nanocrystal superlattices measured by real-time in situ X-Ray scattering. Nat. Mater. 2016, 15, 775–781.
- Wan, Y.; Goubet, N.; Albouy, P.A.; Schaeffer, N.; Pileni, M.P. Hierarchy in Au nanocrystal ordering in a supracrystal: II. control of interparticle distances. Langmuir 2013, 29, 13576–13581.
- Corricelli, M.; Depalo, N.; Fanizza, E.; Altamura, D.; Giannini, C.; Siliqi, D.; Di Mundo, R.; Palumbo, F.; Kravets, V.G.; Grigorenko, A.N.; et al. Two-dimensional plasmonic superlattice based on Au nanoparticles self-assembling onto a functionalized substrate. J. Phys. Chem. C 2014, 118, 7579–7590.
- Maiti, S.; André, A.; Banerjee, R.; Hagenlocher, J.; Konovalov, O.; Schreiber, F.; Scheele, M. Monitoring self-assembly and ligand exchange of pbs nanocrystal superlattices at the liquid/air interface in real time. J. Phys. Chem. Lett. 2018, 9, 739–744.
- Kim, T.; Palmiano, E.; Liang, R.Z.; Hu, H.; Murali, B.; Kirmani, A.R.; Firdaus, Y.; Gao, Y.; Sheikh, A.; Yuan, M.; et al. Hybrid tandem quantum dot/organic photovoltaic cells with complementary near infrared absorption. Appl. Phys. Lett. 2017, 110, 1–5.
- Zhao, G.; Cai, Q.; Liu, X.; Li, P.; Zhang, Y.; Shao, G.; Liang, C. PbS QDs as electron blocking layer toward efficient and stable perovskite solar cells. IEEE J. Photovolt. 2019, 9, 194–199.
- Konstantatos, G.; Howard, I.; Fischer, A.; Hoogland, S.; Clifford, J.; Klem, E.; Levina, L.; Sargent, E.H. Ultrasensitive solution-cast quantum dot photodetectors. Nature 2006, 442, 180–183.
- Balazs, D.M.; Dirin, D.N.; Fang, H.H.; Protesescu, L.; Ten Brink, G.H.; Kooi, B.J.; Kovalenko, M.V.; Loi, M.A. Counterion-mediated ligand exchange for pbs colloidal quantum dot superlattices. ACS Nano 2015, 9, 11951–11959.
- Bian, K.; Choi, J.J.; Kaushik, A.; Clancy, P.; Smilgies, D.M.; Hanrath, T. Shape-anisotropy driven symmetry transformations in nanocrystal superlattice polymorphs. ACS Nano 2011, 5, 2815–2823.
- Keune, W. Observation of the Fcc-to-Bcc Bain transformation in epitaxial fe ultrathin films on Cu3Au (001). Surf. Sci. 2016, 493, 338–360.
- Goodfellow, B.W.; Yu, Y.; Bosoy, C.A.; Smilgies, D.M.; Korgel, B.A. The role of ligand packing frustration in body-centered cubic (bcc) superlattices of colloidal nanocrystals. J. Phys. Chem. Lett. 2015, 6, 2406–2412.
- Maiti, S.; André, A.; Maiti, S.; Hodas, M.; Jankowski, M.; Scheele, M.; Schreiber, F. Revealing structure and crystallographic orientation of soft epitaxial assembly of nanocrystals by grazing incidence x-ray scattering. J. Phys. Chem. Lett. 2019, 10, 6324–6330.
- Milliron, D.; Hughes, S.M.; Cui, Y.; Manna, L.; Li, J.; Wang, L.W.; Alivisatos, A.P. Colloidal nanocrystal heterostructures with linear and branched topology. Nature 2004, 430, 190–195.
- Whitham, K.; Yang, J.; Savitzky, B.H.; Kourkoutis, L.F.; Wise, F.; Hanrath, T. Charge transport and localization in atomically coherent quantum dot solids. Nat. Mater. 2016, 15, 557–563.
- Brittman, S.; Mahadik, N.A.; Qadri, S.B.; Yee, P.Y.; Tischler, J.G.; Boercker, J.E. Binary superlattices of infrared plasmonic and excitonic nanocrystals. ACS Appl. Mater. Interfaces 2020, 12, 24271–24280.
- Dong, A.; Chen, J.; Vora, P.M.; Kikkawa, J.M.; Murray, C.B. Binary nanocrystal superlattice membranes self-assembled at the liquid-air interface. Nature 2010, 466, 474–477.
- Dong, D.; Yap, L.W.; Smilgies, D.M.; Si, K.J.; Shi, Q.; Cheng, W. Two-dimensional gold trisoctahedron nanoparticle superlattice sheets: Self-assembly, characterization and immunosensing applications. Nanoscale 2018, 10, 5065–5071.