Your browser does not fully support modern features. Please upgrade for a smoother experience.
Please note this is an old version of this entry, which may differ significantly from the current revision.
Subjects:
Economics
There is growing recognition of the role of forest carbon sinks in offsetting carbon emissions to reduce the threat of global warming. One example of this recognition is the International Union for Conservation of Nature (IUCN)-initiated Bonn Challenge which has committed to the restoration of 350 million hectares of forest by 2030, estimated to have the potential to sequester up to 14% of global carbon emissions.
- carbon neutrality
- forest
- carbon sinks
- scenario analysis
- China
1. Historical Assessment of Carbon Sequestration Capacity by Forest Carbon Sinks in China
Since the founding of the People’s Republic of China, nine national forest resource inventories have been performed. The first was from 1973 to 1976. Beginning in 1977, the forest resources inventory has been conducted every five years, and the ninth was from 2014 to 2018. As a result, we have one value for the forest volume for each five-year period, i.e., the data on forest volume remains essentially the same for each five-year interval.
With forest volume, we can calculate China’s forest carbon reserves every five years, and then use the difference between the forest carbon reserves in two periods to obtain the carbon sinks capacity of China’s forest carbon reserves during this forest resource inventory period. In this way, we can get the annual data on forest carbon sink levels in China. From 1973 to 2018, China’s forest carbon sink capacity averaged 280 million tons of carbon per year, equivalent to 1.03 billion tons of carbon dioxide sequestration per year (one ton of carbon equals 3.67 tons of carbon dioxide).
2. Future Characteristics of China’s Forest Carbon by Carbon Sink Sequestration Capacity
By bringing China’s forest volume and forestry investment data from 2020 to 2100 in the routine, accelerated, and strengthened ecological civilization scenarios, we can get the forest carbon sink level from 2020 to 2100, and we can then calculate the growth rate of the forest carbon sinks in corresponding scenarios, as shown in Figure 1.
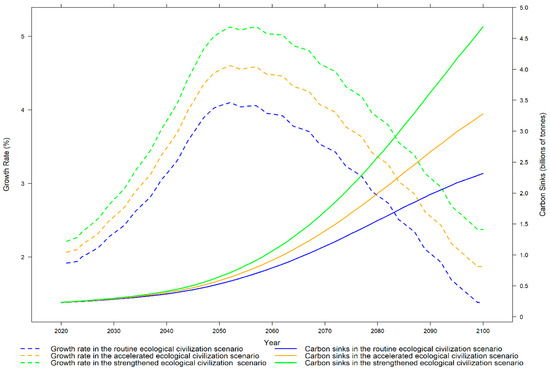
Figure 1. Forest carbon sinks and their growth rates in China under different scenarios (in billion tons of carbon and %).
According to Figure 1, under the routine, accelerated, and strengthened ecological civilization scenarios, the level of forest carbon sinks in China is not obvious from 2020 to 2050. Beyond 2050, the difference becomes apparent. We found the following results.
3. Growth Trend and Characteristics of Forest Carbon Sinks in China
The level of forest carbon sinks in China will increase under the different scenarios, and the differences between scenarios will widen over time. For example, the forest carbon sink levels in China will be 0.230, 0.231, and 0.233 billion tons of carbon in the routine, accelerated, and strengthened ecological civilization scenario in 2020. The difference between the accelerated ecological civilization scenario and the routine ecological civilization scenario is about 0.001 billion tons of carbon and the difference between the strengthened ecological civilization scenario and the accelerated ecological civilization scenario is about 0.002 billion tons of carbon; China’s forest carbon sinks will increase to 0.281, 0.289, and 0.296 billion tons of carbon by 2030 in the three scenarios and the difference between the accelerated ecological civilization scenario and the routine ecological civilization scenario or between the strengthened ecological civilization scenario and the accelerated ecological civilization scenario will increase to about 0.007 billion tons of carbon.
By 2050, China’s forest carbon sink levels will grow to 0.531, 0.584, and 0.645 billion tons of carbon in the three scenarios and the difference between the accelerated ecological civilization scenario and the routine ecological civilization scenario or between the strengthened ecological civilization scenario and the accelerated ecological civilization scenario will be greater than 0.05 billion tons of carbon. By 2100, China’s forest carbon sinks levels will rise to 2.32, 3.28, and 4.69 billion tons of carbon in the three scenarios and the difference between the accelerated ecological civilization scenario and the routine ecological civilization scenario or between the strengthened ecological civilization scenario and the accelerated ecological civilization scenario will be more than 0.9 billion tons of carbon. These changes reflect that the level of forest carbon sinks in China will greatly increase in the process of ecological civilization construction. Furthermore, with the accumulation of ecological construction under different scenarios, the difference in forest carbon sink levels will increase in all scenarios. Under the scenario of strengthened ecological civilization, China’s forest carbon sinks will be the highest, followed by the accelerated ecological civilization scenario, and lowest under the routine ecological civilization scenario.
4. Characteristics of Forest Carbon Sinks Growth
For each of the three scenarios, China’s forest carbon sinks growth rate shows a rising trend that peaks around 2050 and then subsequently declines. To achieve the basic goal of environmental governance with a fundamentally improved ecological environment by 2035 along with the more ambitious goal of environmental governance by 2050, each of our scenarios assumes that China will continue to strengthen ecological investment including forestry investment. Once those goals are achieved in 2050, the growth rate of forestry investment will taper off. Therefore, the growth rate of the forest carbon sinks in China can be assumed to initially increase and then decrease in all three scenarios.
As seen in Figure 1 the growth rates of forest carbon sinks in 2021 are 1.92%, 2.07%, and 2.21% under the routine, accelerated, and strengthened ecological civilization scenarios, and by 2050, the growth rates increase to the highest rates—4.19%, 4.68%, and 5.20%—under the three scenarios, but by 2100 the growth rate falls back to 1.38%, 1.87%, and 2.38%. Because forestry investment is growing fastest under the scenario of strengthened ecological civilization, forest volume is also the largest, leading to the highest average growth rate of forest carbon sinks from 2018 to 2100 (3.83%), followed by the accelerated ecological civilization scenario (3.38%), and then by the routine ecological civilization scenario (2.94%).
In addition, the difference in forest carbon sinks in different scenarios tends to widen over time. If we divide the growth rate of China’s forest carbon sinks in the accelerated ecological civilization scenario by the growth rate of the routine ecological civilization scenario (this ratio is recorded as R1) and divide the growth rate of China’s forest carbon sink in strengthened ecological civilization by the growth rate under the accelerated ecological civilization scenario (this ratio is recorded as R2), we find that there is an increasing trend in these ratios. R1 increases by 25.7%, from 1.077 in 2021 to 1.3533 in 2100, and R2 increases by 18.6%, from 1.071 in 2021 to 1.2703 in 2100.
5. Using Forest Carbon Sinks to Achieve Carbon Neutrality
Xu et al. [52] made use of scenario analysis along with data on the carbon emission factors for coal, oil, and gas to determine China’s CO2 emissions peak. In this section we combine their estimates for when China’s carbon emissions will peak with our forecast of China’s carbon sinks to determine when China will achieve carbon neutrality. By combining forecasts of future carbon emissions generated by energy use with our own forecast for the emissions offset by carbon sinks, we predict that this goal can be achieved by 2060 or before. Note that their scenarios are distinct from ours. They consider how various growth trajectories affect the peak year for carbon emissions. Our scenarios, on the other hand, consider how various forestry investment trajectories affect the future carbon sinks.
The scenarios in Xu et al. [52] are reproduced in Table 1, with their CO2 emissions converted to carbon emissions by dividing CO2 emissions by 3.67.
Table 1. Overview of China’s carbon peaking.
| Scenario | Carbon Peak Year | Carbon Volume (Billions of Tonnes of Carbon) |
|---|---|---|
| Low growth | 2029 | 2.75 |
| Benchmark moderate growth | 2031 | 2.94 |
| High growth | 2035 | 3.17 |
If we extrapolate the predictions under each of their scenarios beyond the peak dates to 2050 and then take the average, we obtain an average carbon emissions value of 0.77 billion tons for 2050. This value represents the overall picture of China’s carbon emissions in 2050. Since emissions would have peaked under all three scenarios by the mid-2030s, this picture means that China’s total carbon emissions will be less than 0.77 billion tons from 2050 to 2060.
Based on this amount, we can get the approximate year in which the forest carbon sink level in China exceeds 0.77 billion tons of carbon under the routine, accelerated, and strengthened ecological civilization scenarios. China’s forest carbon sink levels will exceed 0.77 billion tons of carbon in 2060 (0.789 billion tons of carbon), 2057 (0.798 billion tons of carbon), and 2054 (0.797 billion tons of carbon). If we consider the continuous adjustment of energy consumption structure to 2060, carbon emissions must be less than 0.77 billion tons in 2060, 2057, and 2054.
These figures illustrate that under the continuous low-carbon adjustment of energy consumption structure, giving full play to the carbon sequestration effect of forest carbon sinks on carbon emissions, China can achieve carbon neutrality before 2060.
4.3. Comparison with Other Studies
This result expands the current analysis of the long-term change in forest carbon sinks in China. Compared with Ke et al. [11], the novelty of the results of this article is mainly reflected in the following aspects:
First, the analysis period is long. They analyzed the trend of changes to 2060, while we analyzed the trend of changes to 2100, and this better provides the long-term changes and patterns of forest carbon sinks in China.
Second, different influencing factors are considered. We mainly consider direct factors that affect China’s forest carbon sinks, such as forest investment and forest stock, while they mainly consider indirect factors such as carbon prices. However, the Chinese carbon market has not yet formed a reasonable carbon price mechanism, and carbon prices may not be sufficient to reflect the impact of forest carbon sink development.
Third, the long-term prediction results are significantly different. They seriously overestimated the potential of China’s forest carbon sequestration. They believe that from 2021 to 2060, China’s average annual forest carbon sequestration is 0.170 billion tons of carbon, while our research is roughly 0.150 billion tons. They did not study the situation after 2060, but our research found that China’s average annual carbon sinks showed a significant growth trend from 2060 to 2100, but the growth rate would decrease slightly compared to the average growth rate from 2021 to 2060.
Fourth, they did not consider whether China could achieve carbon neutrality by 2060 through forest carbon sinks. In contrast, our research found that China could achieve carbon neutrality as early as 2054 through the role of forest carbon sinks. It should be noted that the process of carbon neutrality requires carbon reduction through a clean transformation of the energy structure, and also the carbon neutrality effect of forest carbon sinks.
From these differences, it can be seen that this article can clearly identify the important role of forest carbon sinks in carbon neutrality in China, and can also accurately analyze the important impact of forest investment and forest stock on forest carbon sequestration.
This entry is adapted from the peer-reviewed paper 10.3390/land12071325
References
- 11. Ke, S.; Zhang, Z.; Wang, Y.; China’s forest carbon sinks and mitigation potential from carbon sequestration trading perspective. Ecol. Indic. 2023, 148, 110054, .
- 52. Xu, G.; Schwarz, P.; Yang, H.; Determining China’s CO2 emissions peak with a dynamic nonlinear artificial neural network approach and scenario analysis. Energy Policy 2019, 128, 752–762, .
This entry is offline, you can click here to edit this entry!