In this era, the electricity demand is increasing enormously due to rapid expansion in technologies. Day by day, human beings are looking for a maintained and comfortable lifestyle. Nowadays, the maximum electricity demand is fulfilled by conventional energy sources. As the availability of conventional sources is very limited, governments should switch toward renewable sources to fulfill the increasing demand. Over the past few decades, every country has faced enormous problems regarding environmental pollution, and one of its main causes is the power sector as it consumes a huge number of conventional resources. To mitigate this issue, the power network has introduced a vast area for the renewable power sector. The main attention of the power sector is grabbed by renewable energy as it causes much fewer environmental issues compared to conventional energy. The growing concern of society regarding nature and the harsh effect of emissions in the power sector has pushed strategies to increase the scope of renewable energy in the electricity market. Power generated from renewable energy sources causes minor pollutants from decarbonization-generating technologies
[1]. According to the United States Environmental Protection Agency, greenhouse gases are one of the major air-polluting agents. The electrical power sector was responsible for 25% of total greenhouse gas emissions, which was the second largest share of greenhouse gas emissions in the USA in 2020
[2]. Although the figures are specificallyfrom the USA, further studies reveal that almost similar trends are followed throughout the world. To counter environmental pollution, the engagement of renewable power generation has become a necessity. Among the different renewable sources, wind, solar, and hydropower deserve special mention due to their clean, reliable, and versatile nature for long-term usage. There are many other advantages of using a renewable source, such as reduced tariffs, reduced pollution levels, etc. In 2020, around 29% of power was generated from renewable sources, and 256 GW capacity of renewable power has been newly added worldwide. Despite having huge potential for renewable generation, India has exploited a very small amount of the total capacity
[3]. The government of India (GOI) set an aim to generate 175 GW of power from renewable sources by 2022, of which 100 GW from solar, 60 GW from wind, and the rest from other renewable sources
[4]. To encourage the citizens of India to use renewable energy, the GOI has launched several subsidy policies for renewable power installation.
In the past few decades, researchers have mainly focused on wind, hydro, and solar-power-generation techniques. Ming et al.
[5] focus on the policy barrier, status, and tools for hydro energy in China. The benefits and scenarios of small hydropower plants were displayed in
[6] for the year 2014. Mishra et al.
[7] examined the present status and plans of small hydro in the Indian power sector. In recent times, many countries’ governments have focused on small hydropower plants for electricity production. The present and past scenarios of hydropower were exploited in
[8][9][10][11] for Pakistan, Malaysia, and Thailand, respectively. The status of the hydropower plant in the western Himalayas region (Jammu and Kashmir) was displayed by Sharma et al. in
[12][13]. The author of
[14] illustrated a review of ultra-modern computational optimization techniques in sustainable and renewable energy. This offered a clear image of the newest research achievements in the arena of sustainable energy. Ashwani et al.
[15] focused on the outline of India’s renewable energy sources and their opportunities, as well as their current status, availability, and notable achievements.
2. Renewable Power Plant Scenarios
2.1. Hydroelectric Power Plant
In a hydropower plant, a reservoir and a dam are constructed to store the water and release it when required. When water falls from a height, then potential energy is converted into kinetic energy, which gives a great thrust to the turbine present at the power plant. Dams are mainly constructed in mountain areas where they can properly achieve the head difference between the upper and lower basin. The turbine rotates the shafts and in turn, electricity is produced. The catchment area is the entire space behind the dam, draining into a waterway through which the dam has been constructed at an appropriate place. The reservoir is a huge gathering of water behind a hydropower dam and delivers water uniformly to the turbine over the year to generate electricity. A surge tank is placed in the lower channel end area of a feeder, barrage pipe, and closed conduit to absorb unexpected rises in pressure and speedily supply necessary water
[21].
Recently, a new kind of hydropower generator has been introduced. This type of generator uses the vortex present in the water to turn the turbine and generate electricity
[22]. This generator can be located even at lesser natural altitudes, which is an additional advantage of this kind of generator. Conventional generators need ample water heads to produce the required thrust. However, most of the rivers in India do not have enough water throughout the year, apart from during the monsoon period. If instances of turbulence are to be assumed, then this type of generator might receive massive demand in the future.
The hydropower plant is not only considered a resource to produce electricity, but they also do not contaminate the air, soil, and water like other power plants. Hydroelectric power plays a ruling part in the development of the world’s power sector. Both the small and large hydropower industries remained contributors to the power industry. The world’s first hydropower plant started its commercial operation in the year 1882, on the Fox River in Wisconsin, USA
[23].
Table 1 presents the largest hydropower plant in the world as of December 2022
[24]. Three Gorges is the leading hydropower plant in the globe. Its construction started in 1993, and it took almost 20 years to complete, with the largest capacity of 22.5 GW. It is 181 m tall and 2335 m wide. The yearly estimated power production of this hydropower plant is 85 TWh. It is maintained and functioned by China Three Gorges Corporation (CTGC). For operation, it uses the water of the Yangtze River.
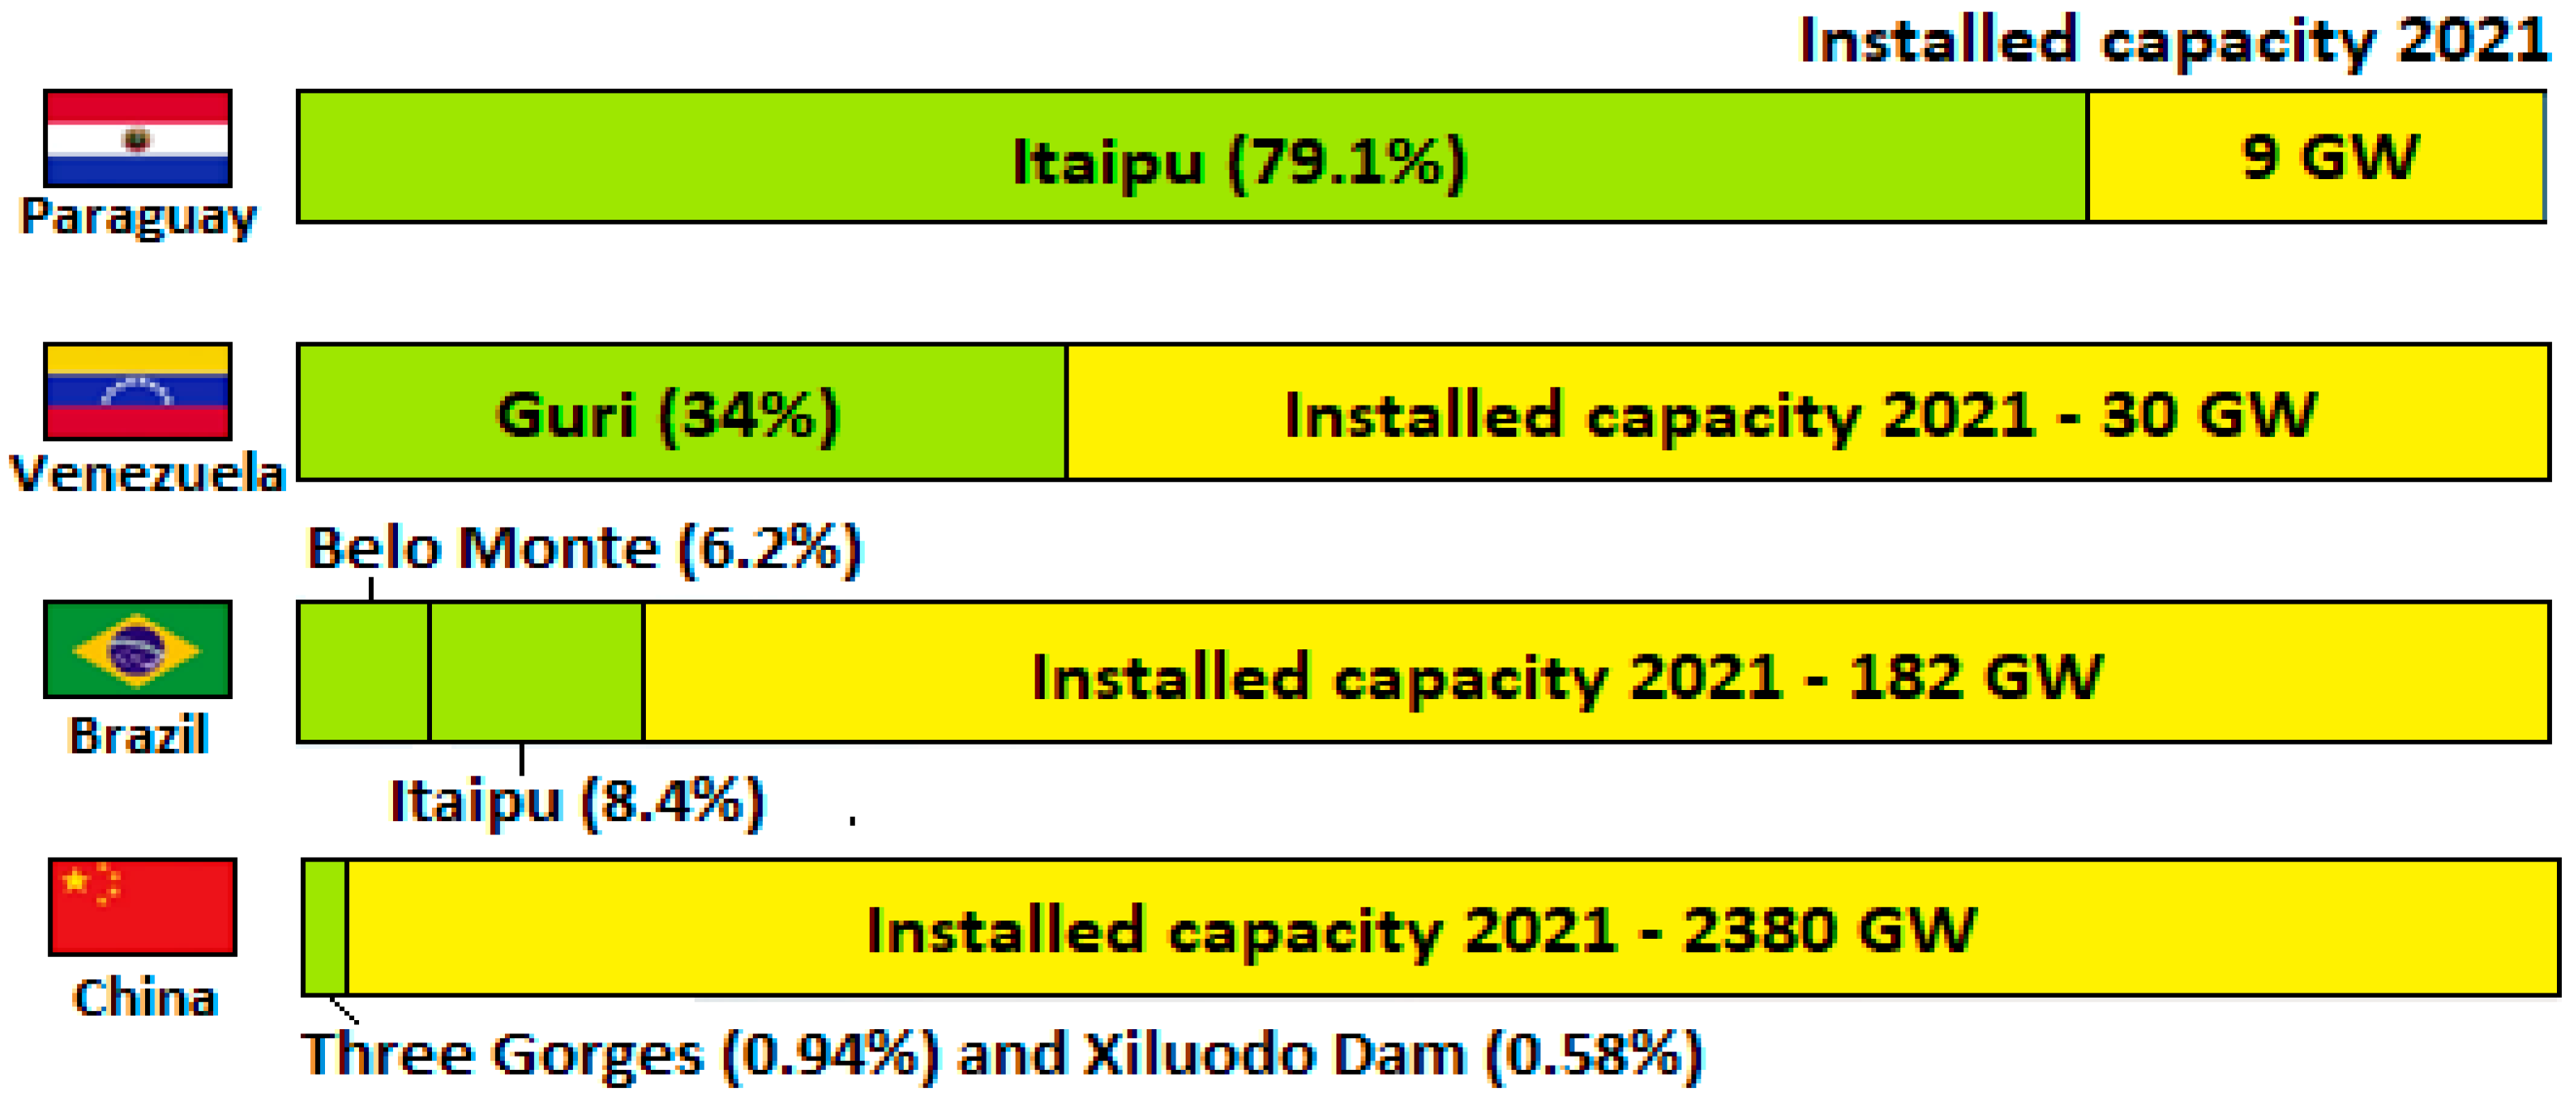
Figure 1 depicts the dam’s contribution to the country’s electricity capacity for Paraguay, Venezuela, Brazil, and China.
Figure 1. Dam’s Contribution to Country’s Electricity Capacity.
Table 1. Biggest Hydroelectric Power Plants in World (as of December 2022).
India’s first hydropower plant was built in 1897 in Darjeeling, West Bengal. The overall expected potential of India in the hydro sector is 145,000 MW with a load factor of 60%. The hydropower sector has exploited about 26% of the potential and around 85,000 MW demand so far in India
[25].
2.2. Wind Power Plant
Wind turbines are a recent version of windmills, which avail the power of the wind to produce electrical energy. In a wind farm, the observable parts are towering turbines. The turbines consist of sets of blades, shafts, and a control box beside them that contains a bearing, hub, hydraulics, gearbox, inverter, rotor, and generator, which is called a nacelle
[26]. The spinning of blades due to wind flow creates kinetic energy. The rotating blades allow the shaft, which is attached to the nacelle, to turn, and the generators in the nacelle convert kinetic energy into electrical energy. The wind turbine can be operated at any wind speed, from very low to very high wind. Around 80% of the time, it can generate electricity but not always at full capacity
[27].
Wind farms need to be situated in the breeziest place to opt for extreme energy, which will let them produce the best output. They are more oftenseen at hilltop or coastal regions. Wind farms that are located in coastal regions or the seaside are called offshore wind farms, and wind farms that are situated in drylands are called onshore wind farms
[28]. The Haliade-X wind turbine is a new-generation wind turbine, declared to be the furthermost powerful offshore wind turbine
[29]. The world’s first known wind turbine was created by Prof. James Blyth of Anderson’s College, Scotland to produce electricity. The cloth-sailed wind turbine had a height of 10 m. It was used to charge accumulators for lighting cottages
[30]. The details of the world’s ten largest wind farms are depicted in
Table 2.
Table 2. Biggest Wind Farms in World (as of August 2022).
2.3. Solar Power Plant
Solar is considered an infinite energy source. Solar power converts sunlight into electrical power either through mirrors or through photovoltaic (PV) panels. This energy can be stored in batteries or used to generate electricity. Solar panels are mainly made up of silicon or germanium, which is usually mounted in a metal panel with a glass covering. When the small particles of light or photons hit the fine silicon or germanium surface of the solar panel, they strike electrons off the silicon atoms. Solar power is considered to be clean energy as it does not create any harmful greenhouse gas.
It has great efficiency with operating times of more than 25 years. The carbon footprint of a solar panel is very small. The material used in a solar panel is recyclable, so the carbon footprint continues to shrink
[31]. NTPC has commissioned India’s largest floating solar power project in Ramagundam with a capacity of 100 MW. It has an eco-friendly nature and advanced technology.
In 1839, a French physicist, Edmond Becquerel, discovered a PV effect during the conduction of an experiment with a metal cell’s electrodes in a conducting compound solution. The cell generated more energy when kept direct under sunlight
[32]. Tengger solar park is known as the ‘the great wall of Solar’ and is located in Zhongwei, Ningxia, China. This power plant is owned by China National Grid and the Zhongwei Power Supply Company. The project started in 2012 and was completed in 2017. The biggest solar power plant details in the world are displayed in
Table 3 [33].
Table 3. Biggest Solar Power Plants in World.
3. Global Power Scenario
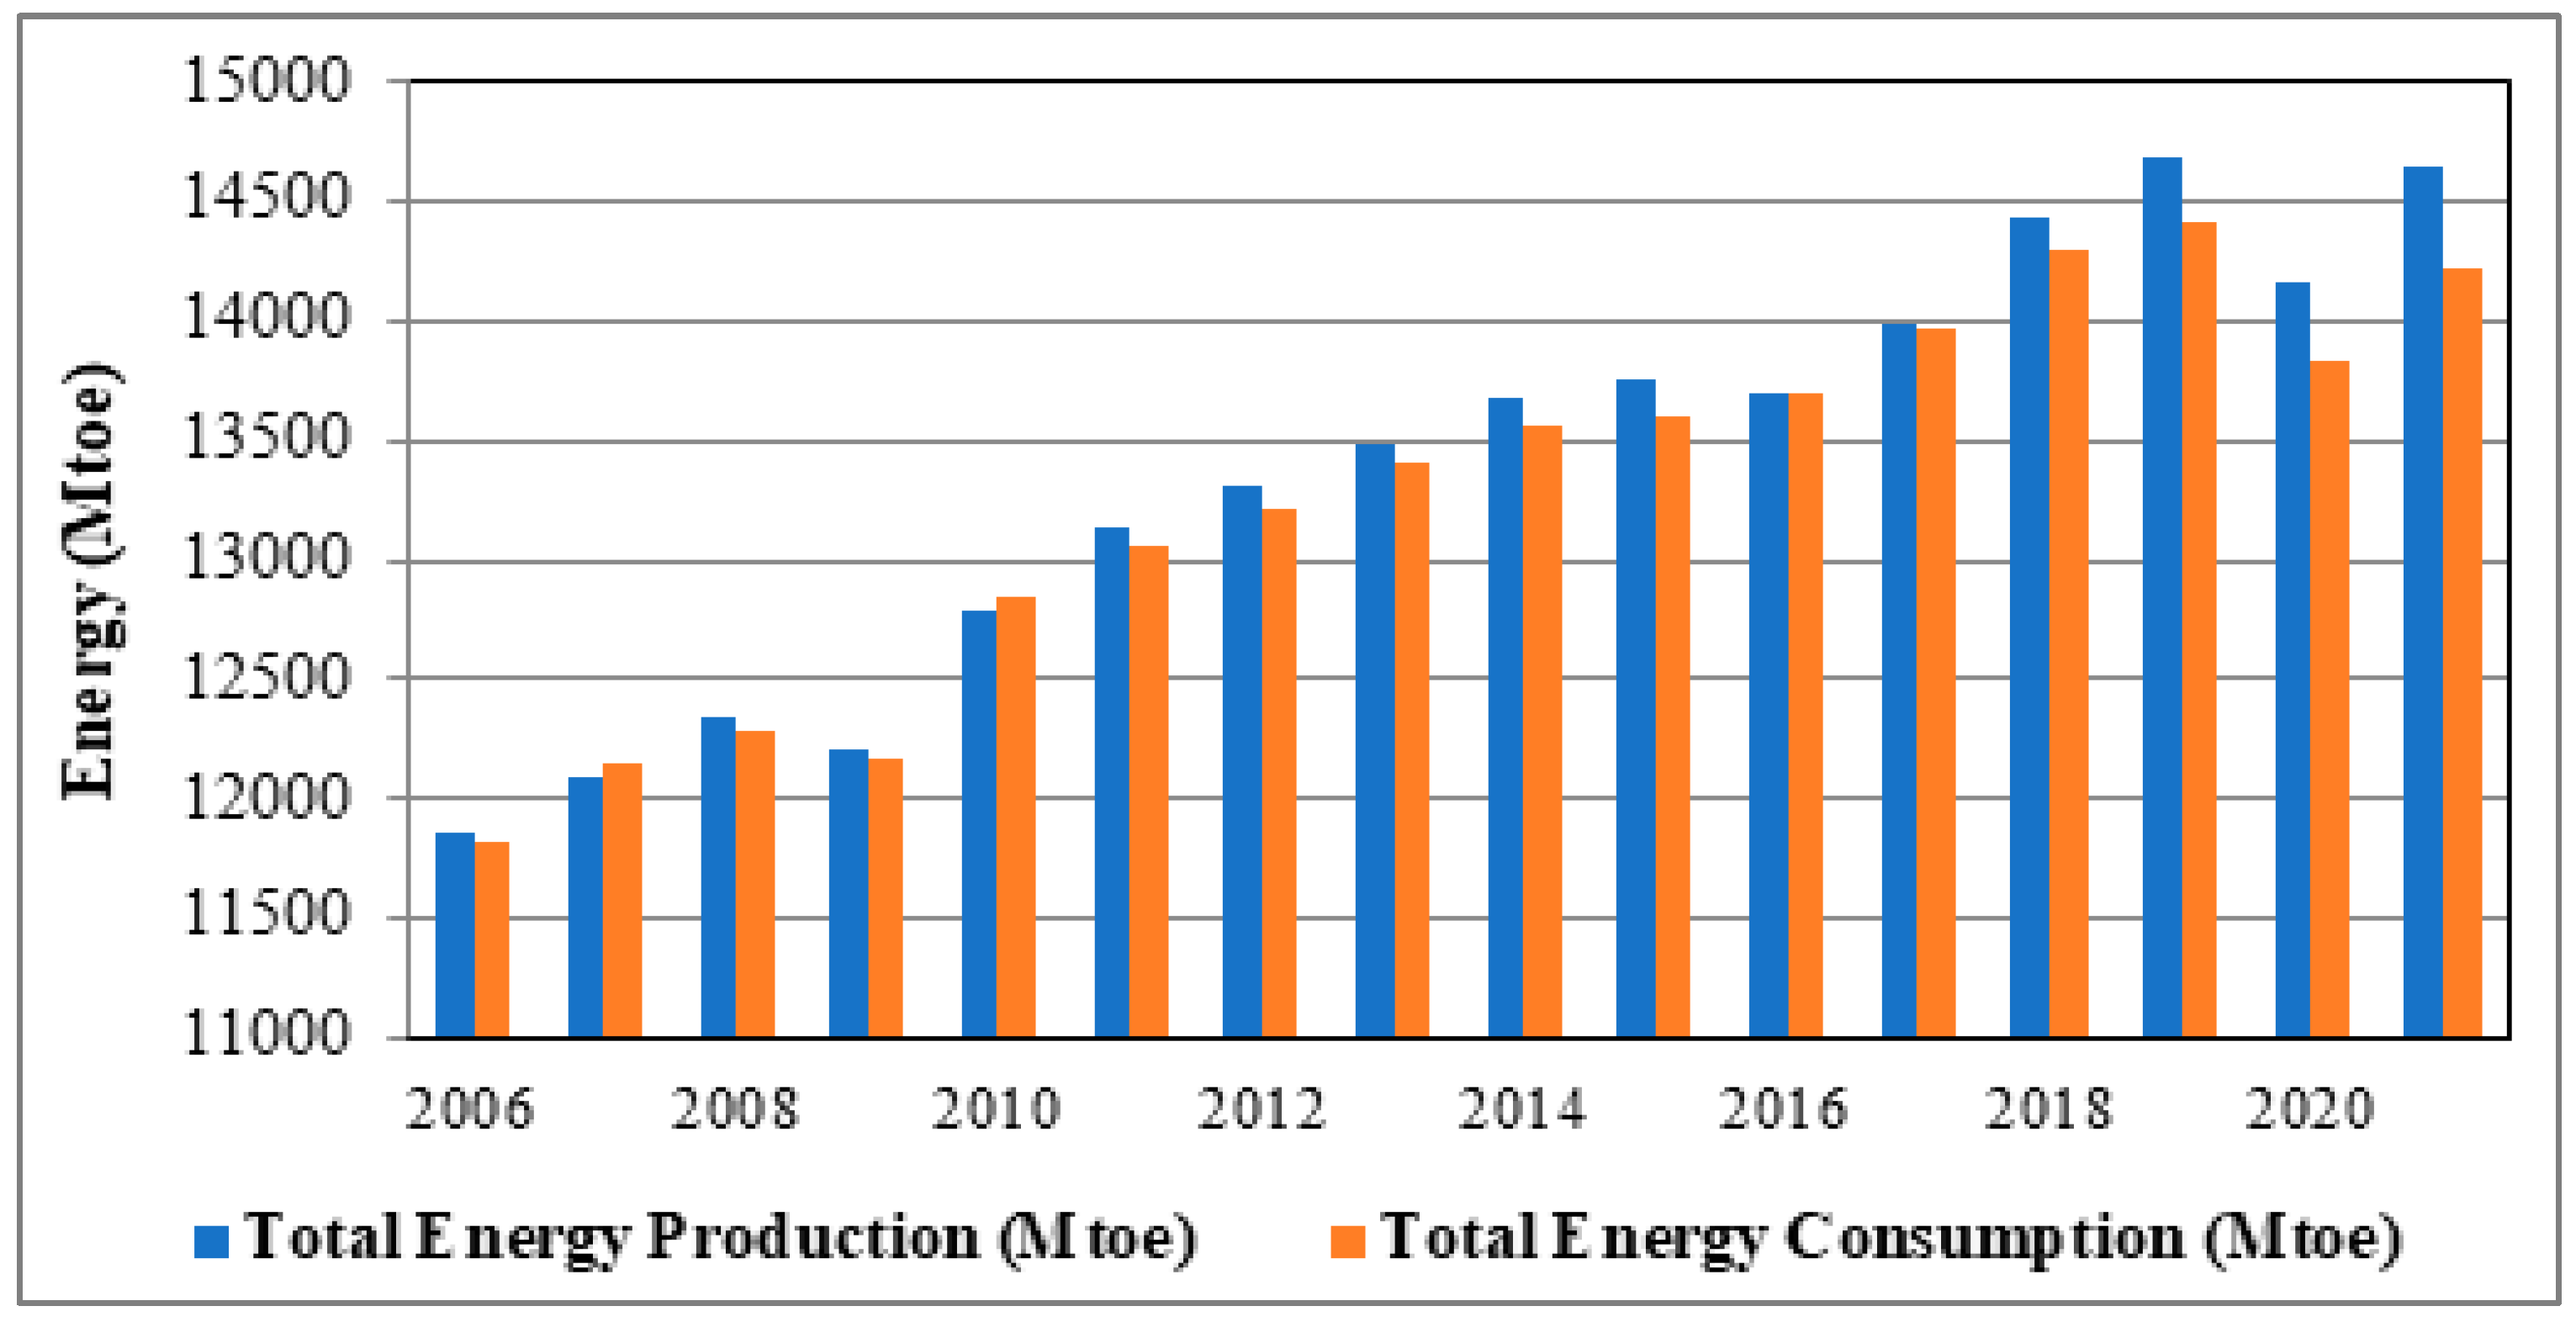
Throwing light on the past 15 years’worth of data on the consumption of energy, a very sharp rise grabs the attention, as is evident from Figure 2. To keep up with this growing demand, a steeper rise in the production curve is evident.
Figure 2. Comparison of Energy Production and Consumption (Mtoe).
In the race of keeping the production and demand line in synchronization, the rising levels of pollution went unnoticed, which resulted in a rise in greenhouse gas emissions and environmental pollution.
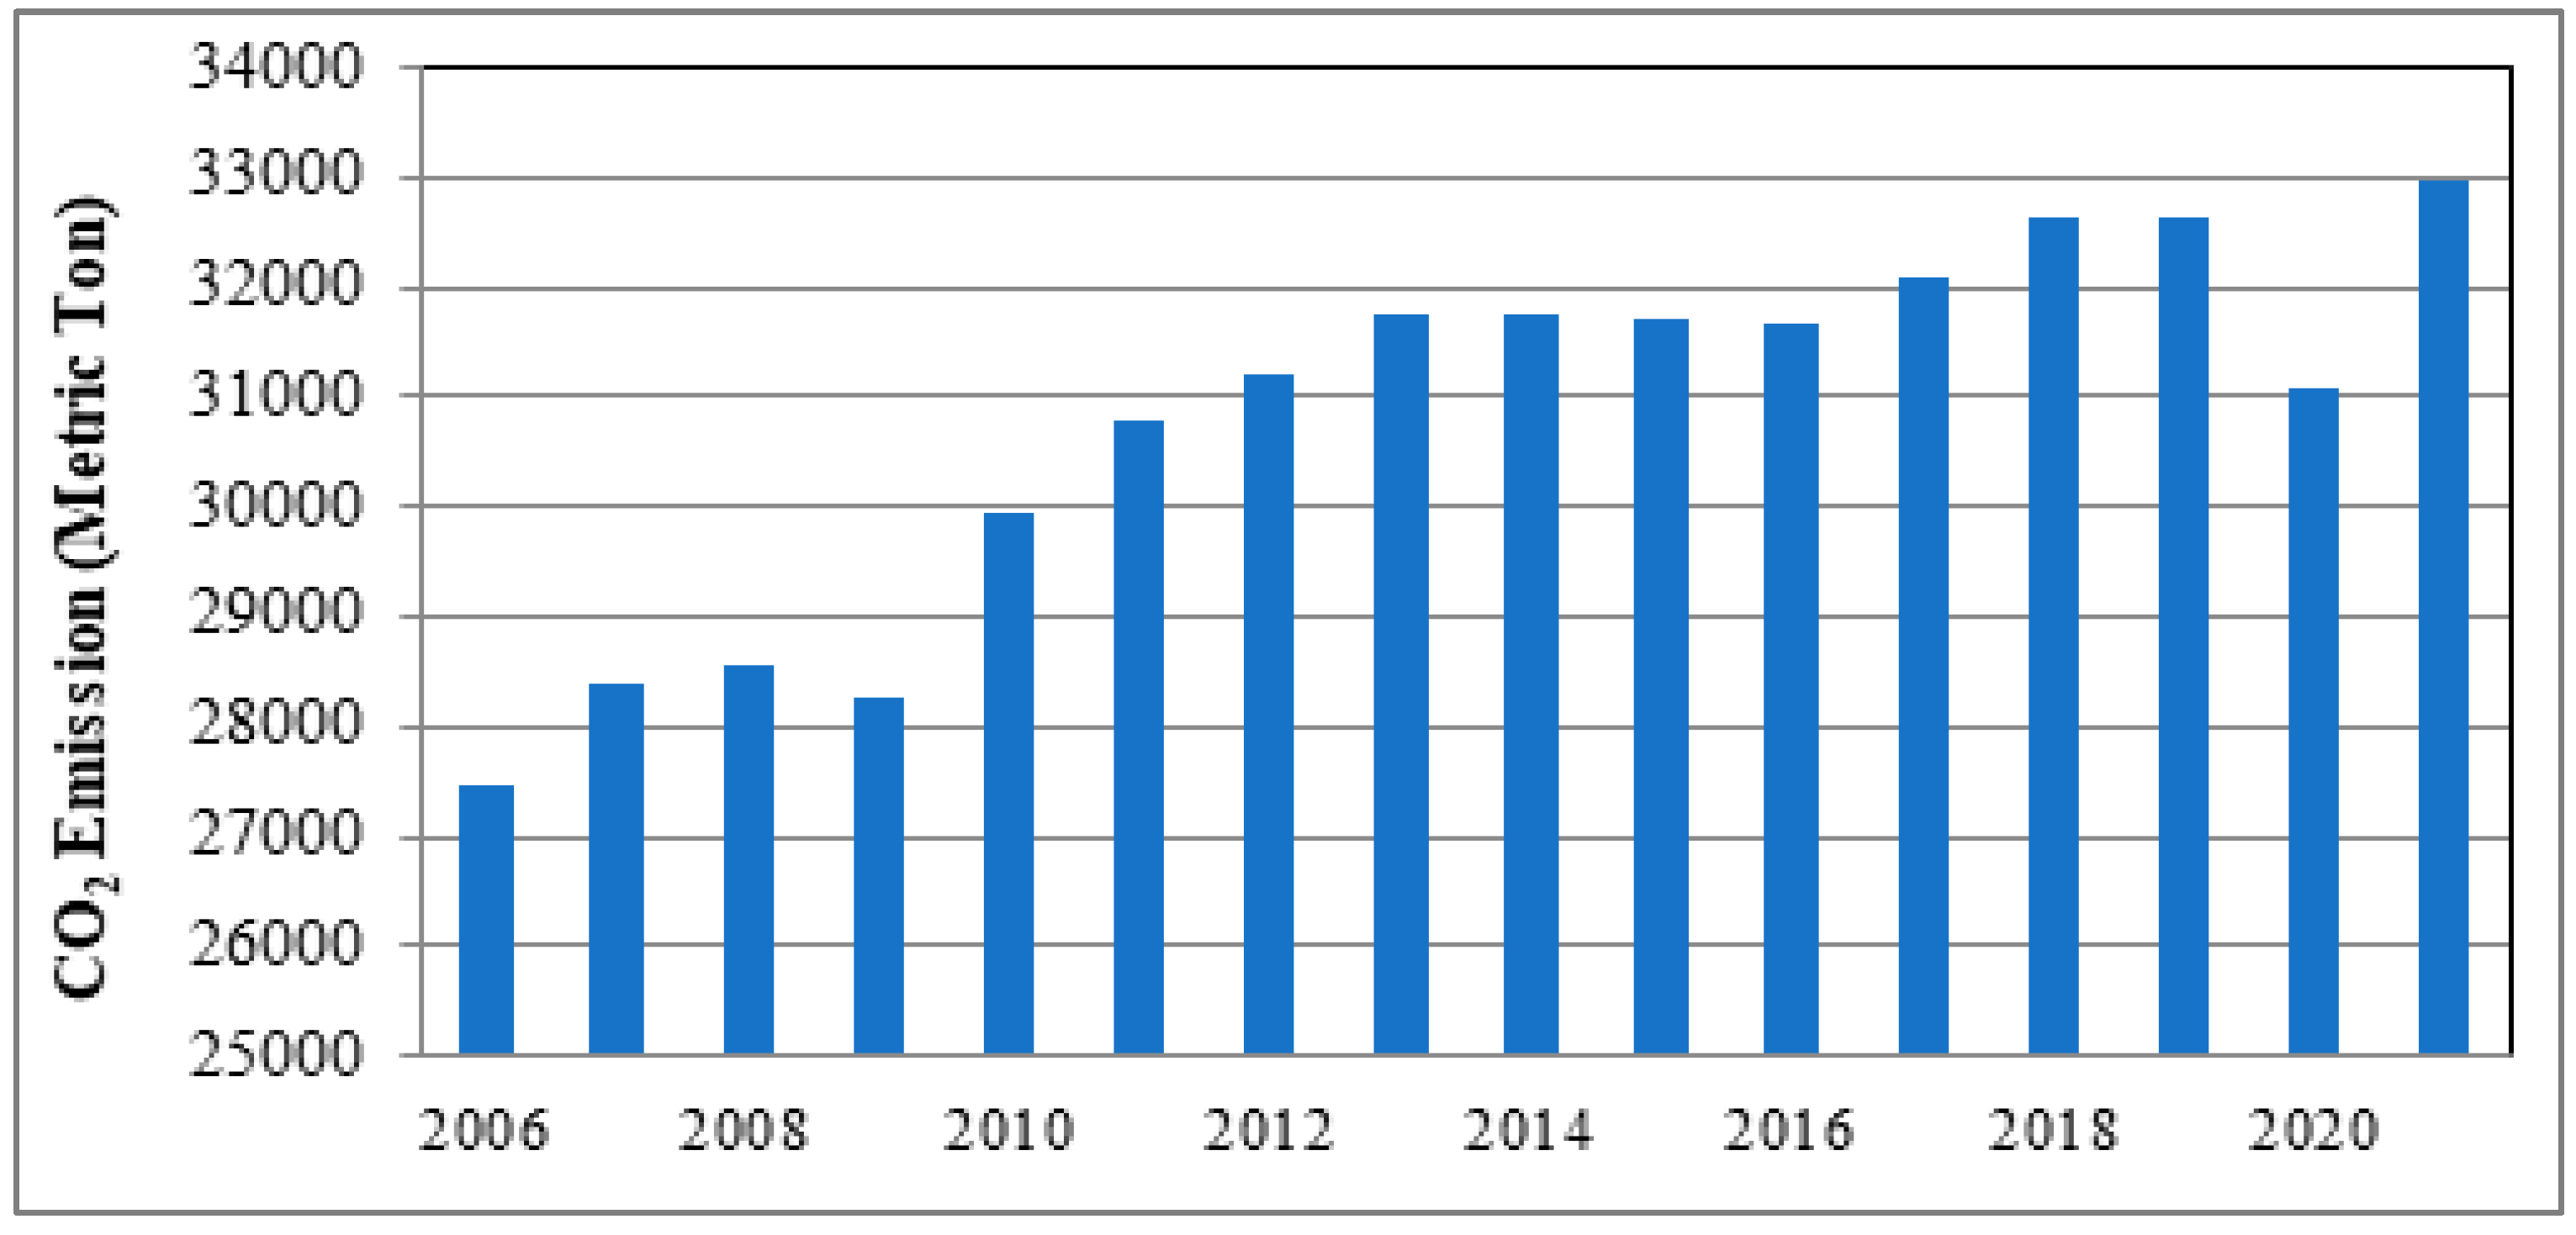
Figure 3 displays the rising trend in the level of CO
2 emission for the past 15 years
[34]. These data are for emissions from power plants only. It is evident from the graph that CO
2 emissions reached a whopping level of 32,969 metric tons in 2021, compared to 27,464 metric tons in 2006.
Figure 3. Global CO2 Emission in Metric Tons.
However, a growing consciousness is now being witnessed in all parts of the world. Consequently, the usage of renewable energy for electricity production has gained momentum. In particular, 2017 was a record-breaking year for renewable energy. This year witnessed the largest-ever increase in renewable power capacity, as well as increases in investment and advances in enabling technologies.
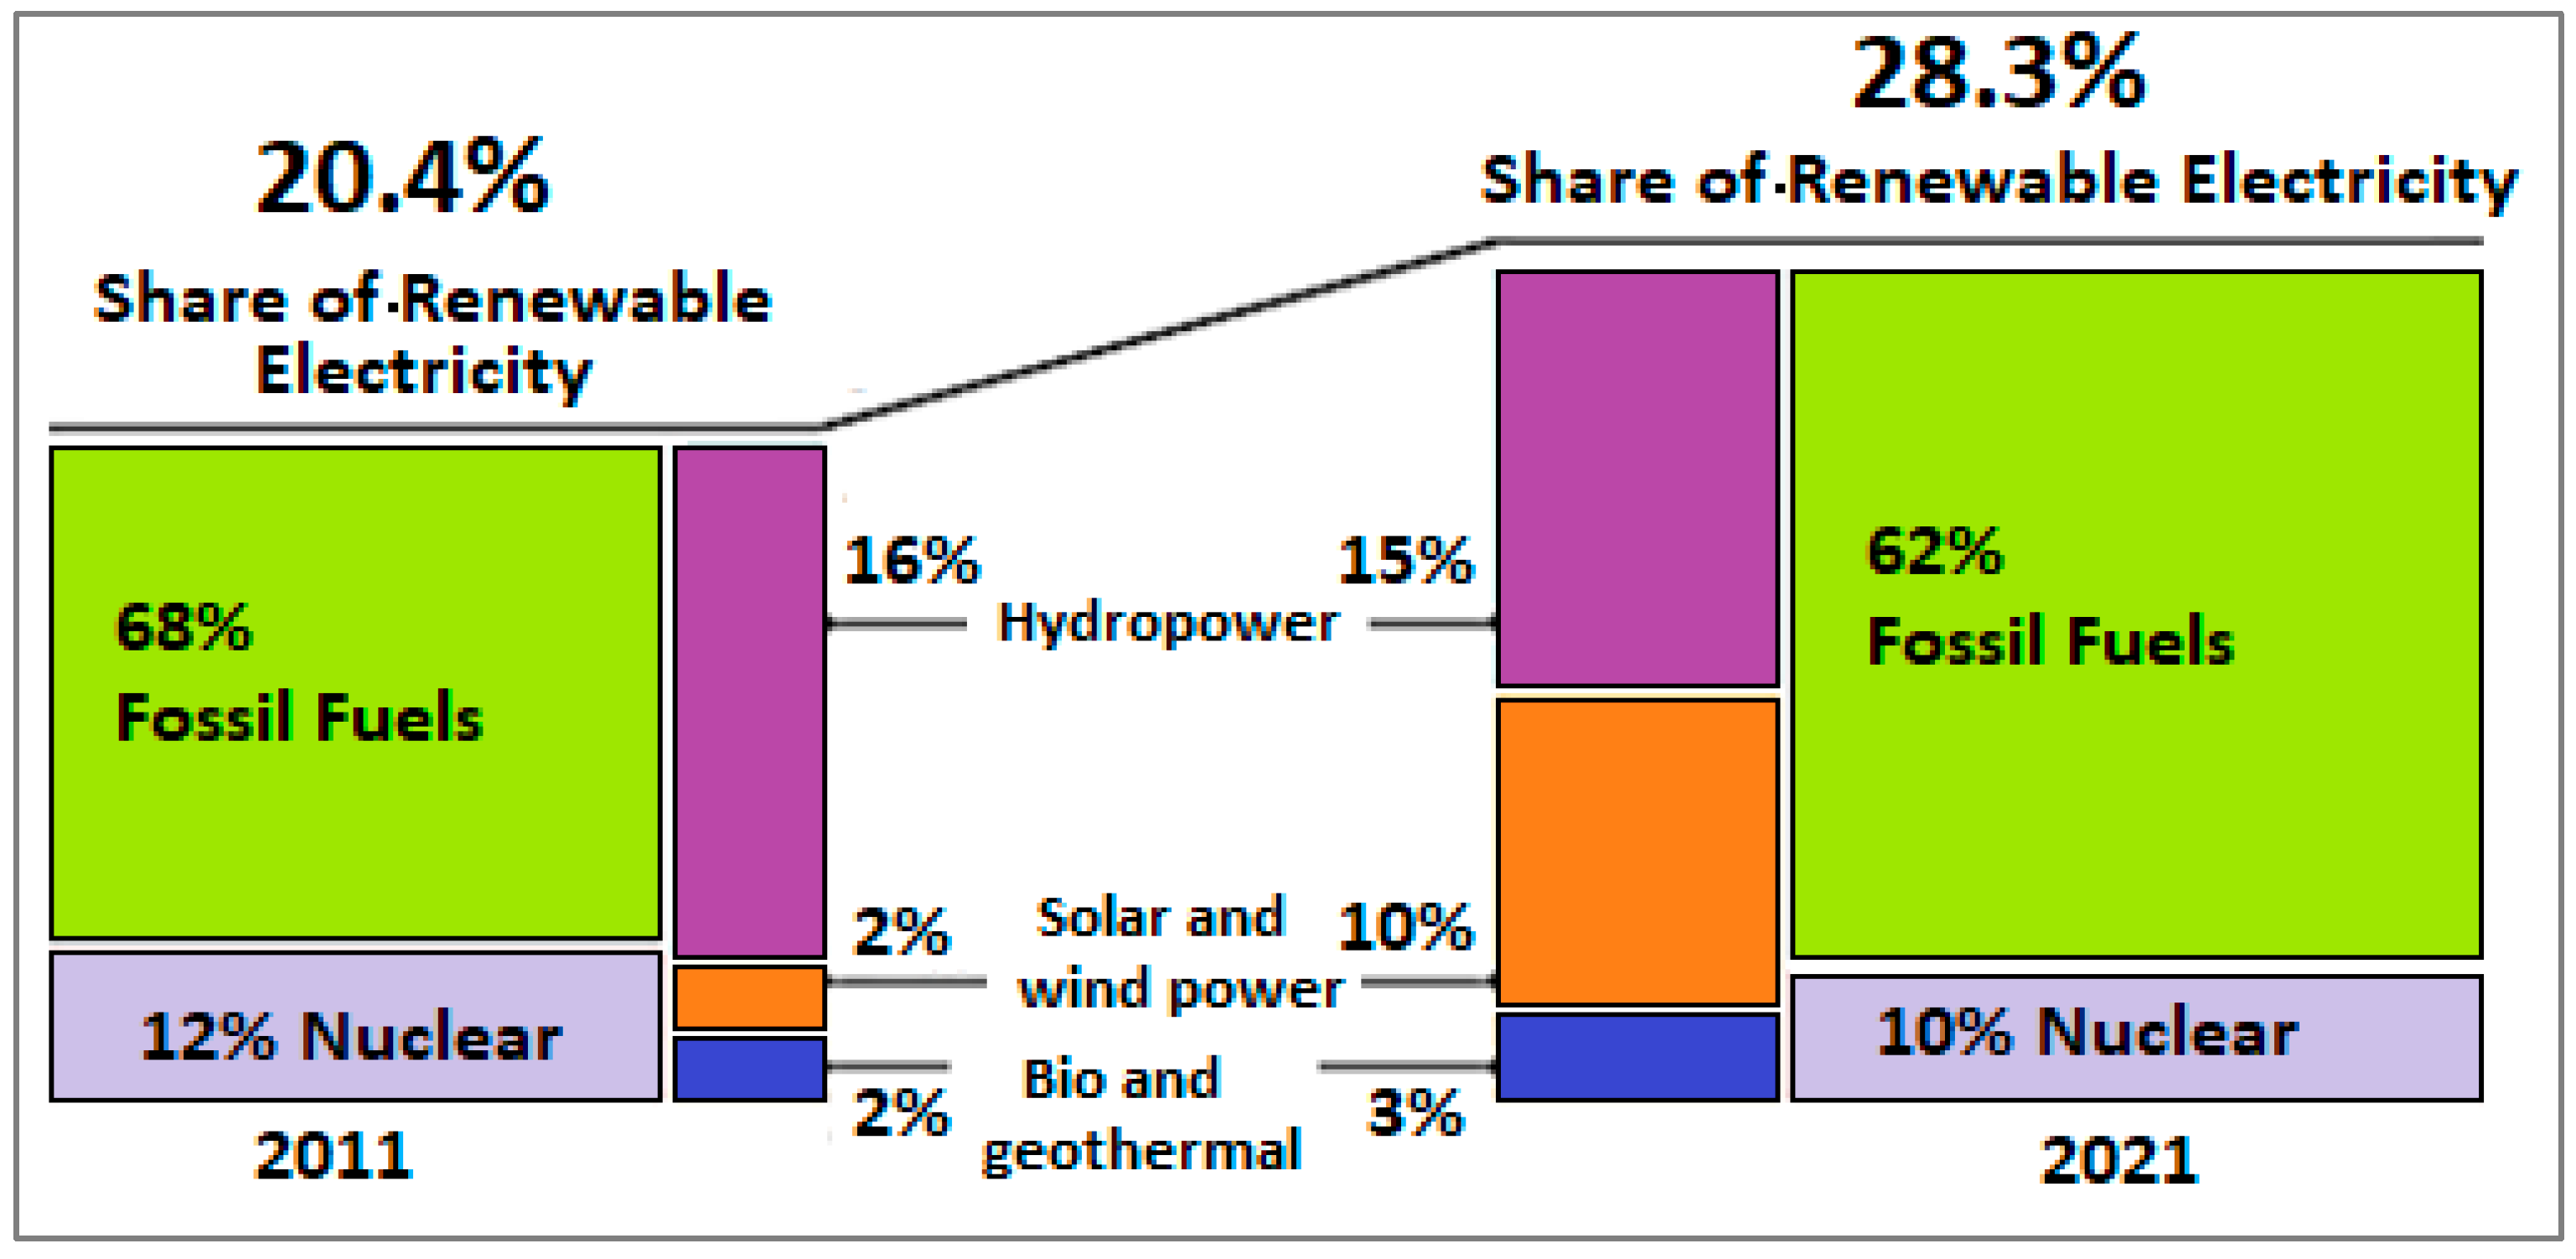
Figure 4 shows the percentage of energy shared by different sources throughout the world. Fossil fuels remain one of the major sources of energy and is a matter of concern
[35]. However, with a large investment inflow in renewable energy sources, this situation can be changed. A comparison of energy production between 2011 and 2021 indicates a rise in the use of modern renewable sources throughout the world. Almost 28.3% of electricity produced in 2021 came from renewable energy sources, which is larger than the renewable energy used in 2011 with only 20.4% total energy conversion. Among the renewable energy sources, hydropower is one of the most consistent and efficient electricity-generation sources (shown in
Figure 4). Approximately 15% of global electricity was produced by hydropower plants in 2021
[35].
Figure 4. Renewable Share of Total Energy Consumption, 2011 and 2021.
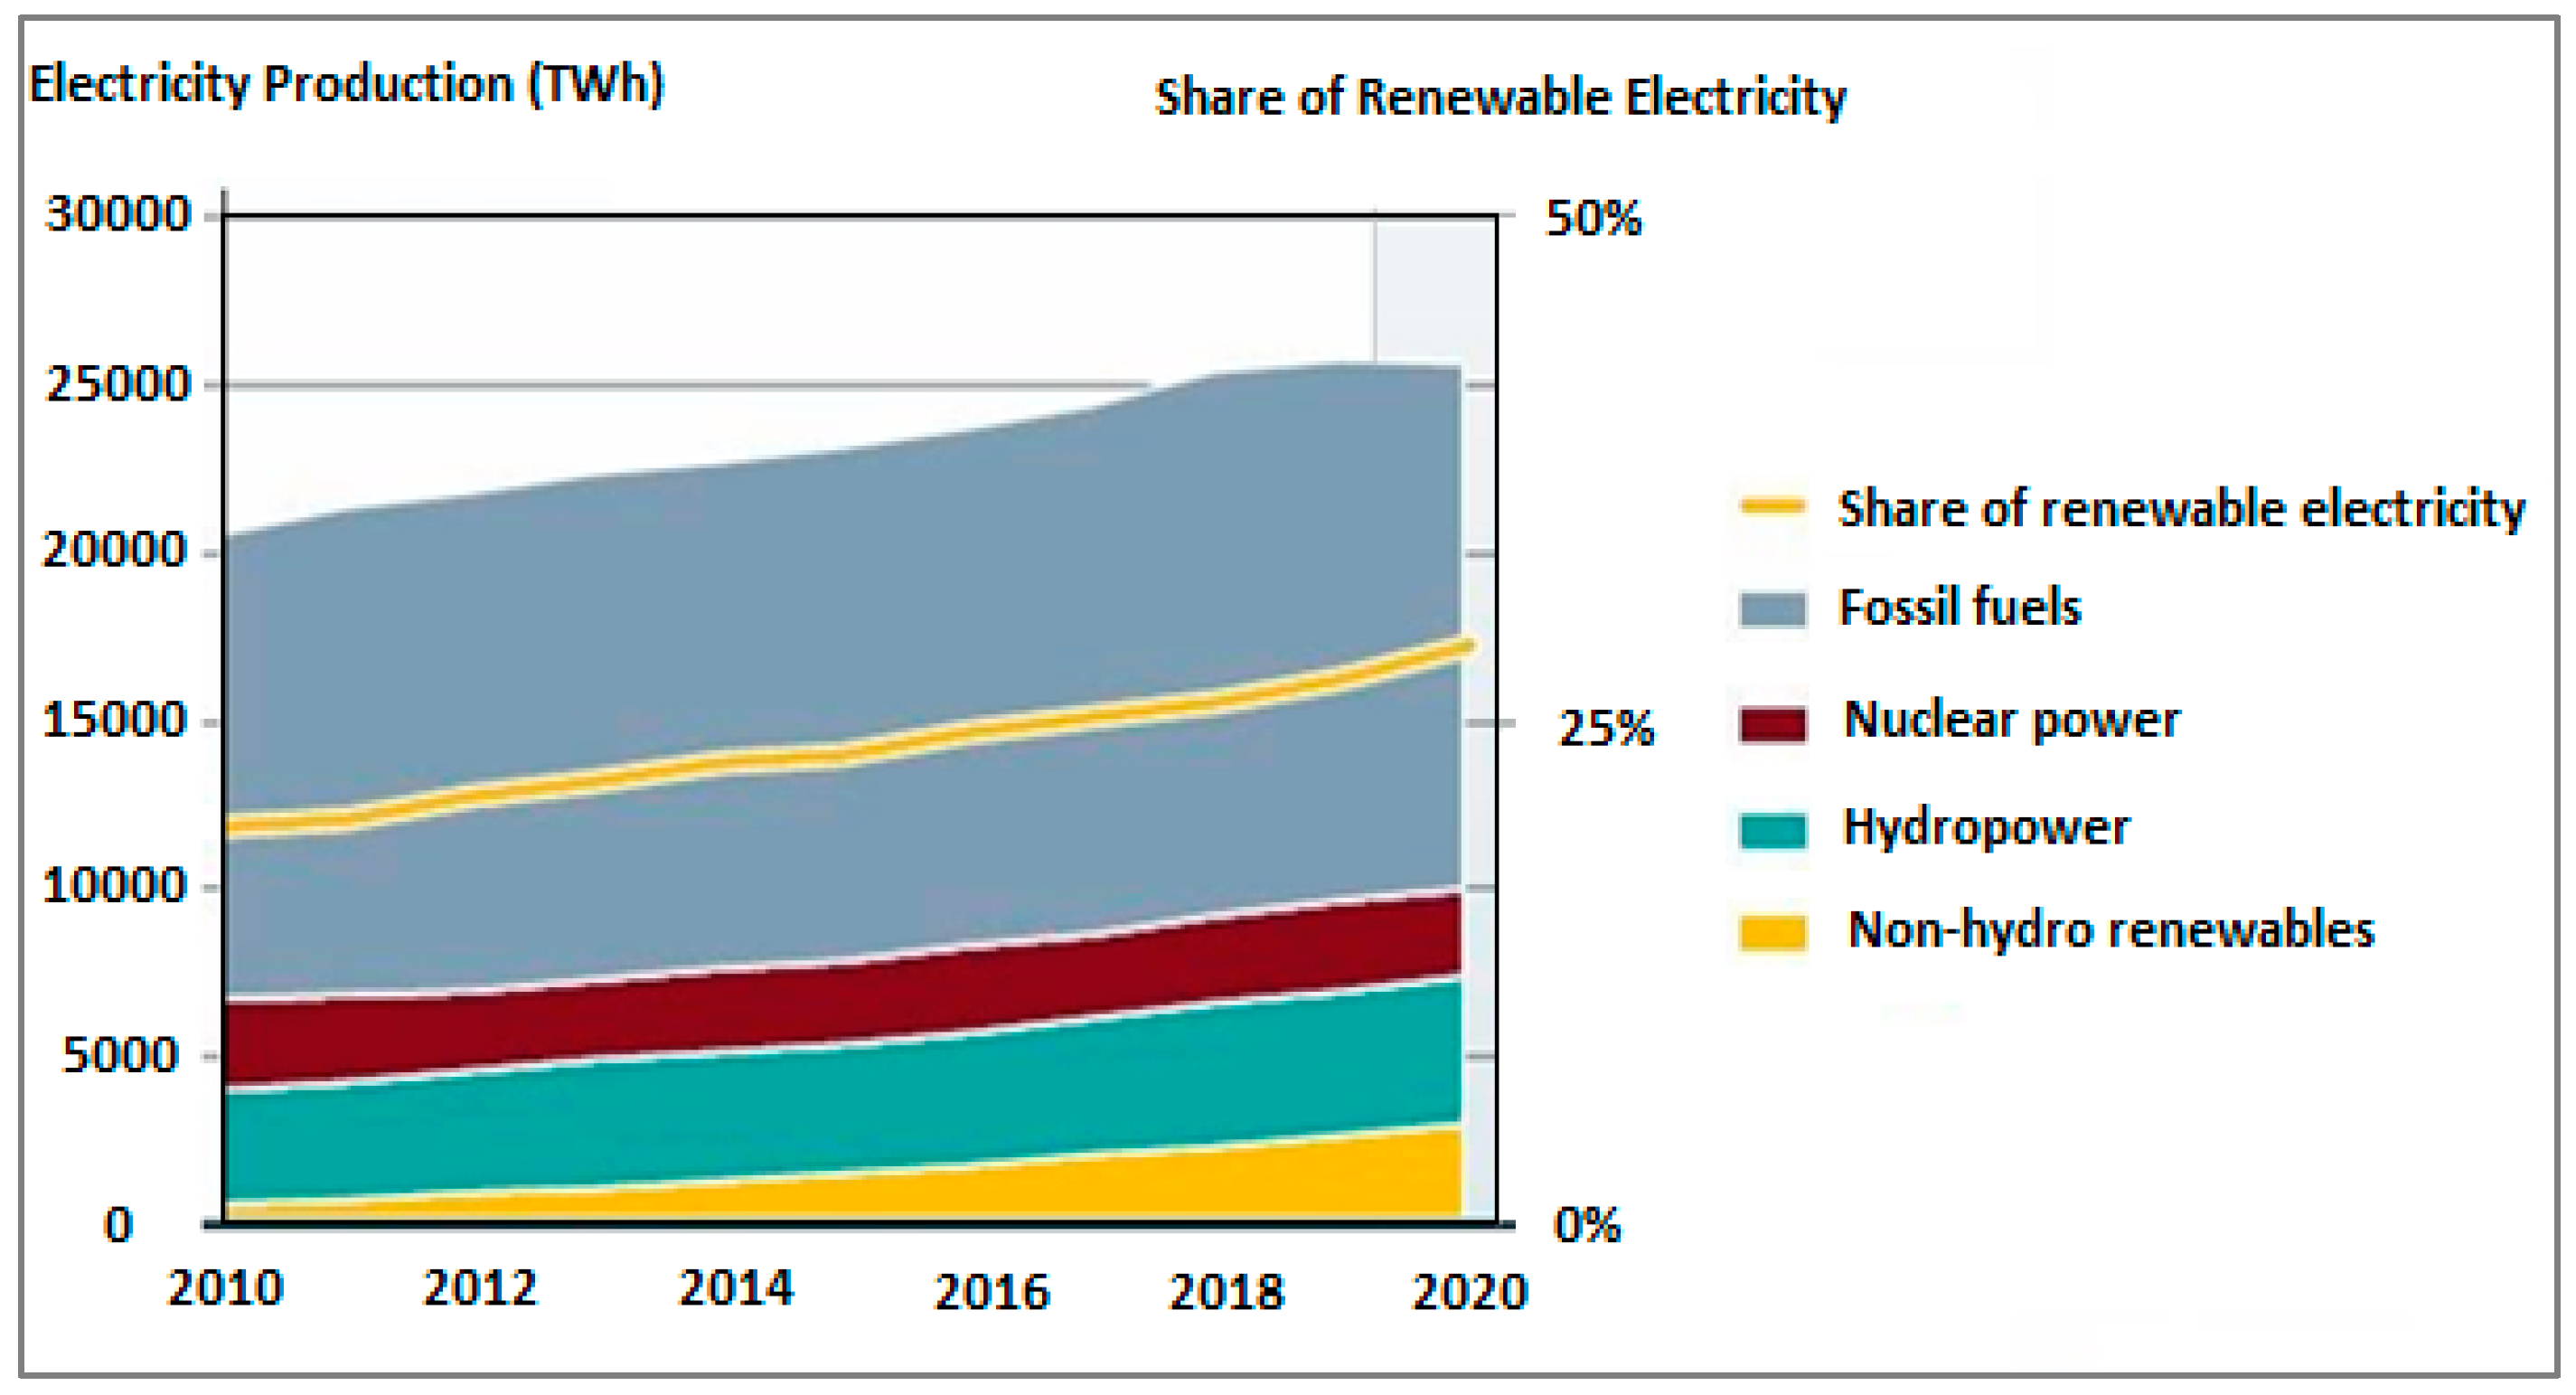
Figure 5 shows the details about global electricity production by source and the share of renewable energy from 2010 to 2020. In this figure, renewable energy is divided into two parts, i.e., renewable with and without hydropower. Starting from 2010, electricity production increased day by day with all types of sources, but the most important thing is that the electricity-generation rate from renewable energy sources increased at the very firstrate
[35]. This happened due to the large involvement of governments regarding the use of renewable energy sources.
Table 4 depicts the renewable energy indicators at the end of 2020. Approximately USD five billion in new annual investment was observed in 2020 from the immediate previous year (i.e., 2019). The additional investment in renewable energy directly indicates the motive of several countries toward the renewable dominating power system
[35].
Figure 5. Global Electricity Production by Source and Share of Renewable, 2010–2020.
Table 4. Renewable Energy Indicators, 2020 and 2021.
As per the report of ‘Our World in Data’, approximately 11% of the world’s total power demand has been fulfilled by renewable energy sources.
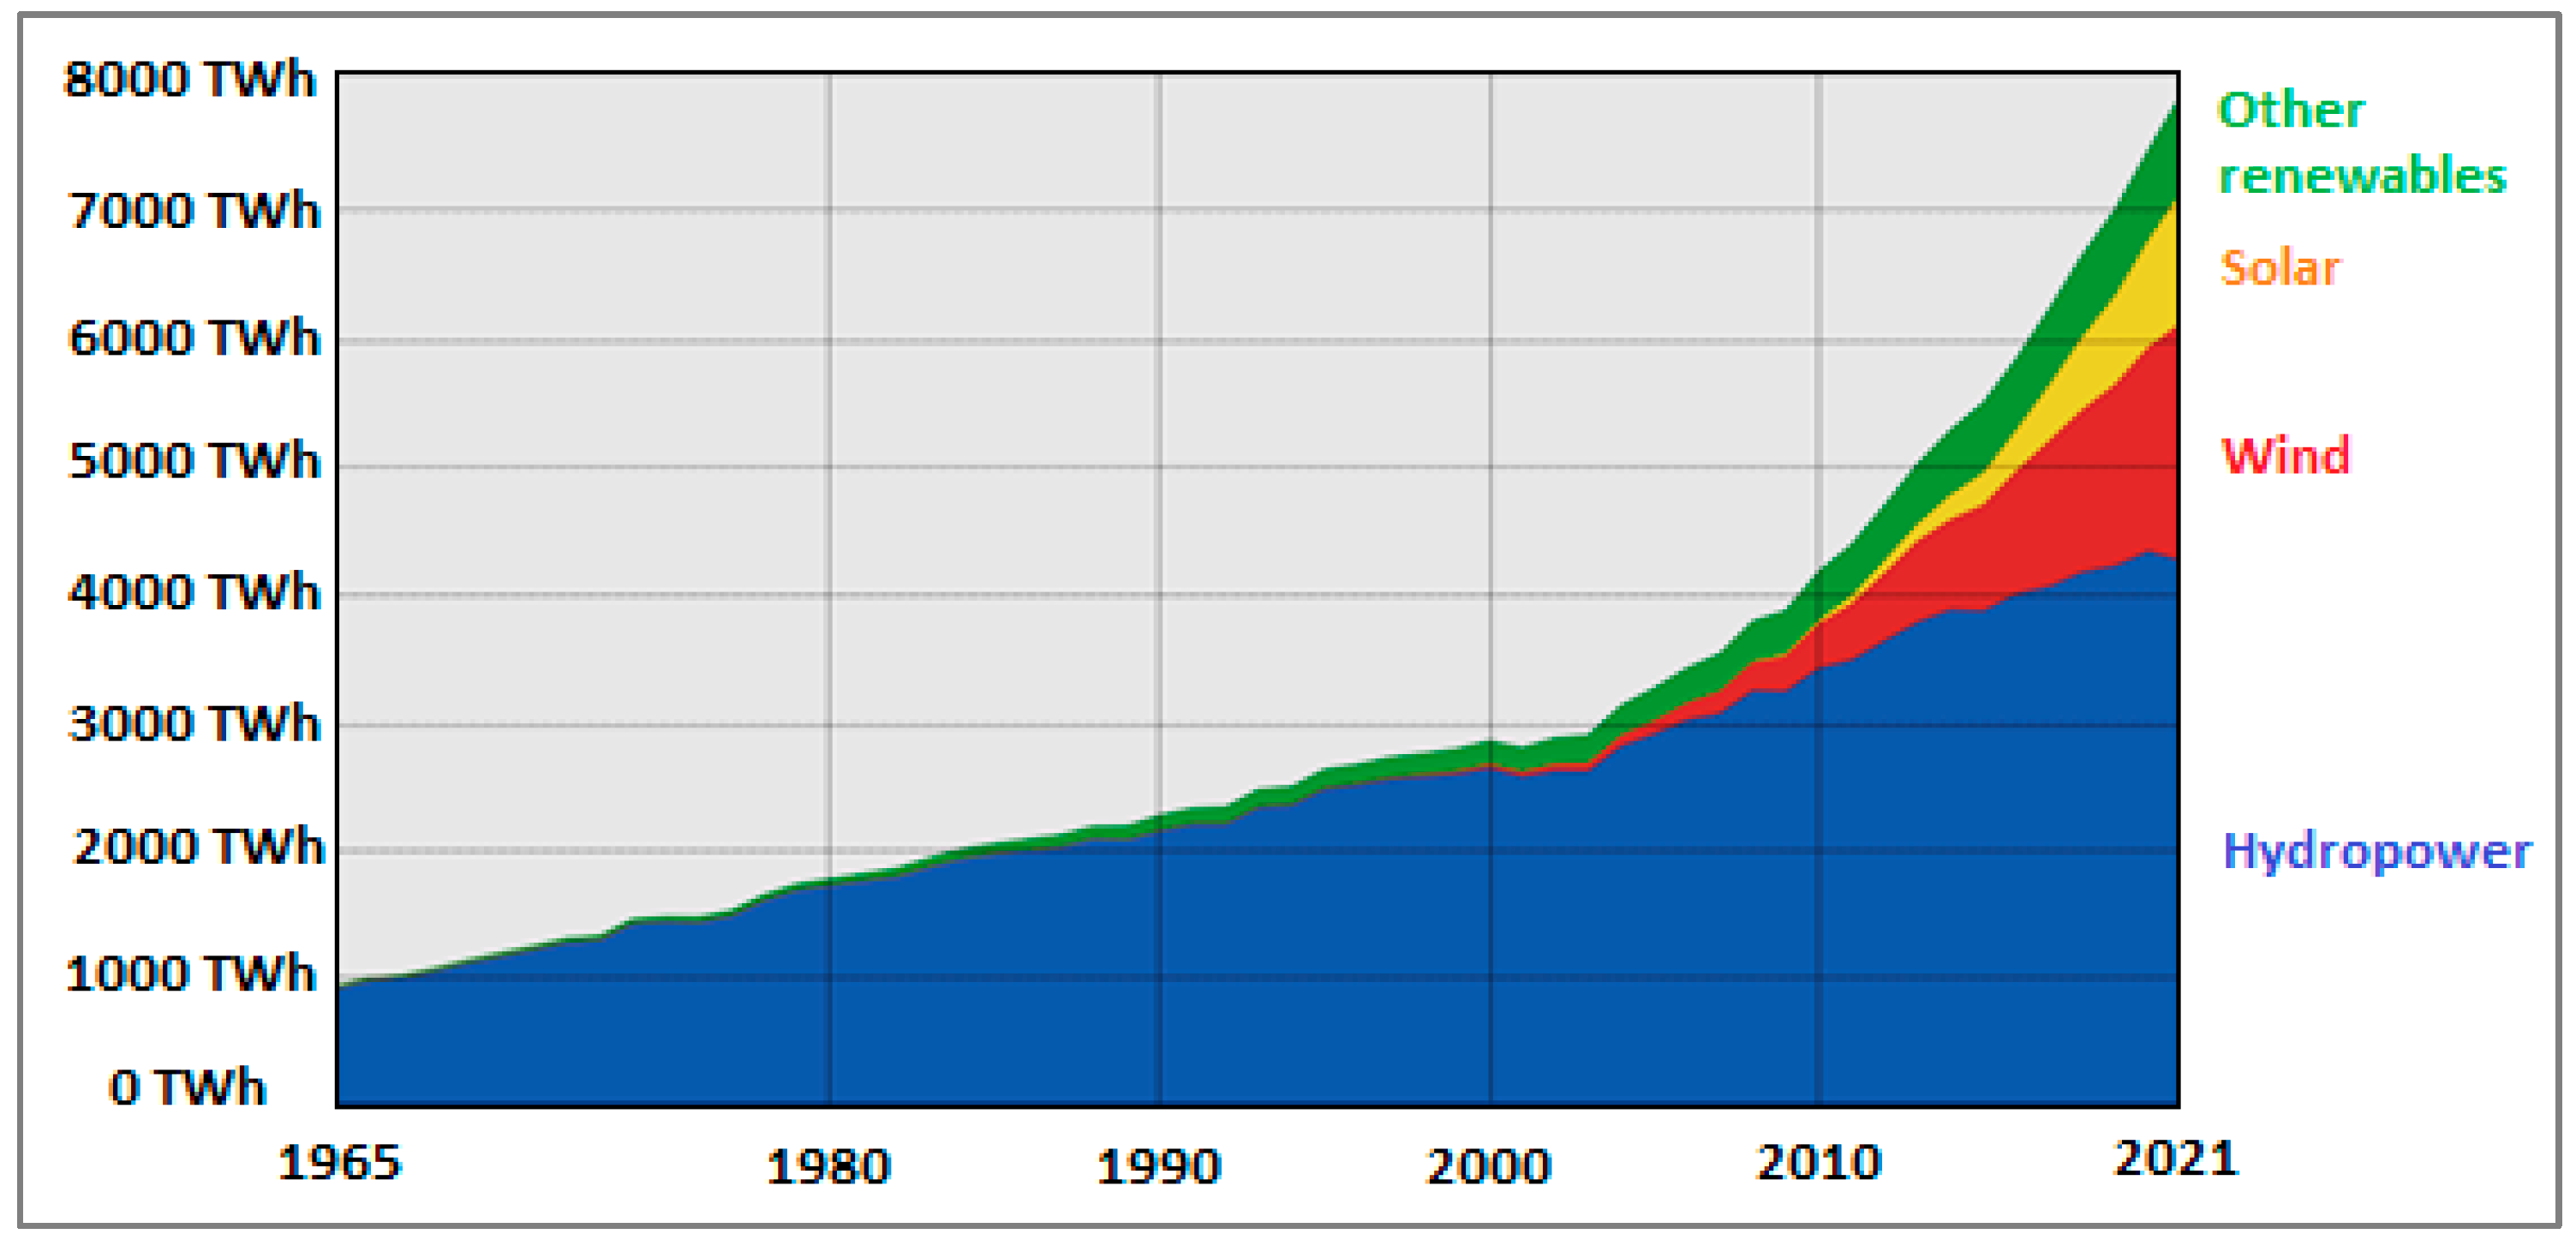
Figure 6 displays the global renewable-energy-generation status from 1965 to 2019
[36]. From 1965 to date, the maximum power has been generated by hydropower plants. Due to their dependable nature and high production capacity, hydropower plantsare the best energy production option among non-conventional energy sources. Starting with approx. 1000 TWh in 1965, renewable energy generation reached the maximum capacity of 7625 Twh at the end of 2021.
Figure 6. Renewable Energy Generation in World.
Annual additions of renewable power by technology from 2014 to 2021 are depicted in
Figure 7. There is a clear indication of growing power generation from all renewable sources. In 2020, the addition of power from solar PV sources reached a high point of 138 GW (approx.), whereas this capacity was only 40 GW in 2014
[35]. Due to the new technological accomplishments in wind power generation and solar PV generation, their production ratesare also very high throughout the world.
Figure 7. Annual Additions of Renewable Power by Technology, 2014–2021.
The world’s top five countries for renewable power generation in 2021 are shown in
Table 5. In the category of annual investment and total capacity addition, China secured the top position in terms of hydro, solar PV, and wind power generation
[35]. In terms of total capacity addition, India was in the top four ranks in the world for solar PV, hydro, and wind power. The United States also maintained its progress in all respects of renewable energy sources. These leading countries have encouraged other countries to develop renewable power plants.
Table 5. Top Five Countries for Renewable Power Generation in 2021.
Details Related to
Renewable Energy |
World Ranking |
| 1 |
2 |
3 |
4 |
5 |
| Annual Investment/Production/Net Capacity Addition in 2021 |
| Solar PV Capacity |
China |
United States |
India |
Japan |
Brazil |
| Wind power capacity |
China |
United States |
Brazil |
Vietnam |
United Kingdom |
| Hydropower Capacity |
China |
Canada |
India |
Nepal |
Lao PDR |
| Total Capacity of Generation at the End of 2021 |
| Hydropower capacity |
China |
United States |
Brazil |
India |
Germany |
| Solar PV capacity |
China |
United States |
Japan |
India |
Germany |
| Wind power capacity |
China |
United States |
Germany |
India |
Spain |