Your browser does not fully support modern features. Please upgrade for a smoother experience.
Please note this is an old version of this entry, which may differ significantly from the current revision.
Non-specific lipid transfer proteins (nsLTPs) stand out among plant-specific peptide superfamilies due to their multifaceted roles in plant molecular physiology and development, including their protective functions against pathogens. These antimicrobial agents have demonstrated remarkable efficacy against bacterial and fungal pathogens. The discovery of plant-originated, cysteine-rich antimicrobial peptides such as nsLTPs has paved the way for exploring the mentioned organisms as potential biofactories for synthesizing antimicrobial compounds.
- genomics
- expansion mechanisms
- last common ancestor
- plant stress
- gene expression
1. Introduction
The non-specific lipid transfer proteins (nsLTPs) are a plant-specific superfamily of cysteine-rich AMPs (antimicrobial peptides). They received this name due to their ability to bind to several hydrophobic molecules, such as phospholipids and fatty acids, among others. nsLTPs are characterized by their reduced size (6.5–10.5 kDa) and the presence of eight cysteine residues (8CM domain), which form four disulfide bonds [1]. They are associated with various plant biological processes, such as growth and development, abiotic stress responses, besides plant defense [2][3][4][5][6][7][8]. The mentioned plant-originated AMPs have demonstrated remarkable efficacy against bacterial and fungal pathogens [9]. The discovery of cysteine-rich AMPs such as nsLTPs has paved the way for exploring plants as potential biofactories for synthesizing antimicrobial compounds, which holds significant promise for their application as biotherapeutic agents in the field of antimicrobial drug development [9]. It has been proposed that such antimicrobial activity is due to the nsLTPs’ ability to disrupt the permeability and integrity of the pathogens’ outer membranes, similar to other plant AMPs [7][10]. However, further studies are necessary to understand all their biological roles.
Previous works indicate that nsLTPs are encoded by a large gene family, presenting more than 50 loci in many angiosperm genomes and up to 50 loci in bryophytes, ferns, and gymnosperms [1]. Some classification systems are available for nsLTPs. These, however, are heterogeneous in terms of subgroups’ numbers and nomenclature. The classification initially proposed for nsLTPs—division into ‘nsLTP1’ and ‘nsLTP2’ subfamilies—was based on their molecular mass, sequence identity (<30% of similarity between nsLTP1s and nsLTP2s), and lipid transfer efficiency [11][12]. Disulfide bond patterns in nsLTPs may also differ. ‘nsLTP1s’ displays ‘Cys1-Cys6, Cys2-Cys3, Cys4-Cys7, and Cys5-Cys8’ pattern [13], whereas ‘nsLTP2s’ exhibit that of ‘Cys1-Cys5, Cys2-Cys3, Cys4-Cys7, and Cys6-Cys8’ [14]. Such differences in disulfide bond configuration play a crucial role in the stability of these proteins, constraining their conformational dynamics [1].
Another notable difference regards the hydrophobic cavity. The subgroup nsLTP1s may have a long tunnel-like cavity [15][16], while nsLTP2s may have two adjacent hydrophobic cavities [14]. However, it is worth mentioning that there is no specific rule in this regard since the hydrophobic cavities can vary according to the sequence of amino acid residues, the number of disulfide bonds present in the structure, and the lipid binding specificity.
Boutrot et al. [17] proposed a different classification approach. These authors introduced phylogenetic grouping as a key classification criterion. The proposition includes early diverging nsLTP homologs found in mosses and liver plants. The mentioned classification established nine groups (types ‘1’ to ‘9’) stratified with their respective consensus cysteine motifs (8CM domain)—Cys-Xn-Cys-Xn-CysCys-Xn-CysXCys-Xn-Cys-Xn-Cys (X: different amino acids; n: variable number of amino acids)—and the inter-cysteine amino acid residues diversity.
Later, another proposition, by Edstam et al. [1], sought to break the limitations inherent in the sequence conservation, considering post-translational modifications in the glycosylphosphatidylinositol (GPI) anchoring sites, intron positions, and spacing in the regions between cysteine residues, besides sequence similarity. This classification system suggests five major groups (‘LTP1’, ‘LTP2’, ‘LTPc’, ‘LTPd’, and ‘LTPg’) and four minor groups (‘LTPe’, ‘LTPf’, ‘LTPh’, ‘LTPj’, and ‘LTPk’). Despite the efforts made on the new nsLTP classification systems, the conventional classification of ‘LTP1’ and ‘LTP2’ is still widely used due to a lack of consensus among different studies. Since the nsLTP gene family is so complex and diversified, no established classification guidelines are final [18].
2. Omics Studies for nsLTPs
2.1. Understanding nsLTPs from Previous Studies
Previous studies (Table 1) involving nsLTP gene search and plant transcriptional expression analyses were scrutinized. Based on this search, different views on nsLTP abundance, types (Table 1), and functions were found. The seminal work by Edstam et al. [1] proposes a greater nsLTP abundance in terrestrial plants and their absence in green algae (chlorophytes and charophytes) (Table 1), suggesting that nsLTP genes evolved soon after the terrestrial environment conquest. In favor of the mentioned proposition, a limited number of representatives and types of nsLTPs are observed when comparing lower plants (as bryophytes and lichens) to spermatophytes, which indicates the emergence of new types of nsLTPs in higher plants [1][19][20].
Table 1. Some previous studies involving nsLTP mining in plant omics data, including data sources, identification strategy, amount per species, and classes retrieved.
| Analyzed Species | Class | Mining Methodology | nsLTPs Amount | nsLTPs Classification | References |
|---|---|---|---|---|---|
| Oryza sativa (Os), Arabidopsis thaliana (At) | Monocot/dicot | tBLASTn/BLASTn | Os (52), At (49) | 1, 2, 3, 4, 5, 6, 7, 8, and Y | Boutrot et al. [17] |
| Solanum tuberosum (St), Solanum lycopersicum (Sh), Nicotiana tabacum (Nt), Nicotiana benthamiana (Nb), Capsicum annuum (Ca), and Petunia hybrida (Ph) | Dicots | BLASTn | St (28), Sl (28), Nt (33), Nb (17), Ca (19), Ph (10) | 1, 2, 3, 4, 5, 8, and 9 | Liu et al. [21] |
| Adiantum capillus-veneris (Ac-v), Marchantia polymorpha (Mp), Physcomitrella patens (Pp), Pinus taeda (Pt), Selaginella moellendorffii (Sm), and green algae (ga) | Chlorophyta, bryophyta, dicots, and monocots | tBLASTn/BLASTn/HMM | Mp (14), Pp (40), Sm (43), Ac-v (6), Pt (40), ga (0) | 1, 2, C, D, E, F, G, H, J, and K * | Edstam et al. [1] |
| Lotus japonicus | Dicot | BLAST | 24 | 1, 2, 3, 4, 5, 8, and 9 | Tapia et al. [22] |
| Brassica rapa | Dicot | BLASTp | 63 | 1, 2, 3, 4, 5, 6, 8, 9, and 11 | Li et al. [23] |
| Zea mays | Monocot | BLASTp/HMM | 63 | 1, 2, C, D, and G | Wei e Zong et al. [5] |
| Gossypium arboreum (Ga), Gossypium raimondii (Gr), and Gossypium hirsutum (Gh) | Dicot | BLASTp | Ga (51), Gr (47), Gh (91) | 1, 2, 3, 4, 5, 6, 8, and 9 | Li et al. [6] |
| Brassica oleracea | Dicot | HMM/BLASp | 89 | 1, 2, C, D, E, and G | Ji et al. [24] |
| Triticum aestivum | Monocot | BLAST Search | 105 | 1 and 2 | Hairat et al. [25] |
| Triticum aestivum | Monocot | tBLASTn | 461 | 1, 2, C, D, and G | Kouidri et al. [26] |
| Hordeum vulgare | Dicot | BLAST Search | 70 | 1, 2, C, D, and G | Zhang et al. [27] |
| Solanum lycopersicum | Dicot | HMM | 64 | 1, 2, 3, 4, 10, and 11 | D’Agostino et al. [28] |
| Solanum tuberosum | Dicot | BLASTp/tBLASTn/HMM | 83 | 1, 2, 4, 5, 7, 8, 12, and 13 ** | Li et al. [29] |
| Triticum aestivum | Monocot | BLASTp/HMM | 330 | 1, 2, C, D, and G | Fang et al. [30] |
| Arachis duranensis | Dicot | HMM | 64 | 1, 2, C, D, E, and G | Song et al. [31] |
| Sesamum indicum | Dicot | BLASTp/HMM | 52 | 1, 2, 3, 4, 5, 6, 8, 9, and 11 | Song et al. [32] |
| Hordeum vulgare (Hv) and highland barley (hb) | Dicot | BLASTp/HMM | Hv (40), hb (35) | 1, 2, C, D, and G | Duo et al. [33] |
| Chlamydomonas reinhardtii (Cr), Marchantia polymorpha (Mp), Physcomitrella patens (Pp), Selaginella moellendorffii (Sm), Zea mays (Zm), Sorghum bicolor (Sb), Oryza sativa (Os), Arabidopsis thaliana (At), Phaseolus vulgaris (Pv), Glycine max (Gm), Medicago truncatula (Mt), Trifolium pratense (Tp), Lotus japonicus (Lj), Lupinus albus (La), and Pisum sativum (Ps) | Chlorophyta, bryophyta, dicots, and monocots | BLASTp | Cr (1), Mp (13), Pp (28), Sm (23), Zm (68), Sb (63), Os (73), At (82), Pv (77), Gm (120), Mt (95), Tp (85), Lj (72), La (87), Os (73) | 1, 2, C, D, E, and G * | Fonseca-García et al. [34] |
| Brassica napus | Dicot | BLASTx | 246 | 1, 2, C, D, and G | Liang et al. [35] |
| Helianthus annuus | Dicot | BLASTp/HMM | 101 | 1, 2, 3, and 4 | Vangelisti et al. [36] |
| Sorghum spontaneum | Dicot | BLAST, TBLASTN | 7 | 1 and 2 | de Oliveira Silva et al. [37] |
| Brassica napus | Dicot | HMM | 238 | 1, 2, 3, 4, 5, 6, and 7 | Xue et al. [38] |
* All nsLTP groups found in the studied species pool; the nsLTP groups varied among the analyzed species. ** According to the similarity of the eight cysteine motif domains in amino acid sequences, Solanum tuberosum sequences were classified into two new types (12 and 13) by Li et al. [29].
In the barley (Hordeum vulgare) genome, 70 HvnsLTPs (Hordeum vulgare nsLTPs) were identified (Table 1), which were classified into five groups (‘1’, ‘2’, ‘C’, ‘D’, and ‘G’) [27]. Each of these genes shared common structures. Considering their expansion mechanisms, the 70 HvnsLTP genes presented 15 tandem duplication repeats (encompassing 36 genes). The HvnsLTPs’ baseline expression profiles in different tissues across developmental stages indicated that this group of genes might perform a variety of functions [27]. In addition, the differential expression profile indicated that HvnsLTP genes might have diverged in terms of the cis-regulatory elements of their promoters [27].
For the Solanaceae family, there are data on nsLTPs for potato (StnsLTPs, Solanum tuberosum nsLTPs). Li et al. [29] found 83 StnsLTP genes in potato genomes, categorized into eight types, namely, ‘1’, ‘2’, ‘4’, ‘5’, ‘7’, ‘8’, ‘12*’, and ‘13*’ (Table 1). Chromosome distribution and collinearity analyses suggested that the expansion of the StnsLTP gene family was enhanced by tandem duplications. In turn, Ka/Ks analysis showed that 47 pairs of duplicated genes have gone through purifying selection during evolution. StnsLTP genes were expressed mainly in younger tissues. Furthermore, StnsLTPs contained a large number of stress-responsive, cis-acting elements in their promoter regions. These results indicated that StnsLTPs might play significant and functionally varied roles in potato plants.
In Arachis duranensis, Song et al. [31] discovered 64 AdnsLTPs (Arachis duranensis nsLTPs) genes, which were divided into six groups (‘1’, ‘2’, ‘C’, ‘D’, ‘E’, and ‘G’; Table 1), anchored over nine chromosomes. Considering the AdnsLTPs’ expansion mechanisms, the study revealed some gene clustering by tandem duplication, while other family members showed segmental duplication in several chromosomes. Following treatments with high salt (NaCl, 250 mM), PEG, low temperature (4 °C), and abscisic acid, the AdnsLTPs’ expression levels were altered. Three AdnsLTPs were linked to nematode infection resistance. The DOF and WRI1 transcription factors were suggested as potential controllers of the AdnsLTP response to nematode infection.
Fang et al. [30] found 330 TansLTPs (Triticum aestivum nsLTPs) genes in wheat (T. aestivum) (Table 1). Such a quantitative result can be considered an update of the 461 nsLTP loci found by Kouidri et al. [26] for the same species. To date, T. aestivum is the plant with the highest number of nsLTPs. The TansLTPs clustered into five groups (‘1’, ‘2’, ‘C’, ‘D’, and ‘G’) by phenetic analysis (Table 1). Gene structure and MEME pattern analyses showed that different groups of nsLTPs had similar structural compositions. Chromosome anchoring revealed that all five groups were distributed on 21 chromosomes. Furthermore, 31 gene clusters were identified as tandem duplications, and 208 gene pairs were identified as segmental duplications. Data mining of RNA-seq libraries, covering multiple stress conditions, showed that the transcript levels of some of the nsLTP genes could be strongly up-regulated by drought and high salt (NaCl, 250 mM) stresses.
In another context, Liang et al. [35] scrutinized the Brassica napus pangenome for BnnsLTPs (B. napus nsLTPs). These authors identified 246 BnnsLTP genes, divided into five groups (‘1’, ‘2’, ‘C’, ‘D’, and ‘G’; Table 1). Different BnnLTP genes were identified among the eight studied B. napus varieties (ZS11, Gangan, Zheyou7, Shengli, Tapidor, Quinta, Westar, and No2127). BnnsLTPs showed different duplication patterns in different varieties. Cis-regulatory elements that respond to biotic and abiotic stresses were anchored at all BnnsLTP genes. Finally, RNA-Seq analysis showed that the BnnsLTP genes were involved in responses to the fungus Sclerotinia sclerotiorum infection.
Vangelisti et al. [36], studying sunflower (Helianthus annuus) HansLTPs (Helianthus annuus nsLTPs), observed the existence of four (‘1’, ‘2’, ‘3’, and ‘4’) groups (Table 1). The authors did not explicitly classify the observed groups according to the available classification systems. The HansLTPs (101 in total) were further examined by looking into potential gene duplication sources, which revealed a high prevalence of tandem- in addition to whole-genome duplication (WGD) events. This finding is consistent with polyploidization events that occurred during the evolution of the sunflower genome. Three (‘1’, ‘3’, and ‘4’) of the four HansLTP groups responded uniquely to environmental cues, including auxin, abscisic acid, and the saline environment. Interestingly, sunflower seeds were the only source of expression for HansLTP group ‘2’ genes.
In line with the reports mentioned above and other works in Table 1, it is observed that the nsLTP genes act multifunctionally and show genetic variability even within accessions of the same species. nsLTPs are present in a wide range of plants, showing gene expression in different tissues, developmental stages, and stressful conditions.
2.2. Filling the Gap: Discovering and Classifying nsLTPs in New Plant Genomes
To provide genomic information for nsLTPs in plants not yet studied in the previous topic, and to update nsLTP data for some species with improved genome versions that have been made available, the following plant genomes were scrutinized (Table 2): (1) Marchantia polymorpha; (2) Ceratopteris richardii; (3) Selaginella moellendorffii; (4) Thuja plicata; (5) Gossypium hirsutum; (6) Lactuca sativa; (7) Manihot esculenta; (8) Mimulus guttatus; (9) Populus trichocarpa; (10) Sinapis alba; (11) Solanum tuberosum; and (12) Spinacea oleracea. The mentioned species were chosen to diversify the number of analyzed clades.
Table 2. Studied species and number of recovered nsLTPs from the three applied mining approaches.
| Plant Categorization | Common Name | Genome Version * | 2n | Genome Size (Gb) | Mining Method ** | Number of NR Loci | ||||
|---|---|---|---|---|---|---|---|---|---|---|
| Higher Classification | Family | Species | BLASTp | RegEx | HMM | |||||
| Bryophyta | Marchantiaceae | Marchantia polymorpha | Common liverwort | Mpolymorpha_320_v3.1 | 18 | ~0.29 | 0 | 2 | 21 | 21 |
| Pteridophyta | Pteridaceae | Ceratopteris richardii | Triangle waterfern | Crichardii_676_v2.1 | 78 | ~11.25 | 0 | 64 | 65 | 65 |
| Selaginellaceae | Selaginella moellendorffii | Spikemoss | Smoellendorffii_91_v1.0 | 16 | ~0.1 | 0 | 0 | 36 | 36 | |
| Gymnosperm | Cupressaceae | Thuja plicata | Western redcedar | Tplicata_572_v3.1 | 22 | ~12.5 | 4 | 12 | 112 | 112 |
| Angiosperm | Malvaceae | Gossypium hirsutum | Cotton | Ghirsutum_527_v2.1 | 52 | ~2.43 | 67 | 54 | 218 | 218 |
| Asteraceae | Lactuca sativa | Lettuce | Lsativa_467_v5 | 18 | ~2.5 | 55 | 44 | 105 | 105 | |
| Euphorbiaceae | Manihot esculenta | Cassava | Mesculenta_671_v8.1 | 36 | ~0.7 | 29 | 28 | 98 | 98 | |
| Phrymaceae | Mimulus guttatus | Monkeyflower | MguttatusTOL_551_v5.0 | 28 | ~0.4 | 14 | 22 | 114 | 114 | |
| Salicaceae | Populus trichocarpa | Black cottonwood | Ptrichocarpa_533_v4.1 | 19 | ~0.5 | 25 | 22 | 85 | 85 | |
| Brassicaceae | Sinapsis alba | White mustard | Salba_584_v3.1 | 24 | ~0.5 | 23 | 64 | 189 | 189 | |
| Solanaceae | Solanum tuberosum | Potato | Stuberosum_686_v6.1 | 48 | ~0.8 | 35 | 24 | 105 | 105 | |
| Amaranthaceae | Spinacia oleracea | Spinach | Soleracea_575_Spov3 | 12 | ~0.9 | 6 | 8 | 43 | 43 | |
* Phytozome genome version used to infer the conceptual proteome; ** number of nsLTP sequences with validated eight-cysteine domain (8CM). Legend: RegEX (regular expression); HMM (Hidden Markov Model); Gb (gigabase); NR (non-redundant).
Three distinct and complementary strategies were used to retrieve nsLTPs in the genomes selected. The nsLTP exhaustive mining applied to 12 evaluated genomes (Table 2) returned 258 candidate sequences by BLASTp search, 344 by the cysteine pattern-based strategy (RegEx mining), and 1191 by the machine learning approach (HMMER tool).
The machine learning approach (HMMER tool) recovered a more comprehensive number of sequences considering nsLTP domains. Strategies based on machine learning are emerging as the future of DNA/RNA/protein sequence identification and bioinformatics, in general. The search with the RegEx approach was more restrictive, on the other hand, and not as accurate as the local alignment (BLASTp) method when observing the presence of the conserved nsLTP domain. However, it is worth mentioning that the BLASTp strategy did not recover sequences from the hypothetical proteomes of C. richardii, S. moellendorffii, and M. polymorpha (Table 2). When working with sequences as diverse as nsLTPs, it is advisable to combine several mining methods to increase the chances of finding the maximum number of sequences combined with subsequent data curation. Herein, however, almost all of the sequences retrieved by the BLASTp and RegEx approaches were also retrieved by the machine-learning-based strategy .
From the analyzed species pool (Table 2), S. moellendorffii (21) and G. hirsutum (218) presented, respectively, the lowest and highest number of nsLTPs. The search confirmed the tendency of these peptides to be encoded by large gene families: nine (75%) of the 12 analyzed species had more than 50 nsLTP loci in their respective genomes (Table 2). There was no correlation (r = 0.10) between genome size and the number of nsLTPs in the analyzed species pool (Table 2). However, angiosperms and the analyzed gymnosperm have a higher amount of nsLTPs than pteridophytes and the analyzed bryophyte (Table 2). This fact may be associated with the evolution of these basal groups, as shown by Edstam et al. [1]. Pteridophytes and bryophytes are phylogenetically closer to green algae than the other clades analyzed. This scenario is possibly responsible for the nsLTPs’ reduced number in the mentioned clades since no nsLTPs were identified in green algae [1].
The work also updated the data for the nsLTP content in cotton (G. hirsutum), potato (S. tuberosum), common liverwort (M. polymorpha), and spikemoss (S moellendorffii) from the respective updated genome versions (Ghirsutum_527_v2.1, Stuberosum_686_v6.1, Mpolymorpha_320_v3.1, and Smoellendorffii_91_v1.0 | Phytozome database). While Li et al. [6] and Li et al. [29] identified, respectively, 91 and 83 nsLTP loci for the G. hirsutum and S. tuberosum (Table 1), 218 and 105 nsLTP loci were identified (Table 2). For M. polymorpha and S. moellendorffii, 21 and 36 nsLTPs were found, respectively (Table 2), in the present study (compared to 13 and 23 nsLTPs reported by Fonseca-García et al. [34]; (Table 1)). Genome assemblies are never perfect since they are models for the actual genome. It is hard to completely rule out all potential technological or algorithmic flaws, and no single assembly can accurately capture all the variety within populations of a species. Thus, published genomes that have an active research community are continuously improved. Such modified and updated versions are potential sources for changing minor paradigms.
Considering the 1191 nsLTPs’ categorization, the researchers observed nine large groups, of which five could be identified (‘nsLTL1’, ‘nsLTL2’, ‘nsLTLG’, ‘nsLTLD’, and ‘nsLTLC’; Figure 1), in addition to four distinct groups denominated ‘Unknown 1-4’ (Table 2).
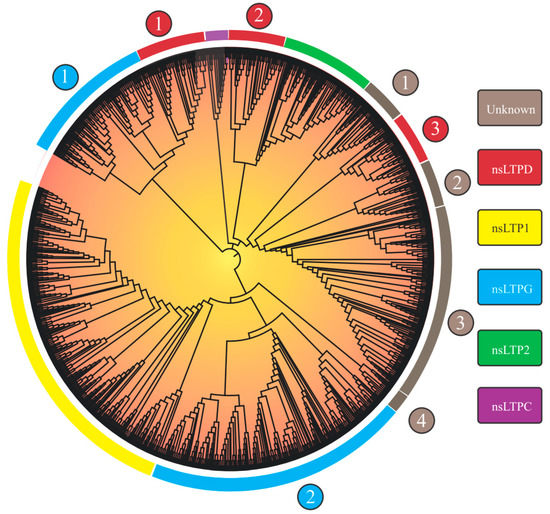
Figure 1. Neighbor-joining tree (based on 8CM nsLTP domains) of 1191 non-specific lipid transfer proteins (nsLTPs) predicted in Marchantia polymorpha, Ceratopteris richardii, Selaginella moellendorffii, Thuja plicata, Glycine max, Gossypium hirsutum, Lactuca sativa, Manihot esculenta, Mimulus guttatus, Populus trichocarpa, Sinapis alba, Solanum tuberosum, and Spinacea oleracea genomes. All amino acid sequences were aligned using ClustalX2. The obtained result was visualized with the iTOL program. Legend: the numbers (1–4) inside the circles on the edge of the tree indicate different nsLTP subgroups of a given nsLTP group; at the rectangles, the nsLTP group classification is available.
Group separation, obtained from the implemented neighbor-joining (NJ) approach, reprised the nine groups in the Edstam et al. [1] classification. The strategy of performing NJ analysis from 8CM domain sequences (as performed by Edstam et al. [1] and Xue et al. [38]) promoted better group discrimination. The NJ tree derived from the complete nsLTP sequences (8CM + upstream and downstream regions) did not present such a level of resolution (only six groups were formed.
As will be seen in the ‘How structural nsLTP proteomics correlates with current nsLTP classification systems?’ section, nsLTP sequences show high variability in the amino acid sequence. Outside the 8CM region, the mentioned variability is accentuated, which causes greater noise in the distance analysis, resulting in an efficiency reduction in the formation of ‘true’ groups. Although reduced, compared to other nsLTP regions, the variability of the 8CM region was also a significant factor in the analysis using the NJ method. This is evidenced by the low bootstrap values of the first branches formed and in nsLTP NJ analysis for a manifold of species (see works by Fang et al. [30] and Vangelisti et al. [36], among others, in Table 1). Bootstrap values reflect the proportion of trees/replicates in which a recovered grouping is presented (in other words, a measure of support for that group). Despite reduced bootstrap values, the obtained tree topology was in accordance with the composition of the characterized seed sequences used to perform the nsLTP classification.
Regarding the nsLTPs’ composition in the scrutinized species, L. sativa, despite not having the highest amount of nsLTPs in its genome (Table 2 and Table 3), was the species which presented the greatest variety of these peptides (Table 3), with at least one member of each of the nine groups found. M. polymorpha, in turn, had the lowest variety of nsLTPs (presenting members only for the ‘LTP1’, ‘LTP2’, ‘LTPD’, ‘LTPG’, ‘Unknown 1’, and ‘Unknown 4’ groups; Table 3), a fact that is possibly associated with its nsLTPs’ small genomic amount. Results for this species, however, indicated that it presented nsLTP groups (e.g., ‘LTP1’, ‘LTP2’, ‘Unknown 1’, and ‘Unknown 4’) not yet identified in previous studies (i.e., in Edstam et al. [1] and Fonseca-García et al. [34]).
Table 3. nsLTP quantification by categories in the 12 analyzed plant genomes.
| Plant Categorization | Common Name | Genome Version * | 2n | Genome Size (Gb) | Mining Method ** | Number of NR Loci | ||||
|---|---|---|---|---|---|---|---|---|---|---|
| Higher Classification | Family | Species | BLASTp | RegEx | HMM | |||||
| Bryophyta | Marchantiaceae | Marchantia polymorpha | Common liverwort | Mpolymorpha_320_v3.1 | 18 | ~0.29 | 0 | 2 | 21 | 21 |
| Pteridophyta | Pteridaceae | Ceratopteris richardii | Triangle waterfern | Crichardii_676_v2.1 | 78 | ~11.25 | 0 | 64 | 65 | 65 |
| Selaginellaceae | Selaginella moellendorffii | Spikemoss | Smoellendorffii_91_v1.0 | 16 | ~0.1 | 0 | 0 | 36 | 36 | |
| Gymnosperm | Cupressaceae | Thuja plicata | Western redcedar | Tplicata_572_v3.1 | 22 | ~12.5 | 4 | 12 | 112 | 112 |
| Angiosperm | Malvaceae | Gossypium hirsutum | Cotton | Ghirsutum_527_v2.1 | 52 | ~2.43 | 67 | 54 | 218 | 218 |
| Asteraceae | Lactuca sativa | Lettuce | Lsativa_467_v5 | 18 | ~2.5 | 55 | 44 | 105 | 105 | |
| Euphorbiaceae | Manihot esculenta | Cassava | Mesculenta_671_v8.1 | 36 | ~0.7 | 29 | 28 | 98 | 98 | |
| Phrymaceae | Mimulus guttatus | Monkeyflower | MguttatusTOL_551_v5.0 | 28 | ~0.4 | 14 | 22 | 114 | 114 | |
| Salicaceae | Populus trichocarpa | Black cottonwood | Ptrichocarpa_533_v4.1 | 19 | ~0.5 | 25 | 22 | 85 | 85 | |
| Brassicaceae | Sinapsis alba | White mustard | Salba_584_v3.1 | 24 | ~0.5 | 23 | 64 | 189 | 189 | |
| Solanaceae | Solanum tuberosum | Potato | Stuberosum_686_v6.1 | 48 | ~0.8 | 35 | 24 | 105 | 105 | |
| Amaranthaceae | Spinacia oleracea | Spinach | Soleracea_575_Spov3 | 12 | ~0.9 | 6 | 8 | 43 | 43 | |
* Phytozome genome version used to infer the conceptual proteome; ** number of nsLTP sequences with validated eight-cysteine domain (8CM). Legend: RegEX (regular expression); HMM (Hidden Markov Model); Gb (gigabase); NR (non-redundant).
This entry is adapted from the peer-reviewed paper 10.3390/antibiotics12050939
References
- Edstam, M.M.; Viitanen, L.; Salminen, T.A.; Edqvist, J. Evolutionary History of the Non-Specific Lipid Transfer Proteins. Mol. Plant 2011, 4, 947–964.
- Yeats, T.H.; Rose, J.K.C. The Biochemistry and Biology of Extracellular Plant Lipid-Transfer Proteins (LTPs). Protein Sci. 2008, 17, 191–198.
- Hauser, M.; Roulias, A.; Ferreira, F.; Egger, M. Panallergens and Their Impact on the Allergic Patient. Allergy Asthma Clin. Immunol. 2010, 6, 1–14.
- Edstam, M.M.; Edqvist, J. Involvement of GPI-Anchored Lipid Transfer Proteins in the Development of Seed Coats and Pollen in Arabidopsis thaliana. Physiol. Plant. 2014, 152, 32–42.
- Wei, K.; Zhong, X. Non-Specific Lipid Transfer Proteins in Maize. BMC Plant Biol. 2014, 14, 281.
- Li, F.; Fan, K.; Ma, F.; Yue, E.; Bibi, N.; Wang, M.; Shen, H.; Hasan, M.M.-U.; Wang, X. Genomic Identification and Comparative Expansion Analysis of the Non-Specific Lipid Transfer Protein Gene Family in Gossypium. Sci. Rep. 2016, 6, 38948.
- Amador, V.C.; Santos-Silva, C.A.D.; Vilela, L.M.B.; Oliveira-Lima, M.; De Santana Rêgo, M.; Roldan-Filho, R.S.; Oliveira-Silva, R.L.D.; Lemos, A.B.; De Oliveira, W.D.; Ferreira-Neto, J.R.C.; et al. Lipid Transfer Proteins (LTPs)—Structure, Diversity and Roles beyond Antimicrobial Activity. Antibiotics 2021, 10, 1281.
- Liu, F.; Zhang, X.; Lu, C.; Zeng, X.; Li, Y.; Fu, D.; Wu, G. Non-Specific Lipid Transfer Proteins in Plants: Presenting New Advances and an Integrated Functional Analysis. J. Exp. Bot. 2015, 66, 5663–5681.
- Srivastava, S.; Dashora, K.; Ameta, K.L.; Singh, N.P.; El-Enshasy, H.A.; Pagano, M.C.; Hesham, A.E.; Sharma, G.D.; Sharma, M.; Bhargava, A. Cysteine-rich Antimicrobial Peptides from Plants: The Future of Antimicrobial Therapy. Phytother. Res. 2021, 35, 256–277.
- Oliveira-Lima, M.; Benko-Iseppon, A.; Neto, J.; Rodriguez-Decuadro, S.; Kido, E.; Crovella, S.; Pandolfi, V. Snakin: Structure, Roles and Applications of a Plant Antimicrobial Peptide. Curr. Protein Pept. Sci. 2017, 18, 368–374.
- Kalla, R.; Shimamoto, K.; Potter, R.; Nielsen, P.S.; Linnestad, C.; Olsen, O.-A. The Promoter of the Barley Aleurone-Specific Gene Encoding a Putative 7 KDa Lipid Transfer Protein Confers Aleurone Cell-Specific Expression in Transgenic Rice. Plant J. 1994, 6, 849–860.
- Douliez, J.-P.; Michon, T.; Elmorjani, K.; Marion, D. Mini Review: Structure, Biological and Technological Functions of Lipid Transfer Proteins and Indolines, the Major Lipid Binding Proteins from Cereal Kernels. J. Cereal Sci. 2000, 32, 1–20.
- Pasquato, N.; Berni, R.; Folli, C.; Folloni, S.; Cianci, M.; Pantano, S.; Helliwell, J.R.; Zanotti, G. Crystal Structure of Peach Pru p 3, the Prototypic Member of the Family of Plant Non-Specific Lipid Transfer Protein Pan-Allergens. J. Mol. Biol. 2006, 356, 684–694.
- Hoh, F.; Pons, J.-L.; Gautier, M.-F.; De Lamotte, F.; Dumas, C. Structure of a Liganded Type 2 Non-Specific Lipid-Transfer Protein from Wheat and the Molecular Basis of Lipid Binding. Acta Crystallogr. D Biol. Crystallogr. 2005, 61, 397–406.
- Gincel, E.; Simorre, J.-P.; Caille, A.; Marion, D.; Ptak, M.; Vovelle, F. Three-Dimensional Structure in Solution of a Wheat Lipid-Transfer Protein from Multidimensional 1H-NMR Data. A New Folding for Lipid Carriers. Eur. J. Biochem. 1994, 226, 413–422.
- Lerche, M.H.; Poulsen, F.M. Solution Structure of Barley Lipid Transfer Protein Complexed with Palmitate. Two Different Binding Modes of Palmitate in the Homologous Maize and Barley Nonspecific Lipid Transfer Proteins. Protein Sci. 1998, 7, 2490–2498.
- Boutrot, F.; Chantret, N.; Gautier, M.-F. Genome-Wide Analysis of the Rice and Arabidopsis Non-Specific Lipid Transfer Protein (NsLtp) Gene Families and Identification of Wheat NsLtp Genes by EST Data Mining. BMC Genom. 2008, 9, 86.
- Jülke, S.; Ludwig-Müller, J. Response of Arabidopsis thaliana Roots with Altered Lipid Transfer Protein (LTP) Gene Expression to the Clubroot Disease and Salt Stress. Plants 2015, 5, 2.
- Wang, H.W.; Hwang, S.-G.; Karuppanapandian, T.; Liu, A.; Kim, W.; Jang, C.S. Insight into the Molecular Evolution of Non-Specific Lipid Transfer Proteins via Comparative Analysis Between Rice and Sorghum. DNA Res. 2012, 19, 179–194.
- Salminen, T.A.; Blomqvist, K.; Edqvist, J. Lipid Transfer Proteins: Classification, Nomenclature, Structure, and Function. Planta 2016, 244, 971–997.
- Liu, W.; Huang, D.; Liu, K.; Hu, S.; Yu, J.; Gao, G.; Song, S. Discovery, Identification and Comparative Analysis of Non-Specific Lipid Transfer Protein (NsLtp) Family in Solanaceae. Genom. Proteom. Bioinform. 2010, 8, 229–237.
- Tapia, G.; Morales-Quintana, L.; Parra, C.; Berbel, A.; Alcorta, M. Study of NsLTPs in Lotus Japonicus Genome Reveal a Specific Epidermal Cell Member (LjLTP10) Regulated by Drought Stress in Aerial Organs with a Putative Role in Cutin Formation. Plant Mol. Biol. 2013, 82, 485–501.
- Li, J.; Gao, G.; Xu, K.; Chen, B.; Yan, G.; Li, F.; Qiao, J.; Zhang, T.; Wu, X. Genome-Wide Survey and Expression Analysis of the Putative Non-Specific Lipid Transfer Proteins in Brassica rapa L. PLoS ONE 2014, 9, e84556.
- Ji, J.; Lv, H.; Yang, L.; Fang, Z.; Zhuang, M.; Zhang, Y.; Liu, Y.; Li, Z. Genome-Wide Identification and Characterization of Non-Specific Lipid Transfer Proteins in Cabbage. PeerJ 2018, 6, e5379.
- Hairat, S.; Baranwal, V.K.; Khurana, P. Identification of Triticum Aestivum NsLTPs and Functional Validation of Two Members in Development and Stress Mitigation Roles. Plant Physiol. Biochem. 2018, 130, 418–430.
- Kouidri, A.; Whitford, R.; Suchecki, R.; Kalashyan, E.; Baumann, U. Genome-Wide Identification and Analysis of Non-Specific Lipid Transfer Proteins in Hexaploid Wheat. Sci. Rep. 2018, 8, 17087.
- Zhang, M.; Kim, Y.; Zong, J.; Lin, H.; Dievart, A.; Li, H.; Zhang, D.; Liang, W. Genome-Wide Analysis of the Barley Non-Specific Lipid Transfer Protein Gene Family. Crop J. 2019, 7, 65–76.
- D’Agostino, N.; Buonanno, M.; Ayoub, J.; Barone, A.; Monti, S.M.; Rigano, M.M. Identification of Non-Specific Lipid Transfer Protein Gene Family Members in Solanum Lycopersicum and Insights into the Features of Sola l 3 Protein. Sci. Rep. 2019, 9, 1607.
- Li, G.; Hou, M.; Liu, Y.; Pei, Y.; Ye, M.; Zhou, Y.; Huang, C.; Zhao, Y.; Ma, H. Genome-Wide Identification, Characterization and Expression Analysis of the Non-Specific Lipid Transfer Proteins in Potato. BMC Genom. 2019, 20, 375.
- Fang, Z.; He, Y.; Liu, Y.; Jiang, W.; Song, J.; Wang, S.; Ma, D.; Yin, J. Bioinformatic Identification and Analyses of the Non-Specific Lipid Transfer Proteins in Wheat. J. Integr. Agric. 2020, 19, 1170–1185.
- Song, X.; Li, E.; Song, H.; Du, G.; Li, S.; Zhu, H.; Chen, G.; Zhao, C.; Qiao, L.; Wang, J.; et al. Genome-Wide Identification and Characterization of Nonspecific Lipid Transfer Protein (NsLTP) Genes in Arachis Duranensis. Genomics 2020, 112, 4332–4341.
- Song, S.; You, J.; Shi, L.; Sheng, C.; Zhou, W.; Dossou, S.S.K.; Dossa, K.; Wang, L.; Zhang, X. Genome-Wide Analysis of NsLTP Gene Family and Identification of SiLTPs Contributing to High Oil Accumulation in Sesame (Sesamum Indicum L.). Int. J. Mol. Sci. 2021, 22, 5291.
- Duo, J.; Xiong, H.; Wu, X.; Li, Y.; Si, J.; Zhang, C.; Duan, R. Genome-Wide Identification and Expression Profile under Abiotic Stress of the Barley Non-Specific Lipid Transfer Protein Gene Family and Its Qingke Orthologues. BMC Genomics 2021, 22, 674.
- Fonseca-García, C.; Solis-Miranda, J.; Pacheco, R.; Quinto, C. Non-Specific Lipid Transfer Proteins in Legumes and Their Participation During Root-Nodule Symbiosis. Front. Agron. 2021, 3, 660100.
- Liang, Y.; Huang, Y.; Chen, K.; Kong, X.; Li, M. Characterization of Non-Specific Lipid Transfer Protein (NsLtp) Gene Families in the Brassica Napus Pangenome Reveals Abundance Variation. BMC Plant Biol. 2022, 22, 21.
- Vangelisti, A.; Simoni, S.; Usai, G.; Mascagni, F.; Ventimiglia, M.; Natali, L.; Cavallini, A.; Giordani, T. In Silico Genome-Wide Characterisation of the Lipid Transfer Protein Multigenic Family in Sunflower (H. Annuus L.). Plants 2022, 11, 664.
- De Oliveira Silva, L.; Da Silva Pereira, L.; Pereira, J.L.; Gomes, V.M.; Grativol, C. Divergence and Conservation of Defensins and Lipid Transfer Proteins (LTPs) from Sugarcane Wild Species and Modern Cultivar Genomes. Funct. Integr. Genom. 2022, 22, 235–250.
- Xue, Y.; Zhang, C.; Shan, R.; Li, X.; Tseke Inkabanga, A.; Li, L.; Jiang, H.; Chai, Y. Genome-Wide Identification and Expression Analysis of NsLTP Gene Family in Rapeseed (Brassica Napus) Reveals Their Critical Roles in Biotic and Abiotic Stress Responses. Int. J. Mol. Sci. 2022, 23, 8372.
This entry is offline, you can click here to edit this entry!