Your browser does not fully support modern features. Please upgrade for a smoother experience.
Please note this is an old version of this entry, which may differ significantly from the current revision.
Subjects:
Energy & Fuels
A nanofluid consisting of 0.5% MWCNTs, water (base fluid), and CTAB (surfactant) was selected with a sonication time of three and quarter hours, considering that these preparation conditions were practically the best. This fluid was circulated in an installed outdoor, weather-exposed PVT system. Experiments were carried out in the harsh weather conditions of Baghdad, Iraq, to test the effectiveness of the PVT system and the nanofluid.
- SWCNTs
- photovoltaic/thermal
- stability
- thermal conductivitythermal conductivity
- sonication timesonication time
- surfactantsurfactant
1. Introduction
Heat transfer from a hot to a colder place is an important, challenging, and needed application in many ways, including for power generation, industry, production processes, chemical industries, vehicles, microelectronics, food industries applications, etc. Improving the heat exchange performance of any application in the sense of reducing the time required for heat transfer will reduce the processing time, increase the life of the equipment, and save energy [1]. An example of a heat exchanger is a radiator in cars. The improvement of heat transfer means the use of smaller heat exchangers to cool the engine water, as a result reducing the weight of the car [2], which means reducing fuel consumption and the consequent reduction in emissions [3].
For many years, traditional fluids such as water, oil, ethylene glycol, etc., have been relied on as heat transfer fluids in industrial and commercial applications. These fluids have performed their duties as best they can. These fluids have a low thermal conductivity, which hinders the rapid transfer and disposal of heat. The negative property of these fluids has caused a limitation in their use in dynamic transfer (fast charging and discharging processes) applications [4]. Micro-sized particles were added to these fluids with high conductivity and this addition improved the thermal conductivity of the product. Most of the added particles were either metals or metal oxides. However, these fluids suffered from low stability, meaning the speed of particles gathering and depositing at the bottom of the container [5], in addition to causing corrosion of components, blockage of narrow passages, and low pressure of the flowing fluid [6]. After the emergence of nanoparticles, the interest shifted to developing nanofluids with high thermal conductivity by adding different types of nanoparticles to the base fluid (usually one of the conventional fluids). These nanofluids attracted the interest of manufacturers and researchers because they enhance thermal conductivity in liquids to which they are added in a small proportion. With this addition, the thermophysical properties of the emulsion are affected, and the result is remarkable [7]. Precisely prepared nanofluids do not cause a decrease in flow pressure and significantly improve heat transfer properties [8]. Therefore, preparing the nanofluid to be stable for a long period is a prerequisite for using this fluid in heat transfer applications. It is also an important requirement in maintaining equipment and raising its efficiency.
The strategic shift of the countries of the world today towards environmentally friendly renewable energies to reduce global environmental risks such as global warming and climate change has caused an increase in the share of renewable energy in the production of electric energy at the expense of fossil fuels (the cause of the problems mentioned). It should be noted that solar energy has begun to occupy this position in most parts of the world [9]. It is well known that photovoltaic cells are among the solar energy applications that have occupied their place among the alternatives for generating renewable electricity. Interest in installing and operating PV stations all over the world is escalating due to the growing interest in environmental cleanliness. This is provided by PV systems available around the world operating on clean fuel, which is the sun’s rays.
It is worth mentioning that there are many factors driving the solar energy transition, such as incentives, policy, regulations, behavior, and sustainability [10,11,12]. Many parameters affect PV panel performance, such as technology, design, irradiance, dust, humidity, ambient temperatures, and other environmental parameters [13,14]. These cells are affected by many environmental influences, such as shadows, temperature, relative humidity, and dust [15,16,17,18]. Theoretically, the operation of PV modules under standard conditions (solar radiation intensity of 1000 W/m2, air temperature of 25 °C, and air mass of 1.5) results in the highest electrical efficiency. So, the higher the solar radiation, the more electricity the PV module generates. Practically speaking, it is not at all like this. As the bulk of the solar radiation is absorbed by the cell to increase its temperature, the smaller part goes to generate electricity. High cell temperature causes a decrease in the generated power and a deterioration in the electrical efficiency of the system [13]. The researchers proposed to reduce the negative effects of this thorny issue (since the best fields for creating photovoltaic fields are in deserts with high solar radiation) by using PVT systems [19].
PVT systems are solar collectors consisting of a photovoltaic panel connected to a thermal solar storage tank aimed at withdrawing the heat collected in the solar panel and cooling it to improve its electrical efficiency and benefit from this withdrawn heat in thermal applications [20]. The increase in the temperature of the solar panel causes the deterioration of the generated electrical power, while its cooling causes the improvement of this productivity. PVT systems can be cooled with water or different nanofluids, many of which have been tested [21].
The thermal conductivity and stability of the nanofluid are the two main characteristics affecting heat transfer efficiency. Studies have shown that SWCNTs and MWCNTs have very high thermal conductivities that are not comparable to any metallic or metal oxide nanoparticles known to date. Usually, most researchers are not interested in the details of preparing the nanofluid as they adopt one procedure for all the prepared nanofluids. Here is the question: What proves that the fluids have taken their right of preparation? Meaning, each fluid (depending on the type of nanoparticles and the added mass fraction) needs preparation time and treatment care that differs from other fluids. In most of the studies presented, no attention is shown for this issue.
Nanofluid preparation is not sufficient to reach the optimal performance of a nanofluid-cooled PVT system. There are many parameters, such as the heat exchanger design and weather conditions (such as solar radiation intensity and ambient temperature).
2. Base Fluid Type Effect
In the first part of the experiments, the base liquid was mixed with the nanoparticles in predetermined proportions of 0.1, 0.5, 0.75, and 1.0 wt.%. The TC of the prepared nanofluids is shown in Figure 1. The TC of water is higher than the rest. All thermal conductivities were improved when MWCNT was added to all tested base fluids. However, the TC of the aqueous origin nanofluid was superior to the rest of the species and for all added ratios. At the same time, TC was improved by increasing the amount of MWCNTs added for all base fluids. When 1% of MWCNTs was added, the improvement values were 21.9%, 18.94%, 23.8%, and 33.33% for water, EG, PG, and HTO, respectively, compared to base fluid TC. At this mass fraction, water TC exceeded EG, PG, and HTO by 119.5%, 308%, and 210%, respectively. These results indicate that using water as a base fluid is the best among the tested fluids.
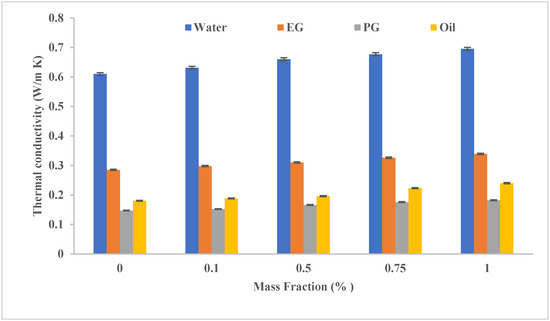
Figure 1. The effect of base fluid type and MWCNT (added in variable mass fractions) on the TC of the resulting nanofluid.
Figure 2 shows the effect of the base fluid type and the mass fraction of the added SWCNTs on the ST of the prepared nanofluids. In general, all the prepared fluids had a zeta potential higher than 40 mV, which means a high ST. When adding 0.1% MWCNT, the zeta potential exceeded 70 mV for all base fluids tested, which is excellent stability. At all tested added mass fractions, aqueous nanofluids had the highest stability even at high addition rates (1%). When MWCNTs were added by a mass fraction of 0.5%, the water-based nanofluid stability exceeded EG, PG, and oil stabilities by 11.6%, 20.3%, and 16.66%, respectively. However, all these nanofluids are characterized by high zeta potential (more than 60 mV).
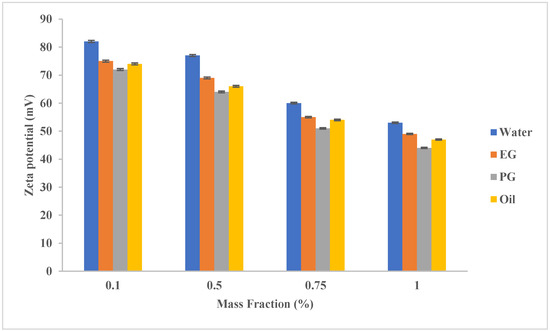
Figure 2. The effect of base fluid type and MWCNT (added in variable mass fractions) on the stability (zeta potential) of the resulting nanofluid.
3. Surfactant Type Effect
In the second set, 0.5% (mass fraction) of the tested surfactants was added to the prepared emulsions, adopted from the results of Mohd Saidi et al. in 2022 [51]. The effect of the added surfactant was very limited on the resulting thermal conductivity, as it did not increase in a noticeable way, as Figure 3 indicated. SUR I showed a clear effect when it was added to the oil, while for the rest of the fluids, its effect was not clear. The increase in the TC of an aqueous nanofluid was 0.64%, 1.5%, 1.6%, and 0.14% for the added mass fractions of 0.1, 0.5, 0.75, and 1.0%, respectively.
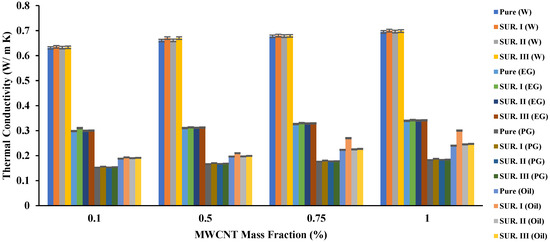
Figure 3. The effect of base fluid and surfactant type and MWCNT (added in variable mass fractions) on the TC of the resulting nanofluid.
Despite the limited effect of the tested surfactants on the resulting TC, its effect on the ST of the resulting fluids was clear, as Figure 4 manifests. The measured zeta potential values of all tested nanofluids increased in varying proportions depending on the type of base fluid and the surfactant added. For example, for water at an MWCNT mass fraction of 0.5%, an enhancement rate of 10.3%, 5.2%, and 6.5% for the addition of SUR I, SUR II, and SUR III was measured, respectively. The results of the tests show that CTAB increased the stability of any nanofluid added to it more than the rest of the tested surfactants. For example, when 1% of MWCNT was added, the percentage of increase in zeta potential (ZP) was 7.4% and 5.4% for water nanofluids compared to SUR II and SUR III addition, respectively. When SUR I was added to nano-EG, the resulting increments in ZP were 5.7% and 3.77% compared to SUR II and SUR III addition, respectively. When PG was used, the resulting increments in ZP were 2% and 4.15% compared to SUR II and SUR III addition, respectively. Lastly, when HTO was used, the resulting increments in ZP were 10.2% and −1.5% compared to SUR II and SUR III addition, respectively. One of the main reasons for SUR I’s superiority may be its acidic nature. The results of the previous two paragraphs show that using water as a base fluid and CTAB as a surfactant gives the highest TC and ST.
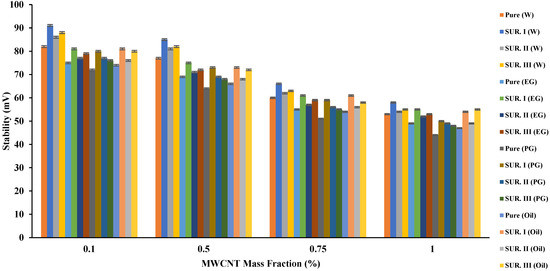
Figure 4. The effect of base fluid and surfactant type and MWCNT (added in variable mass fractions) on the stability of the resulted nanofluid.
4. Sonication Time Effect
In this set of experiments, nano-emulsion consisted of 0.5 (wt.%) MWCNT added to water while employing CTAB as a surfactant. All nanofluids were prepared again using variable sonication time. Seven different timings were tested (1:30, 2:00, 2:30, 3:00, 3:15, 3:30, and 4:00). The prepared emulsions in this set were also subjected to TC and ST tests to evaluate the best sonication time for the tested emulsions. Figure 5 illustrates the effect of sonication time on the TC of the tested nano-emulsions. When MWCNT was added with a mass fraction of 0.1%, the TC increased after two and a half hours of sonication (0.635 W/m K). When the sonication time was increased to three and quarter hours, the TC was decreased to (0.634 W/m K). As for adding 0.5% of MWCNT, the highest TC was at a sonication time of three and a quarter hours and three and a half hours (0.67 W/m K). The TC decreased slightly (0.65 W/m K) when the sonication time was extended to four hours. The best TC for the case of adding 0.75% of MWCNT was at a sonication time of three and a half hours. As for the case of adding 1%, the highest TC was measured at four hours. From the above, it can be concluded that each mixing sample has an optimal sonication time, so this time should be tested with small samples before the quantitative production of the nanofluid. When a small mass fraction is added, it requires less sonication time than adding a large mass fraction of nanoparticles. This is a normal condition, as particles with a small mass fraction disintegrate and spread faster than those with a large mass fraction, which are attracted due to the proximity of the distances between them. Increasing the sonication time, then, the appropriate time causes a loss in TC and also causes losses in costs as the effect of the process is reversed.
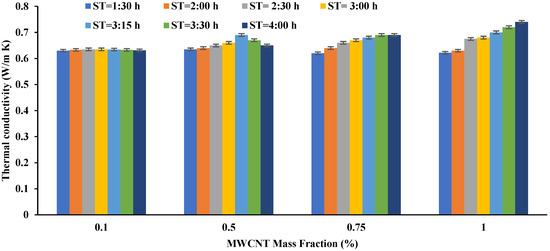
Figure 5. The effect of sonication time on the TC of the prepared nanofluids (MWCNT + Water + CTAB).
Figure 6 shows the effect of sonication time variation on the prepared nanofluids’ ST. The ST increased with increasing sonication time, reaching its maximum at three and quarter hours for the addition of 0.1% and 0.5%. As for the cases of 0.75% and 1%, the best ST was achieved at a time of four hours. It is noteworthy that there is a relationship between ST and TC, where the ST decreased after reaching the appropriate sonication time, which is almost the same as the result achieved for TC.
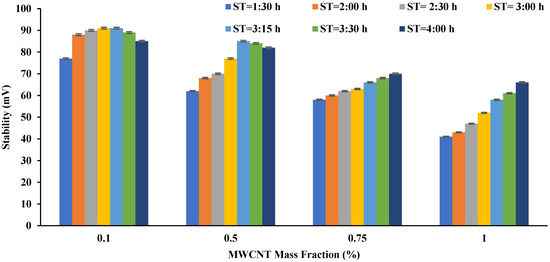
Figure 6. The effect of sonication time on the ST of the prepared nanofluids (MWCNT + Water + CTAB).
From the above results, water can be considered the preferred base fluid that provides the best TC and ST. Additionally, CTAB caused the best results in terms of TC and ST, so it is preferred. As for which MWCNT mass fraction should be added, 0.5% was selected to reduce the cost of nanoparticles and the sonication process. Additionally, the ST provided by this mass fraction nanofluid is excellent, and the TC that differs from the 1% mass fraction is relatively low. So, in the next set of tests, the used nanofluid consisted of 0.5% MWCNT, water, and 0.5 wt.% CTAB.
5. Outdoor Tests Environmental Conditions
The current study was carried out in Baghdad, Iraq, and it was chosen to work on cooling a PVT system with the prepared nanofluid in the most severe weather conditions. Therefore, the months of July and August were chosen for the examinations. These two months are characterized by the highest yearly temperatures, as the average temperature in the shade exceeded 50 °C most of the study days at noon. Moreover, the average solar radiation intensity exceeded 1000 W/m2 at noon. Figure 7 shows the measurements of solar radiation, atmospheric temperatures, and surface temperatures of the PV panel for a standalone module and the two PVT systems cooled by water and nanofluid. The temperature of the PV panels was raised to a maximum of 78 °C at noon (2:15 pm). At this time, the ambient temperature is only 50 °C. Here, it must be emphasized that the ambient temperature is measured in the shade while the temperature of the PV panel surface measured is completely exposed to the sun. The results of the figure show decrements in the PV panel surface temperature when cooled by water and nanofluid, and the cooling effect is greater for the latter case. This result was indicated in all studies that used nanofluids in cooling PVT systems. However, the cooling efficiency differs; for example, for the case of the selected nanofluid, and for calculating the average temperature drop for a full day’s operation, the temperature drop was around 57.5% and 17% compared to the two cases of the standalone PV module and water-cooled PVT system.
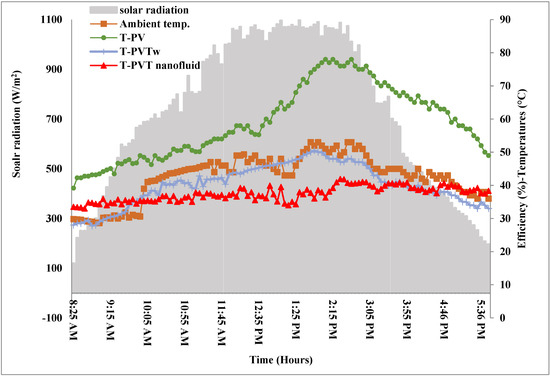
Figure 7. Solar radiation and temperature measured for the tested systems.6
6. PVT System Efficiencies
Figure 8 shows the change in efficiencies (electrical, thermal, and total) over time for the three systems tested. A standalone PV does not generate anything other than low electrical efficiency due to the high temperature of the PV panel. During the experiments, the current and voltage were measured from the beginning of the day (8 AM) to the evening (7 PM). The power values were found using Equation (3), including the determination of the electrical efficiency at each measurement period using Equation (5). The highest value of the electrical efficiency of this system reached 10% at 8:00 AM and started declining to reach the lowest value (4.5%) at midday. At 8:00 AM, the solar intensity was 119 W/m2, which is insufficient to reach the maximum efficiency of the PV panel. When the solar intensity reached its maximum value of 1097 W/m2 at 1:30 PM, the panel temperature reached 70 °C, which caused the efficiency deterioration mentioned. As for the water-cooled PVT (PVTw) system, the electrical efficiency decreased at midday to reach its lowest value of 6.5%. When cooling the PVT system with the prepared nanofluid (PVTnf), the lowest efficiency obtained was 9.07%. Compared to a full-day operation, the increase in the electrical efficiency of the nanofluid cooling system was 88.85% and 44% compared to the standalone PV and water-cooled PVT systems, respectively.
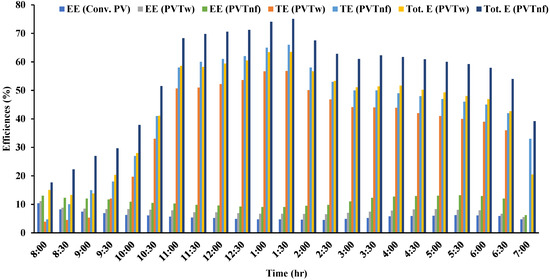
Figure 8. Efficiencies of the tested system variation with time.
Similarly, the useful accumulated heat was calculated using Equation (4) since the values of To and Ti were measured throughout the time and the water mass flow rate was predetermined. Using this temperature in Equation (6), the thermal efficiency can be obtained at each measurement period. As for the increase in thermal efficiency when cooling with the prepared nanofluid, it was higher than the water-cooling system by about 20%. While the electrical efficiency of all systems decreased at midday, the thermal efficiency of the nanofluid-cooled PVT system increased due to the high TC of this fluid. The nanofluid-cooled PVT system achieved 75.08% maximum total efficiency, while the water-cooled PVT system’s maximum total efficiency did not exceed 63.5%.
This entry is adapted from the peer-reviewed paper 10.3390/su15097642
This entry is offline, you can click here to edit this entry!