You're using an outdated browser. Please upgrade to a modern browser for the best experience.
Please note this is a comparison between Version 2 by Jason Zhu and Version 1 by Desirée Victoria-Montesinos.
Malnutrition in cancer patients is one of the most influential factors in the evolution and mortality of such patients. To reduce the incidence of malnutrition, it is necessary to establish a correct nutritional intervention. For this purpose, precise tools and indicators must be developed to determine the patient’s condition.
- bioimpedance
- cancer therapy
- radiotherapy
- phase angle
- nutrition
1. Introduction
Cancer is a disease characterized by the development of abnormal cells, which can appear in any area of the organism, dividing, growing, or spreading with no mechanics of control [1]. Currently, neoplastic disease remains one of the main causes of morbidity and mortality worldwide, with an estimated incidence of 18.1 million new cases by the year 2020, making it one of the diseases with the greatest impact on healthcare [2]. Therefore, its monitoring is crucial since its clinical impact is of great relevance [3].
It has been observed that, at the time of diagnosis, there is a high percentage of patients who present involuntary weight loss, which causes the patient to begin the treatment of the disease with an impaired nutritional status [4]. Poor nutritional status is closely related to an increase in the toxicity and complications of treatment, longer hospital admissions, failure or interruption of treatments, infections, readmissions, and reduced quality of life, and is responsible for 10–20% of mortality in oncologic patients [5]. Currently, the multidisciplinary approach is considered the best option to deal with sarcopenia and cachexia caused by cancer, recommending nutritional intervention as an essential component of the therapy, being the efficient screening and also an indispensable complement [6].
Consequently, several consensus documents have been published to ensure early and proper nutritional monitoring and intervention in hospitals [7].
On the other hand, different studies emphasize the importance of finding markers or diagnostic protocols capable of differentiating between the different degrees of malnutrition in patients in a specific and reliable way [8]. In recent years, the role of bioimpedance and phase angle assessment has been analyzed because it allows to evaluate the nutritional status of the patient in a simple, fast, non-invasive, and convenient way, being able to obtain prognostic values. The phase angle is derived from bioelectrical impedance analysis (BIA), which measures the opposition (impedance) to the flow of an electrical current through body tissues. The phase angle is the arctangent of the reactance and resistance values obtained during the BIA [9]. A higher PA typically indicates better cellular health and integrity, while a lower PA suggests compromised cellular function or malnutrition [10]. Research has demonstrated that PA correlates well with changes in body composition and is a reliable indicator of nutritional status [11]. In this way, it is useful in prevention and diagnosis, complementing the other markers and improving the specificity and diagnostic sensitivity of the tools currently used to avoid late diagnoses and states of malnutrition that may complicate the treatment and recovery process [12]. In fact, some investigations utilized the PA as a marker to observe the role of different treatments in cancer patients with the aim of analyzing the unfavorable modifications at the body level that a certain treatment, such as radiotherapy, chemotherapy, or surgery, may cause, thereby implementing an early nutritional intervention that helps the patients to prevent potential malnutrition [13][14][15][16][17].
In several systematic reviews performed on patients with various types of cancer, it has been observed that a low-phase angle is associated with an impaired nutritional and functional status, which may increase the morbidity and mortality of the subject suffering from the disease [18][19]. It also seems to be a good marker of nutritional status, providing additional data and contributing to more rigorous nutritional evaluations in patients with neoplasms [20]. In fact, a recent meta-analysis, which included 14 studies and 2625 participants, concluded that the phase angle could become a major prognostic factor for survival in cancer patients [18].
On the other hand, dynamometry is a widely used method to assess muscle strength and functional capacity in patients with cancer [21]. The measurement of muscle strength using dynamometry has been proposed as a potential marker of malnutrition in these patients [22]. Several studies have been conducted to investigate the association between muscle strength and malnutrition in cancer patients.
A study conducted by Barata et al. found that handgrip strength, as measured by dynamometry, was significantly correlated with nutritional status in patients with advanced lung cancer [23]. Similarly, another study by Kilgour et al. showed that handgrip strength was a significant predictor of survival in patients with advanced pancreatic cancer . In addition, a recent systematic review and meta-analysis carried out by López-Bueno et al. evaluated the relationship between muscle strength and mortality in cancer patients. The review included 48 studies and concluded that muscle strength measured by dynamometry was a reliable marker of mortality in patients with cancer [24]. In summary, the functional capacity measured by dynamometry is an important marker of malnutrition in people with cancer.
2. Study Characteristics
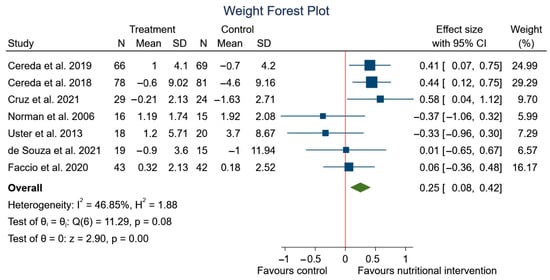
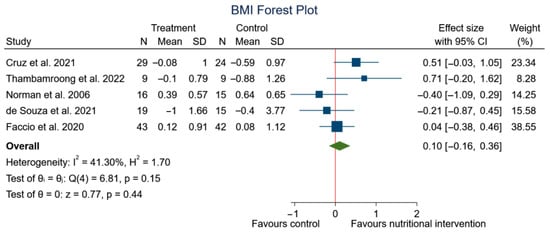
The main characteristics of the nine included studies are summarized in Table 1. The articles were published between 2006 and 2023. A total of 606 participants (43.9% of women) with a mean age of 58.6 ± 11.2 years were included in the present meta-analysis. The stage of the disease was reported in all studies. Regarding BMI, the mean value was 24.0 ± 3.6 Kg/m2. In terms of geographical regions, five different countries were identified: Italy [25][26]; Thailand [27]; Germany [28]; Brazil [29][30][31]; Switzerland [32]. All the studies were conducted with participants from only one country. In five studies [25][26][28][29][30], a bioimpedance measurement was performed before and after the nutritional intervention, obtaining the phase angle. In six of them [25][26][27][28][31][32], functionality was analyzed via a handgrip strength test. On the other hand, the evolution of body weight was measured in seven articles [25][26][28][29][30][31][32], while BMI was only analyzed in five of them [27][28][29][30][31].Table 1. Descriptive data of the study participants (N = 606).
| Reference | Year | Study Groups | Total ( | n | ) | Women (%) | Age (Mean) | BMI (kg/m | 2 | ) | Cancer | Current Treatment | BIA Methods/Instrument | Nutritional Intervention | Hydraulic Hand Dynamometer | ||
|---|---|---|---|---|---|---|---|---|---|---|---|---|---|---|---|---|---|
| Cereda et al. | [26] | 2018 | CS ( | n = | 81) CS + ONS ( | n = | 78) | 159 | 28.3 | 65.1 | 24.2 | Head and neck | Conventional (1.8-to-2 Gy/fraction) 3D conformal RT | NutriLAB, Akern/RJL | ONS (energy-dense, high-protein, omega-3-enriched oral formula) | DynEx | |
| Cereda et al. | [25] | 2019 | CS ( | n = | 84) CS + WP ( | n = | 82) | 166 | 39.8 | 65.4 | 22.2 | Lung, stomach, esophagus, pancreas, colon, blood, breast, head, and neck | Standard chemotherapy regimens | NutriLAB, Akern/RJL | Two sachets/day of cow milk WP (20 g of proteins) | DynEx | |
| Norman et al. | [28] | 2006 | Cr ( | n | = 16) C ( | n | = 15) | 31 | 35.5 | 63.4 | 24.9 | Colorectal cancer | Chemotherapy | BIA 2000 M | Creatine supplementation | Digimax electronic dynamometer | |
| Cruz et al. | [29] | 2017 | EPA ( | n | = 29) C ( | n | = 24) | 53 | 20.8 | 55.5 | 21.6 | Oral cavity | Without treatment | Biodynamics Model 450 | EPA-enriched supplement from fish oil (2 g) | NR | |
| Faccio et al. | [30] | 2020 | C ( | n | = 42) ONS ( | n | = 43) | 85 | 60 | 58.8 | 25 | Colorectal, breast, lung, upper digestive tract, ovarian and other cancers | Chemo/radiotherapy | Biodynamics, 310 | ONS (hyper-protein supplement, enriched with L-leucine, vitamins, and minerals |
NR | |
| Thambamroong et al. | [27] | 2022 | C ( | n | = 10) Cur ( | n | = 10) | 20 | NR | 59 | NR | Head and neck cancer | Chemo/radiotherapy | InBody | Curcumin (4000 mg) | NR | |
| Uster et al. | [32] | 2013 | UC ( | n | = 28) NT ( | n | = 30) | 58 | 20.7 | 65 | 22.8 | Breast, lung, head and neck, pancreatic, colorectal, gastrointestinal, renal, prostate, and endometrium cancer. Sarcoma, lymphoma, myeloma, mesothelioma, neuroendocrine tumor, and unknown | NR | NR | Oral nutritional supplements and individual nutritional plan | Jamar | |
| De Souza et al. | [31] | 2021 | C ( | n | = 15) NT ( | n | = 19) | 34 | 100 | 44.8 | 27.3 | Breast cancer | Chemotherapy | NR | Hyper-protein personalized diet | Jamar |
3. Nutritional Intervention
All the studies included in this meta-analysis carried out a nutritional intervention or supplementation in the experimental group. The two studies conducted by Cereda et al. provide nutritional advice in both control and experimental groups [25][26]. In one of these two studies, the patients in the experimental group, called oral nutritional supplement (ONS), received two drinks a day with a high-energy and high-protein formula enriched in omega-3 [26]. In the second study, the experimental group received two sachets daily of a whey protein (WP) formula [25]. Norman et al. also used in their clinical trial a type of nutritional intervention targeted to the experimental group based on a supplement, in this case, creatine [28]. In the clinical trial conducted by Cruz et al., an amount of 2 g of fish oil with eicosapentaenoic acid (EPA) was given to the experimental group as a possible nutritional aid in addition to a diet rich in energy and protein, which was consumed by both groups [29]. Faccio et al. [30], Uster et al. [32], and de Souza et al. [31] provided the intervention group with a high-protein and personalized diet with nutritional supplements. Finally, Thambamroong et al. used curcumin supplementation in cancer patients, comparing the results with the control [27].4. Risk of Study Bias
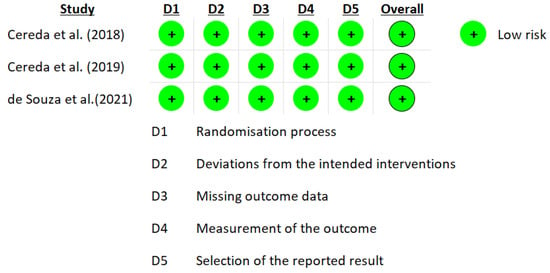
The RoB 2.0 tool developed by Cochrane was used for the risk of bias. The data from the eight studies are represented in Figure 1 and Figure 2 [25][26][27][28][29][30][31][32]. Three studies reported a medium overall risk of bias due to the D5 item “selection of the reported result” [28][30][32]. In general, the included articles reported a low risk in overall risk of bias [25][26][27][31].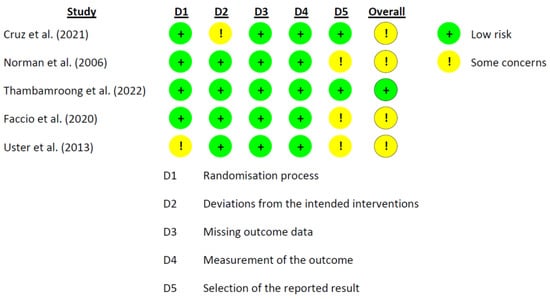
5. Findings from Meta-Analysis
Four meta-analyses were conducted to test the effects of different types of nutritional strategies on the variables phase angle, handgrip strength, BMI, and weight. A random-effects model was used for the phase angle variable, and a fixed-effects model for the rest of the variables. Figure 3 shows a positive and significant correlation between phase angle and nutritional strategy (SMD: 0.43; 95% CI: 0.10 to 0.77; p = 0.01) (I2 = 65.62%; p = 0.02).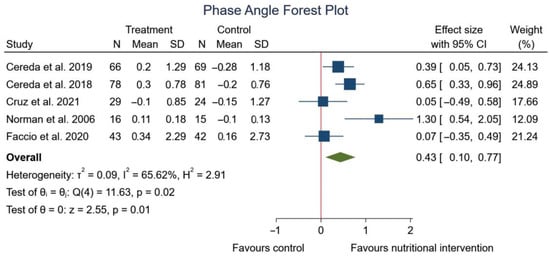
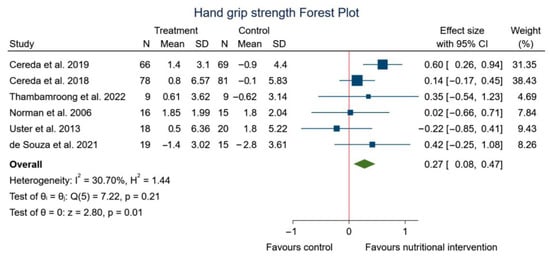
Figure 4.
Forest plot summarizing the impact of nutritional intervention on handgrip using a fixed-effects model. Pooled summary data are presented as standardized mean differences and 95% confidence interval
.
References
- National Institutes of Health (US); Biological Sciences Curriculum Study. Understanding Cancer; National Institutes of Health (US), Eds.; Bethesda: USA, 2007; pp. Internet.
- Sung, H.; Ferlay, J.; Siegel, R.L.; Laversanne, M.; Soerjomataram, I.; Jemal, A.; Bray, F Global Cancer Statistics 2020: GLOBOCAN Estimates of Incidence and Mortality Worldwide for 36 Cancers in 185 Countries. CA Cancer J. Clin 2021, 71, 209–249, https://doi.org/10.3322/caac.21660.
- Brigden, M.; McKenzie, M. Practical Monitoring and Management of Therapy-Related Complications. Can. Fam. Physician 2000, 46, 2258–2268.
- Beirer, A Malnutrition and Cancer, Diagnosis and Treatment. MEMO Mag. Eur. Med. Oncol. 2021, 14, 168–173, https://doi.org/10.1007/s12254-020-00672-3.
- Benoist, S.; Brouquet, A Nutritional Assessment and Screening for Malnutrition. J. Visc. Surg. 2015, 152, S3–S7, https://doi.org/10.1016/S1878-7886(15)30003-5.
- Detopoulou, P.; Voulgaridou, G.; Papadopoulou, S. Phase Angle and Sarcopenia: The Role of Diet in Connection with Lung Cancer Prognosis. Lung 2022, 200, 347–379, https://doi.org/10.1007/s00408-022-00536-z.
- Prado, C.M.; Purcell, S.A.; Laviano, A. Nutrition Interventions to Treat Low Muscle Mass in Cancer. Clin. Nutr. 2017, 36, 11–48., 10.1002/jcsm.12525.
- Truijen, S.P.M.; Hayhoe, R.P.G.; Hooper, L.; Schoenmakers, I.; Forbes, A.; Welch, A.A. Predicting Malnutrition Risk with Data from Routinely Measured Clinical Biochemical Diagnostic Tests in Free-Living Older Populations. Nutrients 2021, 13, 1883, 10.3390/nu13061883.
- Barbosa-Silva, M.C.G.; Barros, A.J.D. Bioelectrical Impedance Analysis in Clinical Practice: A New Perspective on Its Use beyond Body Composition Equations. Curr. Opin. Clin. Nutr. Metab. Care 2005, 8, 311–317, 10.1097/01.mco.0000165011.69943.39.
- Norman, K.; Stobäus, N.; Pirlich, M.; Bosy-Westphal, A. Bioelectrical Phase Angle and Impedance Vector Analysis--Clinical Relevance and Applicability of Impedance Parameters. Clin. Nutr. 2012, 31, 854–861, 10.1016/j.clnu.2012.05.008.
- Genton, L.; Norman, K.; Spoerri, A.; Pichard, C.; Karsegard, V.L.; Herrmann, F.R.; Graf, C.E. Bioimpedance-Derived Phase Angle and Mortality Among Older People. Rejuvenation Res. 2017, 20, 118–124, https://doi.org/10.1089/rej.2016.1879.
- Peixoto da Silva, S.; Santos, J.M.O.; Costa E Silva, M.P.; Gil da Costa, R.M. Cachexia and Its Pathophysiology: Links with Sarcopenia, Anorexia and Asthenia. J. Cachexia Sarcopenia Muscle 2020, 11, 619–635, https://doi.org/10.1002/jcsm.12528.
- Della Valle, S.; Colatruglio, S.; La Vela, V.; Tagliabue, E.; Mariani, L.; Gavazzi, C. utritional Intervention in Head and Neck Cancer Patients during Chemo-Radiotherapy. Nutrition 2018, 51–52, 95–97, https://doi.org/10.1016/j.nut.2017.12.012.
- Di Renzo, L.; Marchetti, M.; Cioccoloni, G.; Gratteri, S.; Capria, G.; Romano, L.; Soldati, L.; Mele, M.C.; Merra, G.; Cintoni, M.; et al.et al. Role of Phase Angle in the Evaluation of Effect of an Immuno-Enhanced Formula in Post-Surgical Cancer Patients: A Randomized Clinical Trial. Eur. Rev. Med. Pharmacol. Sci. 2019, 23, 1322–1334, 10.26355/eurrev_201902_17027.
- Stegel, P.; Kozjek, N.R.; Brumen, B.A.; Strojan, P. Bioelectrical Impedance Phase Angle as Indicator and Predictor of Cachexia in Head and Neck Cancer Patients Treated with (Chemo)Radiotherapy. Eur. J. Clin. Nutr. 2016, 70, 602–606, https://doi.org/10.1038/ejcn.2016.13.
- Tzelnick, S.; Singer, P.; Shopen, Y.; Moshkovitz, L.; Fireman, S.; Shpitzer, T.; Mizrachi, A.; Bachar, G. Bioelectrical Impedance Analysis in Patients Undergoing Major Head and Neck Surgery: A Prospective Observational Pilot Study. J. Clin. Med. 2021, 10, 539, https://doi.org/10.3390/jcm10030539.
- Małecka-Massalska, T.; Powrózek, T.; Prendecka, M.; Mlak, R.; Sobieszek, G.; Brzozowski, W.; Brzozowska, A. Phase Angle as an Objective and Predictive Factor of Radiotherapy-Induced Changes in Body Composition of Male Patients with Head and Neck Cancer. Vivo 2019, 33, 1645–1651, 10.21873/invivo.11650.
- Arab, A.; Karimi, E.; Vingrys, K.; Shirani, F. Is Phase Angle a Valuable Prognostic Tool in Cancer Patients’ Survival? A Systematic Review and Meta-Analysis of Available Literature. Clin. Nutr. 2021, 40, 3182–3190, https://doi.org/10.1016/j.clnu.2021.01.027.
- Di Vincenzo, O.; Marra, M.; Sacco, A.M.; Pasanisi, F.; Scalfi, L. Bioelectrical Impedance (BIA)-Derived Phase Angle in Adults with Obesity: A Systematic Review. Clin. Nutr. 2021, 40, 5238–5248, https://doi.org/10.1016/j.clnu.2021.07.035.
- de Almeida, C.; Penna, P.M.; Pereira, S.S.; Rosa, C.D.; Franceschini, S.D. Relationship between Phase Angle and Objective and Subjective Indicators of Nutritional Status in Cancer Patients: A Systematic Review. Nutr. Cancer 2021, 73, 2201–2210, https://doi.org/10.1080/01635581.2020.1850815.
- Xie, H.; Ruan, G.; Deng, L.; Zhang, H.; Ge, Y.; Zhang, Q.; Lin, S.; Song, M.; Zhang, X.; Liu, X.; et al.et al. Comparison of Absolute and Relative Handgrip Strength to Predict Cancer Prognosis: A Prospective Multicenter Cohort Study. Clin. Nutr. 2022, 41, 1636–1643, https://doi.org/10.1016/j.clnu.2022.06.011.
- Mendes, N.P.; de Barros, T.A.; Faria, B.S.; Aguiar, E.S.; de Oliveira, C.A.; de Souza, E.C.; Pereira, S.S.; Rosa, C.D. Hand Grip Strength as Predictor of Undernutrition in Hospitalized Patients with Cancer and a Proposal of Cut-Off. Clin. Nutr. ESPEN 2020, 39, 210–214, https://doi.org/10.1016/j.clnesp.2020.06.011.
- Barata, A.T.; Santos, C.; Cravo, M.; Vinhas, M.D.C.; Morais, C.; Carolino, E.; Mendes, L.; Vieira, J.R.; Fonseca, J. Handgrip Dynamometry and Patient-Generated Subjective Global Assessment in Patients with Nonresectable Lung Cancer. Nutr. Cancer 2017, 69, 154–158, https://doi.org/10.1080/01635581.2017.1250923.
- López-Bueno, R.; Andersen, L.L.; Koyanagi, A.; Núñez-Cortés, R.; Calatayud, J.; Casaña, J.; Cruz, B.D.P. Thresholds of handgrip strength for all-cause, cancer, and cardiovascular mortality: A systematic review with dose-response meta-analysis. Ageing Res. Rev. 2022, 82, 101778, 10.1016/j.arr.2022.101778.
- Cereda, E.; Turri, A.; Klersy, C.; Cappello, S.; Ferrari, A.; Filippi, A.R.; Brugnatelli, S.; Caraccia, M.; Chiellino, S.; Borioli, V.; et al.et al. Whey Protein Isolate Supplementation Improves Body Composition, Muscle Strength, and Treatment Tolerance in Malnourished Advanced Cancer Patients Undergoing Chemotherapy. . Cancer Med. 2019, 8, 6923–6932, https://doi.org/10.1002/cam4.2517.
- Cereda, E.; Cappello, S.; Colombo, S.; Klersy, C.; Imarisio, I.; Turri, A.; Caraccia, M.; Borioli, V.; Monaco, T.; Benazzo, M.; et al.et al. Nutritional Counseling with or without Systematic Use of Oral Nutritional Supplements in Head and Neck Cancer Patients Undergoing Radiotherapy. Radiother. Oncol. 2018, 126, 81-88, https://doi.org/10.1016/j.radonc.2017.10.015.
- Thambamroong, T.; Seetalarom, K.; Saichaemchan, S.; Pumsutas, Y.; Prasongsook, N. Efficacy of Curcumin on Treating Cancer Anorexia-Cachexia Syndrome in Locally or Advanced Head and Neck Cancer: A Double-Blind, Placebo-Controlled Randomised Phase IIa Trial (CurChexia). J. Nutr. Metab. 2022, 2022, 5425619, https://doi.org/10.1155/2022/5425619.
- Norman, K.; Stübler, D.; Baier, P.; Schütz, T.; Ocran, K.; Holm, E.; Lochs, H.; Pirlich, M. Effects of Creatine Supplementation on Nutritional Status, Muscle Function and Quality of Life in Patients with Colorectal Cancer--a Double Blind Randomised Controlled Trial. Clin. Nutr. 2006, 25, 596–605, https://doi.org/10.1016/j.clnu.2006.01.014.
- dos Santos Cruz, B.C.; de Carvalho, T.C.; Saraiva, D.D.; dos Santos, A.; dos Reis, P.F. Efeito Do Suplemento Nutricional Enriquecido Com Ácido Eicosapentaenoico Na Massa Magra de Indivíduos Com Câncer de Cavidade Oral Em Pré-Tratamento Oncológico: Um Ensaio Clínico. Rev. Bras. De Cancerol. 2021, 67, e-05868, https://doi.org/10.32635/2176-9745.RBC.2021v67n1.868.
- Faccio, A.A.; de Sampaio Mattos, C.H.P.; dos Santos, E.A.S.; Neto, N.R.M.; Moreira, R.P.; Batella, L.T.; Dos Santos, H.; Celes, A.P.M. Oral Nutritional Supplementation in Cancer Patients Who Were Receiving Chemo/Chemoradiation Therapy: A Multicenter, Randomized Phase II Study. Nutr. Cancer 2021, 73, 442–449, https://doi.org/10.1080/01635581.2020.1758170.
- De Souza, A.P.S.; da Silva, L.C.; Fayh, A.P.T. Nutritional Intervention Contributes to the Improvement of Symptoms Related to Quality of Life in Breast Cancer Patients Undergoing Neoadjuvant Chemotherapy: A Randomized Clinical Trial. Nutrients 2021, 13, 589, https://doi.org/10.3390/nu13020589.
- Uster, A.; Ruefenacht, U.; Ruehlin, M.; Pless, M.; Siano, M.; Haefner, M.; Imoberdorf, R.; Ballmer, P.E. Influence of a Nutritional Intervention on Dietary Intake and Quality of Life in Cancer Patients: A Randomized Controlled Trial. Nutrition 2013, 29, 1342–1349, https://doi.org/10.1016/j.nut.2013.05.004.
More
