Your browser does not fully support modern features. Please upgrade for a smoother experience.
Please note this is a comparison between Version 2 by Jason Zhu and Version 3 by Chiemela Victor Amaechi.
Environmental valuation (EV) research has advanced significantly as a method of assigning value to environmental goods, many of which lack readily discernible market values. The term “environmental valuation” describes a number of methods for putting monetary values on environmental effects, particularly non-market effects. There has been a continuous increase in the number of publications on the topic. According to searches via the Scopus and Web of Science (WoS) databases, the phrase “environmental valuation” first occurred in 1987.
- environmental valuation
- ecosystem valuation
- total economic value
1. Introduction
Research into environmental valuation (EV) has come a long way as a means of attributing value to benefits and services of non-market environmental goods, whereby many of which have no easily observed market prices [1]. A dimension to the development in the valuation method was brought about by the global consciousness of the natural environment and the need to incorporate sustainability features into valuation practice. Environmental valuation estimates in monetary terms the rather overlooked aspect of ecosystem contributions to human wellbeing and development. As a result of increased demand for sustainable development and improved resources, environmental issues now take greater prominence in decision-making. Economists have developed an array of techniques and methods for providing economic values in the environment [2]. The awareness of these techniques has revolutionised the practice of valuation. Some of the literature around environmental valuation also discusses aspects of economic valuation. One of the key areas that can be considered in environmental valuation is the market impact, financial considerations and the willingness to pay [3][4][5][6][7].
Another aspect of evaluation has been used in sustainability studies through scientometric analysis of green infrastructure [8]. In the mining, oil and gas industries, environmental valuation has also found great use in project appraisals [9]. In principle, environmental economics and the valuation of natural resources, as analytical tools, facilitate environmental accounting by which the adverse effects of environmental impacts can be tracked in real terms [10]. Environmental valuation studies have been investigated as far back as by various researchers in the late 80s and early 90s, such as Climis A. Davos [11][12]. Their studies investigated air quality as a key consideration in spatial designs. Although environmental valuation techniques have been in the academic discourse over three decades, their relevance and application are not without criticism [13]. Consequently, the process of applying valuation methods has gone through refinement, making it acceptable among many. One area of environmental valuation is environmental assessments, and the metrics for green technologies, innovative technologies and green knowledge management have been presented by some authors [14][15][16][17]. However, there are some gaps in environmental valuation in relation to sustainability, decisions made, innovative knowledge in this field and validation, which should be considered. Some reflection on the use of technology in environmental valuation has improved over the years, which implies that the data trend for the future will be influenced by some key determinants. A revision of the journey so far is therefore germane to the strategic future of environmental valuation research. Liu et al. [18] conducted a scientometric investigation of the environmental impact of cover crops to understand the research trends, while Wang et al. [19] conducted a systematic literature review of the water shed ecosystem based on economic value. Related scientometric work on this subject includes the recent study by Guijarro and Tsinaslanidis [20] whereby the study was limited in scope as the literature search was based on articles retrieved from the Web of Science database only. On the other hand, an earlier scientometric study by Adamowicz [21] considered the use of environmental valuation in policy analysis in academic publications; however, as this was almost two decades ago, and covered publications up to 2004, there is a need for more recent studies.
2. Trends of Publication on Environmental Valuation Research
Although the search was left to any publications on environmental valuation research work from 1987 to 2021, this resulted in that seen in Figure 1. From the search of the Scopus database, the phrase “environmental valuation” first occurred in 1987. In that year, the earliest journal articles were found to be two in number and published by Davos [22] and Ellis and Fisher [23], both appearing in the same volume of the Journal of Environment. These articles advocate using environmental valuation in hazardous waste as an input for producing marketed goods. There appeared to be no other publication records for the next three years after these publications. At the turn of 1991, two additional publications by Huang and Odum [24] and Winpenny [25] were published. These studies focused on ecology and economy, and the relationship between environmental values and development.
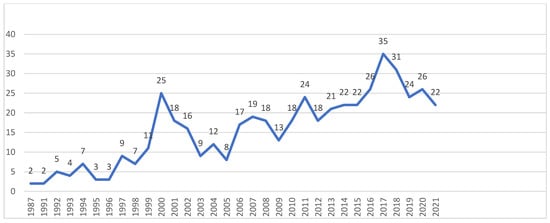
Figure 1. Trends of environmental valuation publications between 1987 and 2021.
From 1991 onwards, there has been consistency in the spread of knowledge on environmental valuation because there is no particular year without any publication on this subject. However, the years 2000, 2007, 2011 and 2017 appear to be significant in the research output in that there were 25, 19, 24 and 35 publications, respectively. It is noticeable that there is a rise and fall trend in the spread right from 1991 to 2021.
3. Distribution in Altmetric Attention Scores
The distribution in the Altmetric attention scores was found using the Altmetric Explorer. This was achieved by exploring data for all of the research outputs from the entire Altmetric database with the title and keywords containing “Environmental Valuation”. The distribution in the altmetric attention scores can be seen in Figure 2. The figure shows the highest number of research outputs with publications of about 110 outputs. The highest bar had one hundred and forty-seven research outputs with an altmetric attention score of 1–10, followed by thirteen research outputs with an altmetric attention score of 11–20, followed by four research outputs with an altmetric attention score of 21–30, followed by two research outputs with an altmetric attention score of 31–40, followed by one research output with an altmetric attention score of 41–50.
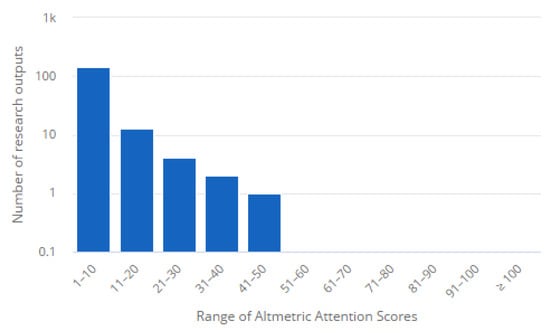
Figure 2. Distribution in altmetric attention scores related to environmental valuation research.
4. Attention Scores Related to Environmental Valuation
The top mentions from the Altmetric Explorer were analysed using attention scores related to “Environmental Valuation”. The top publication on the attention scores for environmental valuation was by Sawe and Knutson [26] published in NeuroImage, and it had the highest altmetric attention score of 50, being in the top 5% of all research outputs scored (see Figure 3). It has a high attention score compared to outputs of the same age (96th percentile), and a high attention score compared to outputs of the same age according to years of publications and source (97th percentile). Figure 3a shows that the term was mentioned by two news outlets, four blogs and nine tweets. The second highest publication was by Khaw et al. [27], published in PLoS ONE, currently a Q1 journal as found on Scimago. This publication had an altmetric attention score of thirty-two, being in the top 5% of all research outputs scored using altmetrics (see Figure 3b). It also has a high attention score compared to works of the same age (94th percentile), and a high attention score compared to outputs of the same age according to years of publication and source (93rd percentile). As seen in Figure 3b, the term was mentioned by one news outlet, two blogs, two Wikipedia pages and ten tweets. The third highest publication was by Fabre et al. [28], which was published in Science of the Total Environment, also a Q1 journal on Scimago. The publication also had an altmetric attention score of thirty-one, being in the top 5% of all research outputs scored using altmetrics (see Figure 3c). It also has a high attention score compared to outputs of the same age (92nd percentile), and a high attention score compared to outputs of the same age according to years of publication and source (96th percentile). The donut in Figure 3c shows that the term was mentioned by four news outlets and one Facebook page. Petr et al. [29] published the fourth highest publication, published by Springer Publishing. The publication also had an altmetric attention score of thirty, being in the top 5% of all research outputs scored using altmetrics (see Figure 3d). It also has a high attention score compared to outputs of the same age (92nd percentile), and a high attention score compared to outputs of the same age according to years of publication and source (96th percentile). This shows the impact of the attention score for understanding the research trend and impact of publications in this field.
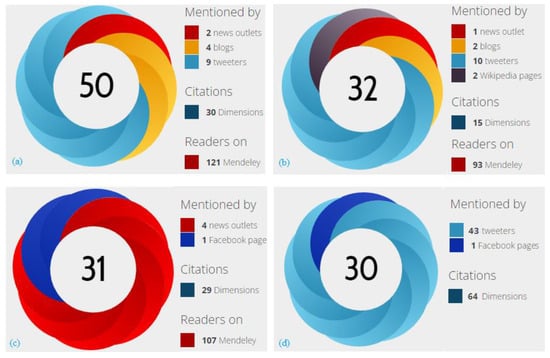
Figure 3. (a–d) Publication donuts showing the altmetric scores based on mentions, citations and readers for top 4 publications on environmental valuation.
5. Analysis of Top Mentions Related to Environmental Valuation from Altmetric
The top mentions related to environmental valuation from Altmetric were analysed using three main components, namely top affiliations, top journals and collections and top subject areas in “Environmental Valuation”. The University of Leeds had the highest number of mentions of ninety-four (15%), with three outputs, followed by Lancaster University with sixty mentions (11%), with three outputs, followed by the University of the Basque Country having 61 mentions (10%), with four outputs. Based on the top subject areas, Economics had the highest number of mentions of three hundred and fifty-six (59%), with ninety outputs, followed by Applied Economics having three hundred and forty-three mentions (57%), with ninety-five outputs, and Environmental Sciences having eighty-two mentions (13%), with thirty-four outputs. Based on the top journals and collections, Ecological Economics had sixty-five mentions (10%), with twenty-three outputs, followed by People and Nature having forty-eight mentions (8%), with two outputs, and Environmental and Resource Economics having thirty-five mentions (5%), with nine outputs.
6. Altmetric Analysis of Journals and Other Collections on Environmental Valuation
The first investigation was to check the sources of the documents in journals and other collections and the results are detailed. It was observed that there were eighty journals and other collections from the Altmetric Explorer having explored data for all research outputs from the Altmetric database using title and keywords containing the term “Environmental Valuation”. It was observed that Ecological Economics had the highest mentions with twenty-three outputs, having 10% of the data, and sixty-five mentions, including thirty-three Twitter mentions, fifteen policy mentions, nine Facebook mentions, five Wikipedia mentions and two blog mentions. This was followed by People and Nature, with two outputs having 8% of the data and forty-eight Twitter mentions. This was followed by Environmental and Resource Economics with nine outputs having 5% of the data and 35 mentions, including nineteen policy mentions, fifteen Twitter mentions and one Wikipedia mention. The Australian Journal of Agricultural and Resource Economics followed it with fifteen mentions, including seven Twitter mentions, three blog mentions, three policy mentions and two Facebook mentions. Sustainability followed it with thirteen mentions, including eleven Twitter mentions, one Facebook mention and one policy mention. This was followed by Journal of Environmental Management with ten mentions, including seven Twitter mentions, one news mention, one policy mention and one Wikipedia mention. Science of the Total Environment followed it with ten mentions, including one Twitter mention, two news mentions, two policy mentions and three Facebook mentions.
7. Document per Source
Using Scopus, it was found that one hundred and fifty-eight journals have published research into environmental valuation. Out of this number, 99 (62.69%) have contributed just one article, 22 (13.92%) have contributed two articles and 11 (6.96%) have contributed only three articles. All of these were excluded from further analysis of document sources because of their low number of contributions.
Figure 4 shows the document sources with at least four publications in this area. Most article contributions are from Ecological Economics with 88 (55.70%) being a single source, occupying first position. This journal was one of the earliest contributors to the subject.
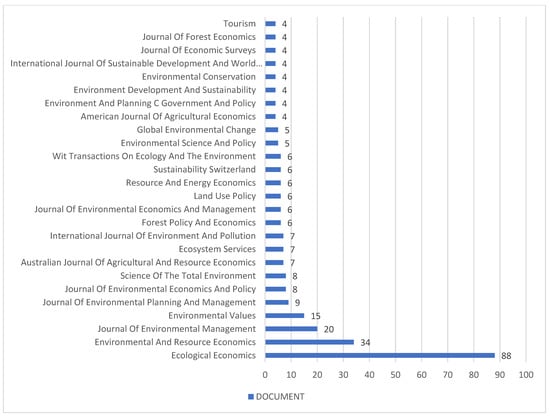
Figure 4. Document per year by source.
In terms of the citations and strength of journal publications on environmental valuation research, the second in rank is Environmental and Resource Economics journal with 34 (21.52%) articles, followed by the Journal of Environmental Management with 20 (12.67%) articles and ranked third in position. Fourth in rank is the Environmental Values journal with 15 (9.49%) articles.
8. Authors’ Contributions to Environmental Valuation Research
Table 4 shows the research output per author, thus revealing the most productive researchers in environmental valuation. The table shows the number of articles contributed by each author, the number of times cited and their total link strength. The document search excluded authors with less than four publications, and only twenty-eight met this threshold. Hanley has thirteen articles with a total of one thousand four hundred and forty-eight citations. Hanley has the highest number of published articles and the highest number of citation records and so ranks first in both. The second resourceful author in terms of the number of published articles is Mariel, with eleven papers and one hundred and ninety-six citations. Although Adamowicz, Louviere, Swait and Welsch have four articles each to credit them, their citation records are one thousand two hundred and eighty-five, eight hundred and eighty-one, eight hundred and eleven and seven hundred and twenty-nine, thereby ranking second, third, fourth and fifth, respectively. The earliest contribution of Adamovicz was in the year 1996 [30]. Despite this, the rate of citation of the author’s work is high compared to the earlier authors who have contributed to the subject of environmental valuation since 1987. The understanding of the authorship and citations in this field help readers to understand the impact and trend of the research, which also show that there is increasing research interest into environmental valuation.
9. Distribution in the Demographics for Mentions Using Altmetrics
Although the publication trend from the search for environmental valuation research work was conducted, the distribution in the demographics showed that the highest mentions were from Twitter. As seen in Figure 5, there were 380 tweets about this content by 311 unique tweeters in 34 countries. However, there were also twenty-eight Facebook posts about this content on nineteen unique Facebook pages in nine countries, ten news stories about this content by nine unique news outlets in five countries and one hundred and fifteen policy documents about this content by twenty-eight unique policy sources in fourteen countries (see Figure 5). The United Kingdom had the highest mentions from the Altmetric Explorer, with 62 tweets and 52 unique profiles. It was followed by the United States of America with 56 tweets and 38 unique tweeters. This was followed by Spain with 15 tweets and 15 unique tweeters. This was followed by Germany with 14 tweets and 13 unique tweeters. This was followed by Australia with 9 tweets and 9 unique tweeters. This was followed by Colombia and France, as each had 8 tweets and 7 unique tweeters. These were followed by Canada, with 7 tweets and 7 unique tweeters.
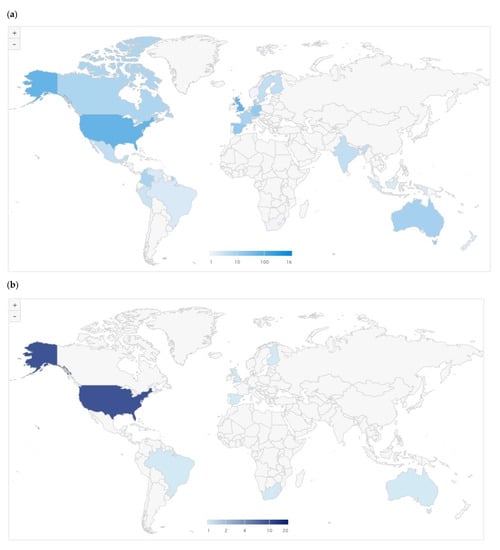
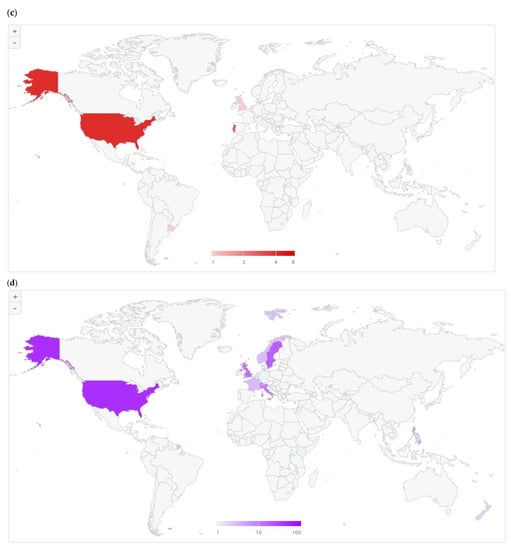
Figure 5. Demographics of environmental valuation research from the Altmetric Explorer: (a) Twitter, (b) Facebook, (c) news stories, (d) policy.
10. Countries’ Contributions to Environmental Valuation Research
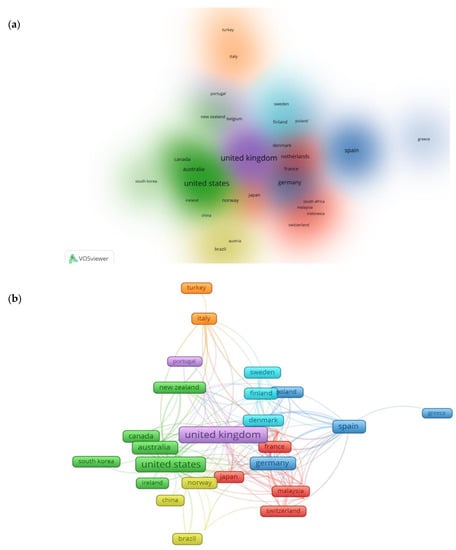
The search criteria for countries’ contributions to environmental valuation research were set at a minimum of five documents and a minimum citation of five. To this end, 30 out of 72 countries fulfilled these criteria and the United Kingdom with 113 documents and 5772 citations topped the list (see Figure 6). The United Kingdom, the United States, Spain, Germany, Australia, the Netherlands, Canada, Norway, France and Brazil were the top 10 countries with 113, 98, 48, 42, 38, 33, 22, 21, 20 and 19, respectively. However, Canada ranked seventh in terms of the number of documents (22), having an average citation record that stood at 125 which is more than twice higher than that of the United Kingdom which had the highest document contribution. In the African continent, only South Africa significantly featured, having seven document contributions with 83 total citations. This implies that there has not been significant investigations in developing countries with regard to their contribution to environmental-valuation-related research, as earlier expressed by Navrud [31] and Wangai et al. [32]. The network mapping of the countries’ collaborations on environmental valuation research determines countries’ levels of productivity on a line of research as well as the promotion of research funding [33].
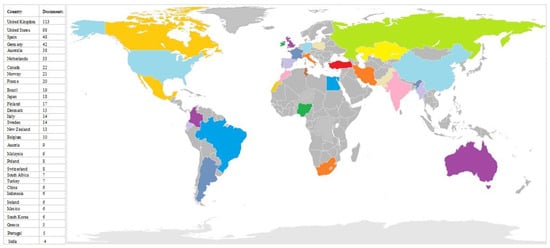 Figure 7a,b shows clusters of countries in terms of co-authorship. Cluster 1, which is depicted in magenta red-coloured profiles, has France, Indonesia, Japan, Malaysia, Mexico, the Netherlands and South Africa. Cluster 2, which is depicted in green-coloured profiles, comprises Austria, Canada, Ireland, New Zealand, South Korea and the United States of America (USA). In Cluster 3, which is depicted in sky blue-coloured profiles, there are Germany, Greece, Poland and Spain. The fourth cluster – Cluster 4 which is depicted in yellow-coloured profiles, incorporates Austria, Brazil, China and Norway. Cluster 5, which is depicted in purple-coloured profiles, has Belgium, Portugal and the United Kingdom (UK). Denmark, Finland and Sweden form Cluster 6, which is depicted in cyan-coloured profiles. Lastly, Cluster 7, which is depicted in dark orange-coloured profiles, comprises Italy and Turkey. It is noteworthy to add that network mapping is useful in identifying the key factors that influence trends in research. It can also be used to determine countries’ levels of productivity on a line of research as well as the promotion of research funding [33]. The size of the nodes represents the extent of each country’s contribution to EV research; consequently, the United Kingdom stands out, followed by the United States. The network lines show the co-citation links between the countries and the thickness of the lines indicate their affinity and strength of association. The network lines can be visualized to present the relationship of the country records and co-citations using the density mapping (as in Figure 7a) and the mapped network (as in Figure 7b). Both visualizations reflect the highest amount of citations on environmental valuation were obtained from the UK, followed by USA, which correlated with the findings in Figure 6.
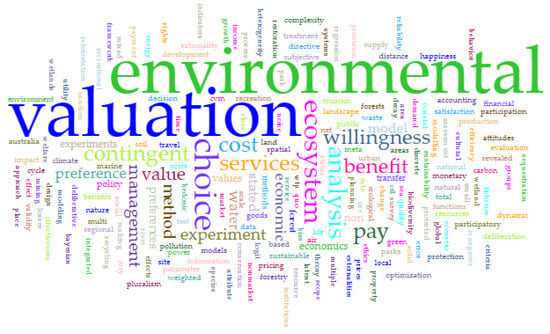
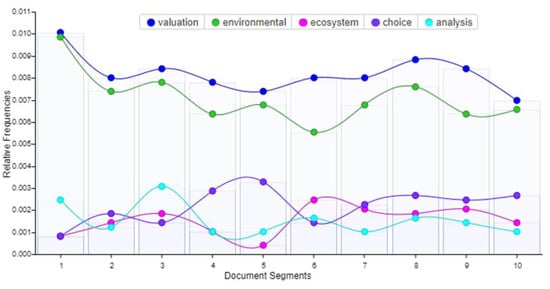
 Further analysis of the keywords was conducted using Voyant Tools to develop the word cloud in Figure 9. It was developed using the corpus from one keyword document with 4872 total words and 1235 unique word forms. From the keyword data, the vocabulary density was 0.253, the readability index was 32.740 and the average words per sentence were 2436.0. The most frequent words in the corpus were valuation (399), environmental (346), choice (106), analysis (76) and ecosystem (75). The trend of the keywords related to environmental valuation shows that the highest two keywords which were “valuation” and “environmental” had high statistical dispersion from the other top three keywords—choice, analysis and ecosystem—as seen in Figure 10. This graph shows the relative frequencies of the keywords, and their dispersion.
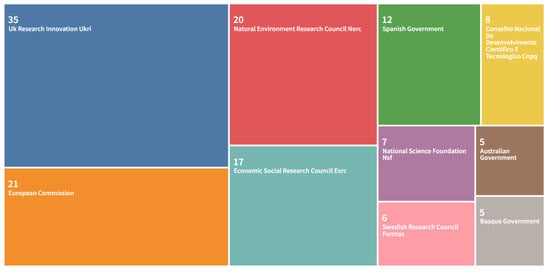
 This was followed by the European Commission with 21 publication outputs, then Natural Environment Research Council (NERC) with 20 publication outputs, followed by Economic Social Research Council (ESRC) with 17 publication outputs, among others, as shown in the visualisation map in Figure 13. It shows different funders across different countries in this area. This gives an overview on the funding support that has been identified in EV research. This improves the comprehension of the key contributions of different technologies on environmental valuation from various sectors. It also shows that there are great impacts of legacy products, industry techniques and decisions that are made based on the availability of research funding in this area. Thus, the access to industry databases is necessary for making valuable choices and key decisions. Decisions must take into account enough scientific knowledge to predict the effects on the environment and society with a manageable level of uncertainty. In general, a persistent obstacle to data sharing can be a lack of trust amongst different stakeholders involved in the project. Building confidence and fostering working relationships, thus increasing human capital (or connections), can lead to the creation of dependable and beneficial data sharing agreements, so long as long-term communication is maintained through collaborations. These funders, as seen in Figure 13, encourage collaborations between industry and academia, which also improves the access to key findings and pertinent information.
 Multi-stakeholder collaboration can offer the chance to produce open-source datasets in order to increase data transparency. Data gathering is a regular process that yields valuable information on environmental studies, but it is still difficult for outside parties and scientists to obtain environmental and contaminant data. This analysis shows that there is a lack of data openness with regard to the measures for environmental valuation connected to various infrastructures. A typical application in the energy sector is the environmental valuation of offshore oil and gas facilities during decommissioning [37][38][39][40]. Working together on different aspects of environmental valuation, such as marine engineering or ecological research, could present another way to inform stakeholders about new findings in the industry, such as marine growth on offshore platforms, the state of decommissioned platforms or how marine species interact with infrastructure. Collaboration between science and industry will solidify the bond between the two sectors and highlight the significance of environmental protection and risk assessment, spreading awareness of environmental science, and its significance will help the world’s knowledge grow regarding the potential consequences of contaminants on environmental valuation processes.
Figure 6. Map showing countries and citation records for environmental valuation publications. (Colours used only help to visualise and do not depict figures.).
Figure 7. Most productive countries in environmental valuation research developed using VOSviewer, showing (a) the density visualization and (b) mapped network visualization.
11. Analysis of Major Keywords in Environmental Valuation Research
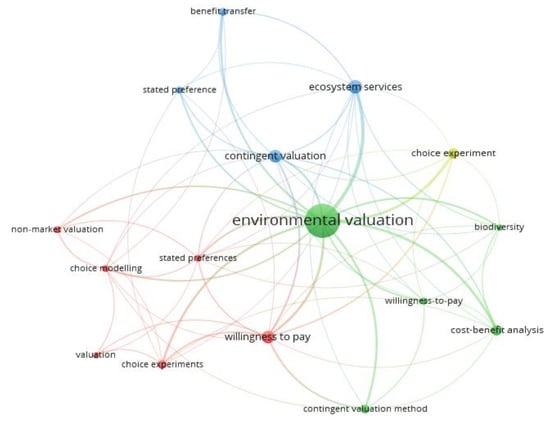
Keywords are pointers to the emerging areas of studies based on the research themes. The themes were developed by evaluating the 497 articles, as well as the bibliometric data’s keyword checklists harvested from the Scopus database. The analysis of co-occurrence using author keywords and setting the minimum number of occurrences of a keyword to 10 was undertaken. Of the 1330 keywords, 16 met the threshold. However, a cursory look at the outcome showed that some keywords overlapped, and as such they were merged. For example, “willingness to pay” and ‘willingness-to-pay”, “contingent valuation” and “contingent valuation method”, “choice experiment” and “choice experiments”, “stated preference” and “stated experiments”. As expected, the results show that “environmental valuation” had the highest occurrence (255 times) in the four hundred and ninety-seven documents extracted with a total link strength of one hundred and fifty-two, indicating its level of involvement in the co-occurrence map. Second in rank is “contingent valuation”, with fifty-four occurrences and a total link strength of 158. This is equally not unexpected as the contingent valuation method has been described as being the most popular method of environmental valuation. It is the most popular method in a family of alternative stated preference techniques [34][35][36]. “Willingness to pay” has 46 occurrences with a total link strength of 59, thus occupying the third position. This keyword is associated with the contingent valuation method, being an approach adopted in engaging the method. Figure 8 displays the visual map of authors’ keywords co-occurrence networks with four clusters. From the visualisation map, it can be observed that Cluster 1 comprises keywords of choice experiment, choice modelling, non-market valuation, stated preferences, valuation and willingness to pay. Cluster 2 comprises biodiversity, contingent valuation method, cost benefit analysis, environmental valuation and willingness to pay. Cluster 3 comprises benefit transfer, contingent valuation, ecosystem services and stated preference, while Cluster 4 comprises only one keyword: choice experiment.Figure 8. Keyword co-occurrence network visualisation map.
Figure 9. The word cloud of the author keywords related to environmental valuation using Voyant Tools.
Figure 10. The trend and relative frequencies plot for the top five keywords related to the research on environmental valuation, namely: valuation, environmental, ecosystem, choice and analysis, as obtained using Voyant Tools.
12. Analysis of Publication Types in Environmental Valuation Research
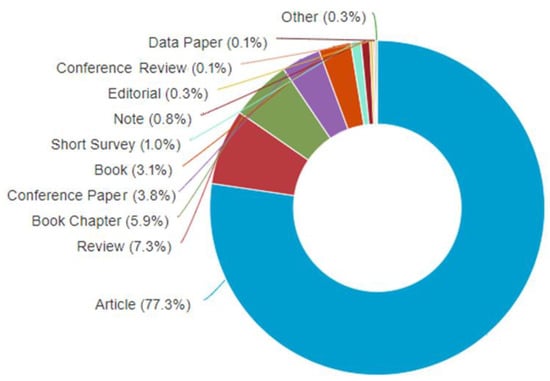
Another aspect of the study conducted was the analysis of publication types in environmental valuation research. Figure 11 shows that it was observed from Scopus data on “Environmental Valuation” that research articles were the highest (77.3%), which made up 549 out of 710 publications. This was followed by reviews with 52 publications (7.3%), followed by book chapters with 42 publications (5.9%), followed by conference papers with 27 publications (3.8%), followed by books with 22 publications (3.1%), followed by short surveys with 7 publications (1.0%), followed by notes with 6 publications (0.8%) and then followed by editorials with 2 publications (0.3%). The last set were conference reviews, reports and data papers, each having one publication (0.1%). This shows that there are different ways available to access information on environmental valuation research. It also shows that the publication documents are mostly journal articles (77.3%), which were over three quarters of the publication documents. This further reflects the high research in this field, with the publications also seen to have high impact in this area.Figure 11. The pie chart for the research on environmental valuation.
13. Analysis of Publications by Subject Area in Environmental Valuation Research
An analysis of the publications by subject area in environmental valuation research was also conducted. As seen in Table 6, it was observed from Scopus data on “Environmental Valuation” that Environmental Science was the highest (66.62%), with 473 out of 710 publications. This was followed by Economics, Econometrics and Finance with 282 publications (39.72%), followed by Social Sciences with 203 publications (28.59%), followed by Agricultural and Biological Sciences with 129 publications (18.17%), followed by Business, Management and Accounting with 61 publications (8.59%), followed by Engineering with 49 publications (6.90%), followed by Earth and Planetary Sciences with 36 publications (5.07%), followed by Arts and Humanities with 33 publications (4.65%), followed by Energy with 29 publications (4.08%), followed by Decision Sciences with 15 publications (2.11%), followed by Mathematics with 14 publications (1.97%).14. Collaboration on Environmental Valuation Research between Industry and Academia
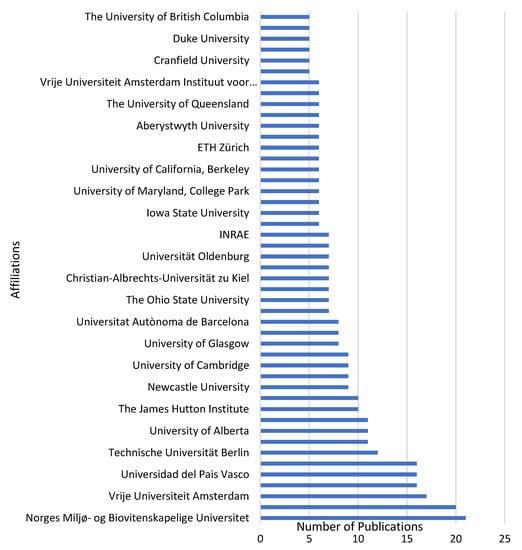
There is a need to understand the impact of funders and affiliations in this sector. One important finding of the research in this area is the funding support and collaboration of both industry and academia. An analysis of publication affiliations on environmental valuation research was also conducted. As seen in Figure 12, it was observed from Scopus data on “Environmental Valuation” that Norges Miljø og Biovitenskapelige Universitet was the highest with 21 publications. This was followed by the University of East Anglia which had 20 publications, followed by Vrije Universiteit Amsterdam which had 17 publications. The next set of affiliations were the University of Leeds, Universidad del Pais Vasco and Københavns Universitet which had 16 publications each. The rest of the affiliations in this field are shown in Figure 12.Figure 12. The top affiliations for the research on environmental valuation (data retrieved from Scopus database on 22 October 2022).
Figure 13. The visualisation tree map of the top 10 funders for the research on environmental valuation (data retrieved from WoS database on 22 October 2022).
References
- Dixon, J.A. Environmental Valuation: Challenges and Practices. In Proceedings of the Economics and Conservation in the Tropics: A Strategic Dialogue, Washington DC, USA, 31 January–1 February 2008; Available online: https://www.conservation-strategy.org/sites/default/files/field-file/Tropics_Conference_Dixon_Environmenal_Valuation.pdf (accessed on 6 March 2023).
- Gong, M.; Aadland, D. Interview Effects in an Environmental Valuation Telephone Survey. Environ. Resour. Econ. 2010, 49, 47–64.
- Balana, B.B.; Catacutan, D.; Mäkelä, M. Assessing the willingness to pay for reliable domestic water supply via catchment management: Results from a contingent valuation survey in Nairobi City, Kenya. J. Environ. Plan. Manag. 2013, 56, 1511–1531.
- Ben Brahim-Neji, H.; Del Saz-Salazar, S.; Besrour, A.; González-Gómez, F. Estimating willingness to pay for desalinated seawater: The case of Djerba Island, Tunisia. Int. J. Water Resour. Dev. 2017, 35, 126–144.
- Tesoriere, G.; Scuderi, R. Willingness to pay for water in secondary cities: Do poverty and negative experiences matter? Dev. Pract. 2022, 1–12.
- Ali, M.A.S.; Khan, S.U.; Khan, A.; Khan, A.A.; Zhao, M. Ranking of ecosystem services on the basis of willingness to pay: Monetary assessment of a subset of ecosystem services in the Heihe River basin. Sci. Total Environ. 2022, 734, 139447.
- Streimikiene, D.; Balezentis, T.; Alisauskaite-Seskiene, I.; Stankuniene, G.; Simanaviciene, Z. A Review of Willingness to Pay Studies for Climate Change Mitigation in the Energy Sector. Energies 2019, 12, 1481.
- Retno, D.P.; Wibowo, M.A.; Hatmoko, J.U.D. The Scientometric Approach of Mapping Sustainable Green Infrastructure Research Developments. J. Phys. Conf. Ser. 2020, 1625, 1625.
- Damigos, D. An overview of environmental valuation methods for the mining industry. J. Clean. Prod. 2006, 14, 234–247.
- Munasinghe, P.C. Environmental Economics and Valuation in Development Decision Making; Environment Working Paper No. 51; The World Bank: Washington, DC, USA, 1992; Available online: https://documents1.worldbank.org/curated/en/478921493259967070/pdf/Environmental-economics-and-valuation-in-development-decision-making.pdf (accessed on 6 March 2023).
- Davos, C.A.; Thistlewaite, W.; Clark, C.A.; Sinsheimer, P.J. Public priorities for evaluating air quality management measures. J. Environ. Manag. 1991, 33, 205–221.
- Davos, C.A.; Thistlewaite, W.A.; Paik, E.C. Air Quality Management: Participatory Ranking of Control Measures and Conflict Analysis. J. Environ. Manag. 1993, 37, 301–311.
- Navrud, S.; Pruckner, G.J. Environmental Valuation—To Use or Not to Use? A Comparative Study of the United States and Europe. Environ. Resour. Econ. 1997, 10, 1–26.
- Lian, G.; Xu, A.; Zhu, Y. Substantive green innovation or symbolic green innovation? The impact of ER on enterprise green innovation based on the dual moderating effects. J. Innov. Knowl. 2022, 7, 100203.
- Wang, S.; Abbas, J.; Sial, M.S.; Álvarez-Otero, S.; Cioca, L.-I. Achieving green innovation and sustainable development goals through green knowledge management: Moderating role of organizational green culture. J. Innov. Knowl. 2022, 7, 100272.
- Wang, S.; Li, J.; Du, P.; Zhao, E. A game theoretic technique for risk-based optimal bidding strategies in energy aggregators of markets: Knowledge management approach. J. Innov. Knowl. 2022, 7, 100279.
- Yu, S.; Abbas, J.; Álvarez-Otero, S.; Cherian, J. Green knowledge management: Scale development and validation. J. Innov. Knowl. 2022, 7, 100244.
- Liu, Y.; Ruiz-Menjivar, J.; Hu, Y.; Zavala, M.; Swisher, M.E. Knowledge Mapping of the Extant Literature on the Environmental Impacts of Using Cover Crops—A Scientometric Study. Environments 2022, 9, 120.
- Wang, H.; Meijerink, S.; Van Der Krabben, E. Institutional Design and Performance of Markets for Watershed Ecosystem Services: A Systematic Literature Review. Sustainability 2020, 12, 6382.
- Guijarro, F.; Tsinaslanidis, P. Analysis of Academic Literature on Environmental Valuation. Int. J. Environ. Res. Public Health 2020, 17, 2386.
- Adamowicz, W.L. What’s it worth? An examination of historical trends and future directions in environmental valuation. Aust. J. Agric. Resour. Econ. 2004, 48, 419–443.
- Davos, C.A. Group Environmental Valuation: Suitability of Single Interest Approaches. J. Environ. Manag. 1987, 5, 97–111.
- Ellis, G.M.; Fisher, A.C. Valuing the environment as input. J. Environ. Manag. 1987, 25, 149–156.
- Huang, S.-L.; Odum, H.T. Ecology and economy: Emergy synthesis and public policy in Taiwan. J. Environ. Manag. 1991, 32, 313–333.
- Heady, C. Values for the environment: A guide to economic appraisal. Long Range Plan. 1992, 25, 129.
- Sawe, N.; Knutson, B. Neural valuation of environmental resources. NeuroImage 2015, 122, 87–95.
- haw, M.W.; Grab, D.A.; Livermore, M.A.; Vossler, C.A.; Glimcher, P.W. The Measurement of Subjective Value and Its Relation to Contingent Valuation and Environmental Public Goods. PLoS ONE 2015, 10, e0132842.
- Fabre, E.; Lopes, C.B.; Vale, C.; Pereira, E.; Silva, C.M. Valuation of banana peels as an effective biosorbent for mercury removal under low environmental concentrations. Sci. Total Environ. 2019, 709, 135883.
- Mariel, P.; Hoyos, D.; Meyerhoff, J.; Czajkowski, M.; Dekker, T.; Glenk, K.; Jacobsen, J.B.; Liebe, U.; Olsen, S.B.; Sagebiel, J.; et al. Environmental Valuation with Discrete Choice Experiments: Guidance on Design, Implementation and Data Analysis; Springer Nature: Berlin/Heidelberg, Germany, 2021; p. 129.
- Boxall, P.C.; Adamowicz, W.L.; Swait, J.; Williams, M.; Louviere, J. A comparison of stated preference methods for environmental valuation. Ecol. Econ. 1996, 18, 243–253.
- Navrud, S.; Mungatana, E. Environmental valuation in developing countries: The recreational value of wildlife viewing. Ecol. Econ. 1994, 11, 135–151.
- Wangai, P.W.; Burkhard, B.; Müller, F. A review of studies on ecosystem services in Africa. Int. J. Sustain. Built Environ. 2016, 5, 225–245.
- Tariq, S.; Hu, Z.; Zayed, T. Micro-electromechanical systems-based technologies for leak detection and localization in water supply networks: A bibliometric and systematic review. J. Clean. Prod. 2021, 289, 125751.
- Kritrom, B. Spike models in contingent valuation. Am. J. Agric. Econ. 1997, 79, 1013–1023.
- Lee, C.-Y.; Heo, H. Estimating willingness to pay for renewable energy in South Korea using the contingent valuation method. Energy Policy 2016, 94, 150–156.
- Noonan, D.S. Contingent Valuation and Cultural Resources: A Meta-Analytic Review of the Literature. J. Cult. Econ. 2003, 27, 159–176.
- Fam, M.; Konovessis, D.; Ong, L.; Tan, H. A review of offshore decommissioning regulations in five countries—Strengths and weaknesses. Ocean Eng. 2018, 160, 244–263.
- Claisse, J.T.; Ii, D.J.P.; Love, M.; Zahn, L.A.; Williams, C.M.; Bull, A.S. Impacts from Partial Removal of Decommissioned Oil and Gas Platforms on Fish Biomass and Production on the Remaining Platform Structure and Surrounding Shell Mounds. PLoS ONE 2015, 10, e0135812.
- Birchenough, S.N.R.; Degraer, S. Science in support of ecologically sound decommissioning strategies for offshore man-made structures: Taking stock of current knowledge and considering future challenges. ICES J. Mar. Sci. 2020, 77, 1075–1078.
- Murray, F.; Needham, K.; Gormley, K.; Rouse, S.; Coolen, J.W.; Billett, D.; Dannheim, J.; Birchenough, S.N.; Hyder, K.; Heard, R.; et al. Data challenges and opportunities for environmental management of North Sea oil and gas decommissioning in an era of blue growth. Mar. Policy 2018, 97, 130–138.
More