Cervical cancer is the fourth most common women’s cancer in the world, and unfortunately mainly affects younger women. Current methods for screening and diagnosis of cervical cancer and precancer are therefore limited, and there has been much interest in the use of optical spectroscopic approaches, such as Raman spectroscopy, to provide an objective test based on the biochemical fingerprint of the cervical cells or tissues. Raman spectroscopy is based on inelastic scattering, which has been used to study the biomolecular fingerprint of cells or tissues. It involves shining a laser on a sample and measuring the scattered photons. When a photon collides on a molecule, it either retains its energy (known as Rayleigh scattering) or exchanges energy with the molecule (known as Raman scattering).
- cancer screening
- human papillomavirus
- cervical cancer
- Raman spectroscopy
1. Introduction
1.1. Cervical
1.2. Cervical Cancer Screening and Diagnosis
1.3. Raman Spectroscopy
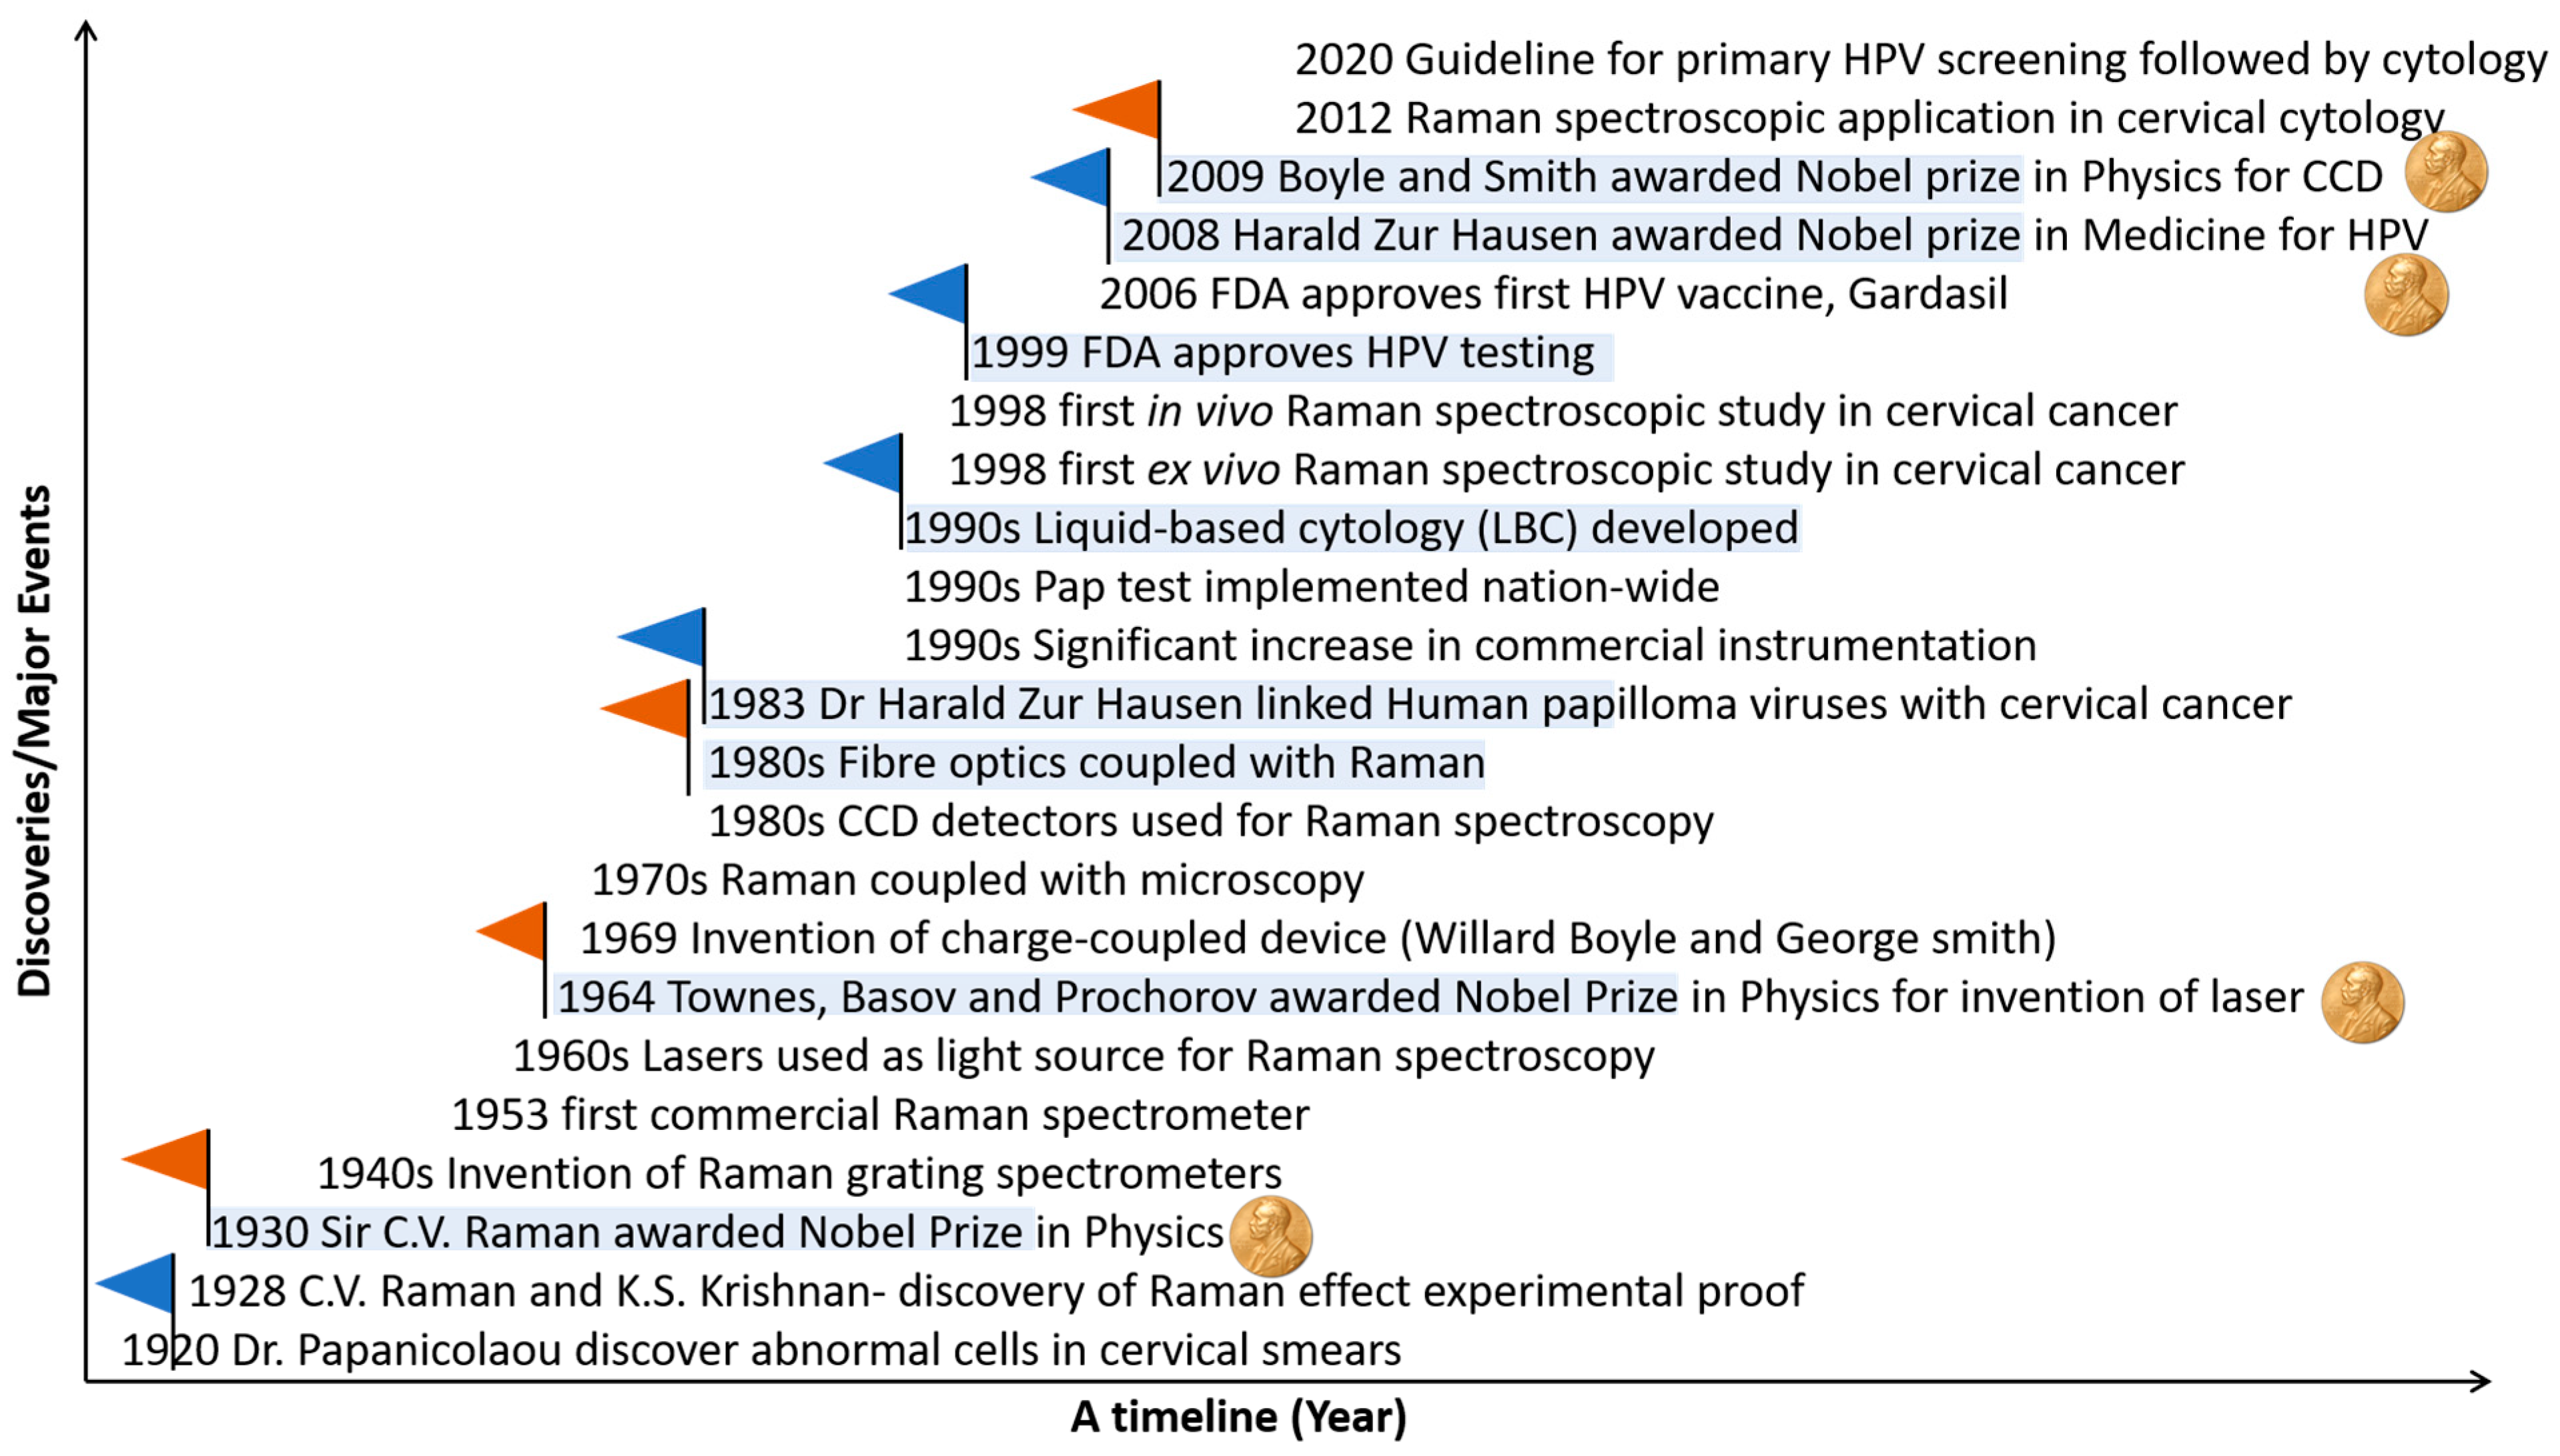
1.4. Evolution of Raman Spectroscopy and Its Application in Cervical Cancer
2. Cytology
Table 1 summarises the studies on applying Raman spectroscopy in cervical cytology.2.1. Cell Pellets
Vargis et al. [31][24] demonstrated that Raman spectroscopy could detect the presence of high-risk HPV in cytology samples. Spectral differences were observed in regions corresponding to lipid, amino acid, and deoxyribonucleic acid (DNA) content and CH stretching and bending regions assigned to proteins. HPV-positive and HPV-negative cytology samples were discriminated against with an accuracy of 98.5%. Rubina et al. [32][25] used Raman spectroscopy to discriminate between exfoliated cell pellets from patients with negative cytology and cervical cancer cytology. Classification efficiency of ~90% was achieved using principal component analysis-linear discriminant analysis (PCA-LDA) [33][26], but heme and fibrin bands from blood appeared to be major discriminating features. A subset of cell pellets was treated with red blood cell lysis buffer before Raman spectroscopy. Successful blood removal was confirmed by the absence of heme and fibrin bands. The main discriminating feature was increased protein content in the cervical cancer samples compared to the negative samples. A classification efficiency of ~80% was achieved using PCA-LDA. Misclassifications were attributed to sample heterogeneity and the predominance of normal cells in the cervical cancer samples. This work was extended by Hole et al. [34][27] to Raman analysis of cervical and oral exfoliated cell pellets. The main discriminating features were DNA and protein, and improved classification was achieved when mean spectra from each sample were used to overcome intra-sample heterogeneity (84% cervical and 86% oral cancer) compared to all spectra from each sample (77% cervical and 82% oral cancer).| Year | Authors (Research Group) | Sample/Patient Numbers | Sample Type/Sample Prep/Substrate | Raman Parameters | Data Analysis Methodology | Main Findings | Reference |
|---|---|---|---|---|---|---|---|
| 2012 | Vargis et al. (Mahadevan-Jansen group) | 50 patient samples—25 HPV negative and 25 HPV positive | Centrifugation and washing with sterile water Pellets of exfoliated cells on calcium fluoride slides |
Renishaw Invia Raman microscope 785 nm laser, ∼30 mW at the sample 50X/0.75 NA objective lens Spectral resolution ∼6 cm−1 45 to 60 s acquisition, 3 accumulations |
Sparse multinomial logistic regression (SMLR) | Discrimination of HPV-positive and HPV-negative cytology samples Spectral differences: lipid, amino acid, protein, and DNA content Accuracy: 98.5% |
[31][24] |
| 2013 | Rubina et al. (Krishna group) | 94 patient samples—45 negative cytology and 49 cervical cancer cytology | Centrifugation and washing with saline Pellets of exfoliated cells on calcium fluoride slides Red blood cell (RBC) lysis buffer treatment |
Horiba- Jobin-Yvon fibre-optic Raman microprobe system 785 nm laser ∼40 mW at the sample 40X/0.65 NA objective lens Spectral resolution ∼4 cm−1 6 s acquisition, 3 accumulations |
Principal Component Analysis Linear Discriminant Analysis (PCA-LDA) | Treatment of cell pellet with RBC lysis buffer to remove blood contamination Discrimination of negative and cancer cytology Spectral differences: protein Accuracy: 80% |
[32][25] |
| 2014 | Bonnier et al. (Lyng group) | 63 patient samples—50 negative cytology and 13 high-grade cytology | ThinPrep method Single exfoliated cells on ThinPrep glass slides Hydrogen peroxide pre-treatment |
Horiba- Jobin-Yvon XploRA Raman microscope 532 nm laser ∼8 mW at the sample 100X/0.9 NA objective lens Spectral resolution ∼3 cm−1 10 s acquisition, 3 accumulations |
PCA | Pre-treatment of ThinPrep slides with hydrogen peroxide to eliminate variability due to blood contamination Discrimination of negative and high-grade cytology Spectral differences: DNA, RNA |
[35][28] |
| 2016 | Ramos et al. (Lyng group) | 166 patient samples—88 negative cytology, 35 low-grade cytology, and 43 high-grade cytology | Sample preparation as for Bonnier et al. [28][29] | Raman set up as for Bonnier et al., 30 s acquisition, 2 accumulations | PCA-LDA | Discrimination of negative, low-grade, and high-grade cytology Spectral differences: lipids, nucleic acids, and proteins Sensitivity: 90.91–100% Specificity: 97.24–100% |
[36][30] |
| 2017 | Kearney et al. (Lyng group) | 80 patient samples—30 negative cytology, 50 high-grade cytology | Sample preparation as for Bonnier et al. [28][29] | Raman set up as for Bonnier et al., 30 s acquisition, 2 accumulations | PCA-Factorial Discriminant Analysis (FDA) | Raman spectral signatures of superficial, intermediate, and parabasal cells High variability in spectra from cytoplasm due to glycogen Discrimination of negative and high-grade cytology Spectral differences: lipids, nucleic acids and proteins Sensitivity: 92%, Specificity: 97% |
[37][31] |
| 2018 | Traynor et al. (Lyng group) | 60 patient samples—45 negative cytology and 15 high-grade cytology | Sample preparation as for Bonnier et al. [28][29] | Raman set up as for Bonnier et al., 30 s acquisition, 2 accumulations | PLSDA | Biochemical changes due to high-grade cytology more pronounced than hormone related changes Discrimination of negative and high-grade cytology Spectral differences: glycogen, nucleic acids, and proteins Sensitivity: 96–98%, Specificity: 97–98% |
[38][32] |
| 2018 | Duraipandian et al. (Lyng group) | 35 patient samples—18 negative cytology and 17 high-grade cytology | Sample preparation as for Bonnier et al. [28][29] | Raman set up as for Bonnier et al., 30 s acquisition, 2 accumulations | PCA-LDA and PLSDA | Discrimination of negative and high-grade cytology (morphologically normal superficial and intermediate cells) Spectral differences: glycogen, nucleic acids, and proteins Sensitivity: 75.6% (PCA-LDA), 96.1% (PLSDA) Specificity: 84.5% (PCA-LDA), 93.5% (PLSDA) |
[39][33] |
| 2018 | Traynor et al. (Lyng group) | 30 patient samples—15 negative cytology and 15 high-grade cytology | Sample preparation as for Bonnier et al. [28][29] | Raman set up as for Bonnier et al. 30 s acquisition, 2 accumulations |
PLSDA | Pre-treatment of ThinPrep vial with hydrogen peroxide to remove excessive blood contamination (blood scale index 2–3) Discrimination of negative and high-grade cytology (morphologically normal superficial and intermediate cells) Spectral differences: glycogen, nucleic acids, and proteins Sensitivity: 82–92%, Specificity: 87–93% |
[40][34] |
| 2018 | Hole et al. (Krishna group) | 66 patient samples—28 negative cytology and 38 cervical cancer cytology | Centrifugation and washing with saline Pellets of exfoliated cells on calcium fluoride slides Red blood cell (RBC) lysis buffer treatment |
Horiba-Jobin-Yvon fibre-optic Raman microprobe system 785 nm laser ∼40 mW at the sample 40X/0.65 NA objective lens Spectral resolution ∼4 cm−1 15 s acquisition time, 3 accumulations |
PCA-LDA | Discrimination of negative and cancer cytology Spectral differences: DNA, protein Accuracy: 84% |
[34][27] |
| 2019 | Aljouch et al. (El-Mashtoly/Gerwert group) | 30 patient samples—10 negative, 10 low-grade and 10 high-grade cytology | Single exfoliated cells prepared using a cytospin centrifuge onto quartz slides | WITec Raman microscope 532 nm laser 60X/1.0 NA objective lens, water immersion |
Deep convolutional neural networks (DCNN) | Raman imaging of single exfoliated cells Discrimination of negative, low-grade, and high-grade cytology Spectral differences: lipids, proteins, polysaccharides, and nucleic acids Accuracy: 94–100% |
[41][35] |
| 2020 | X. Zheng et al. (Wu group) |
63 patient samples 33-normal 30- HR-HPV |
5 µL of preserved cell samples on aluminum foil, dried at room temperature | LabRam HR evolution with 532 nm laser source was focused using 50X objective | PCA-LDA | The authors observed the diagnostic accuracy of 99.4% | [42][36] |
| 2020 | Sitarz et al. (Kaczor group) |
96 patient samples––negative, low-grade, high-grade, and cancer cytology and HPV- and HPV+ | Single exfoliated cells fixed with 2.5% glutaraldehyde, washed in PBS, and placed on calcium fluoride slides | WITec Raman microscope 532 nm laser ∼28 mW at the sample 63X/1.0 NA objective lens, water immersion Spectral resolution ∼3 cm−1 |
Cluster analysis (CA) | Increased glycogen metabolism with HPV infection—for cells with large nuclear diameter, glycogen decreased in HPV positive compared to HPV negative samples | [43][37] |
| 2020 | Karunakaran et al. (Maiti group) | 124 patient samples comprising 47 negative, 41 high-grade, and 36 cancer cytology | Single exfoliated cells, cell pellets and extracted DNA incubated with gold nanoparticles (AuNPs, 40–45 nm) on glass slide | WITec Raman microscope 633 nm laser 20X objective lens |
Support vector machines (SVM) | Discrimination of negative, high-grade, and cancer cytology Spectral differences—nucleic acids and amino acids Accuracy: 94.46% (single exfoliated cells), 71.6% (cell pellets) and 97.72% (extracted DNA) |
[44][38] |
| 2021 | Karunakaran et al. (Maiti group) | 9 patient samples comprising 3 negative, 3 high-grade, and 3 cancer cytology | Density gradient centrifugation Single exfoliated cells on glass slide Incubation with SERS nanotag for 45 min |
WITec Raman microscope 633 nm laser 10 mW power 20X objective lens Spectral resolution ∼1 cm−1 10 s acquisition, 3 accumulations |
n/a | SERS detection of cervical cancer biomarkers p16 and Ki67 in single exfoliated cells | [45][39] |
| 2021 | Sitarz et al. (Kaczor group) | 63 patient samples comprising negative, low-grade, high-grade, and cancer cytology and HPV- and HPV+ | Sample preparation as for Sitarz et al. [36][30] | Raman set up as for Sitarz et al. | K means cluster analysis (KMCA) | Dual switch of lipid metabolism—decreased lipid in low-grade cytology and increased lipid in high-grade and cancer cytology compared to negative cytology | [46][40] |
| 2021 | Traynor et al. (Lyng group) | 60 patient samples for training set—30 HPV DNA positive, mRNA negative and 30 HPV DNA positive, mRNA positive 14 blinded patient samples for test set |
Sample preparation as for Bonnier et al. [28][29] | Raman set up as for Bonnier et al. 30 s acquisition, 2 accumulations |
PLSDA | Discrimination of transient and transforming HPV infections (morphologically normal superficial and intermediate cells) Spectral differences: glycogen, nucleic acids and proteins Accuracy: 93% |
[47][41] |
| 2022 | Traynor et al. (Lyng group) | 662 patient samples for training set—326 negative cytology, 200 low-grade cytology and 136 high-grade cytology 69 blinded patient samples for test set |
Sample preparation as for Bonnier et al. [28][29] | Raman set up as for Bonnier et al. 30 s acquisition, 2 accumulations |
PLSDA | Discrimination of negative, CIN1, and CIN2+ samples (morphologically normal superficial and intermediate cells) Spectral differences: glycogen, nucleic acids, and proteins Accuracy: 91.3% |
[48][42] |
2.2. Single Exfoliated Cells
In contrast to earlier work on cellular pellets, Bonnier et al. [35][28] presented a new method for recording Raman spectra from cervical cytology samples prepared as single exfoliated cells using the ThinPrep liquid-based cytology method. Pre-treatment of the slides with a hydrogen peroxide solution to clear blood residue contamination before Raman recording was shown to significantly minimize variability in the spectral data. Features related to the DNA/RNA content of the cells contributed to the discrimination of spectra from negative cytology samples and high-grade cytology samples. This pre-treatment method was later adapted to Thinprep specimens with excessive blood contamination (blood scale index 2–3) by adding hydrogen peroxide directly to the vial before slide preparation [38][32]. In this study on Raman spectra from negative cytology and high-grade cytology samples after pre-treatment, glycogen, nucleic acids, and proteins were found to be the main discriminating features regardless of whether the samples had minimal blood contamination (blood scale index 0) or excessive blood contamination (blood scale index 2–3). Traynor et al. [25][43] published a protocol for Raman spectral cytopathology for use on liquid-based cytology samples prepared onto glass slides. This protocol covered sample preparation, spectral acquisition, pre-processing, and data analysis, and it included methods of correction of the glass spectral contribution and sample pre-treatment methods to remove contaminants, such as blood and mucus. Using the same protocol, Ramos et al. [36][30] investigated if Raman spectroscopy could be applied to routine cervical cytology samples from a cervical screening programme. Raman spectra were recorded from ThinPrep samples with negative, low-grade, and high-grade cytology. Cell nuclei from normal cells (negative cytology samples) and abnormal cells (low-grade and high-grade cytology samples) were targeted. Protein features were the main discriminating feature, although some differences in nucleic acid features were also observed. A change in ratio at 1318/1339 cm−1 was also observed for negative, low-grade, and high-grade cases, suggesting a decrease in the lipid/protein to guanine ratio in low-grade and high-grade cytology samples, either as a result of a reduction of lipids/proteins and/or an increase in nucleic acid (guanine) content. Sensitivity and specificity values > 90% were achieved when the cervical intraepithelial neoplasia (CIN) terminology was used to classify the samples compared to the squamous intraepithelial lesion (SIL) terminology. Kearney et al. [37][31] continued this work on single exfoliated cells and defined the Raman spectral signatures of superficial, intermediate, and parabasal cells, which are the main cell types present in liquid-based cytology Pap test specimens. Raman spectra were recorded from both the nuclei and from the cytoplasm of negative cytology and high-grade cytology samples, and the spectra from the cytoplasm showed significant variability, which was shown to be due to different levels of glycogen in the cells at different phases of the menstrual cycle. Glycogen, nucleic acids, and proteins were the main differentiating features between Raman spectra from the nuclei of cells with normal cytology and those with high-grade cytology. A further investigation of hormone-associated variability related to the menstrual cycle, menopause, and the use of hormone-based contraceptives on the Raman spectra was carried out by Traynor et al. [40][34] on negative cytology and high-grade cytology ThinPrep samples. The findings showed that post-menopausal samples could be problematic for Raman spectral analysis due to a lack of cellular material and the presence of cellular debris and mucus. In addition, although hormone-related spectral changes in glycogen and protein features were observed, it was found that biochemical changes in cells with high-grade cytology were more pronounced than biochemical changes in cells due to the menstrual cycle or the use of hormone-based contraceptives. Up to this point, abnormal cells with high-grade cytology had been investigated using Raman spectroscopy. To overcome the challenge associated with finding the rare abnormal cells on the unstained ThinPrep slide, Duraipandian et al. [39][33] showed that biochemical differences between negative cytology and high-grade cytology samples could be detected in cells that appear normal. Using morphologically normal single exfoliated cells, Raman spectroscopy was investigated as a potential triage test to discriminate between transient and transforming HPV infections [47][41]. HPV, DNA, and mRNA testing were carried out, and Raman spectra were recorded from single-cell nuclei. Discrimination was mostly based on increased nucleic acids (727, 781, 826, 1485, and 1580 cm−1), decreased glycogen (482, 852, 937, 1082, 1123, 1334, and 1380 cm−1), and changes in protein features (1152, 1240, 1450, 1640, and 1670 cm−1), indicating increased proliferation and altered protein expression due to the overexpression of E6/E7 viral proteins. A PLS-DA classification model was trained using 60 ThinPrep cervical samples and then validated using a blinded independent test set of 14 ThinPrep cervical samples, achieving an accuracy of 93%. Again using morphologically normal single exfoliated cells, Traynor et al. [48][42] investigated the clinical utility of Raman spectroscopy for identifying cervical precancers in a large sample set of 662 ThinPrep cervical samples. Raman spectra were recorded from single cell nuclei of negative, CIN1, and CIN2+ samples as a training set. A PLSDA classification model was validated using a blinded independent test set of 69 ThinPrep cervical samples, achieving an accuracy of 91.3%.2.3. Raman Imaging
Coherent anti-Stokes Raman scattering (CARS)/second harmonic generation (SHG)/two-photon excited autofluorescence (TPF) imaging followed by Raman imaging has been applied to liquid-based Pap smear samples [41][35]. The main discriminating features were lipids, proteins, polysaccharides, and nucleic acids, and deep convolutional neural networks (DCNNs) achieved 100% accuracy for the classification of negative, low-grade, and high-grade cytology based on Raman spectral data and on morphological features obtained from CARS/SHG/TPF images. Sitarz et al. [43][37] used Raman imaging to assess glycogen levels in the cytoplasm of cervical exfoliated cells. For cervical epithelial cells with small diameter nuclei, glycogen content was similar for HPV-negative and HPV-positive samples, whereas, for cells with large diameter nuclei, glycogen content decreased in HPV-positive compared to HPV-negative samples, indicating that glycogen metabolism is accelerated with HPV infection. A follow-on study from the same group investigated the lipid profile of cervical exfoliated cells [46][40]. Lipid content was found to decrease in samples with low-grade cytology and increase in samples with high-grade cytology compared to samples with negative cytology, suggesting a dual switch of lipid metabolism.2.4. SERS
A SERS approach has been applied to cervical exfoliated cells to discriminate normal, high-grade precancer, and cervical squamous cell carcinoma [44][38]. Gold nanoparticles were used to enhance the Raman signal, and spectra were recorded from single exfoliated cells, cell pellets, and extracted DNA. Nucleic acids and amino acids were the main discriminating features. Classification accuracies of 94.46%, 71.6%, and 97.72% were achieved for single exfoliated cells, cell pellets, and extracted DNA, respectively. For extracted DNA, high accuracy was achieved for normal, high-grade precancer, and cancer samples, whereas for the single exfoliated cells and cell pellets, high accuracies were achieved for normal and cancer samples but not for high-grade samples. This SERS approach was further extended to the simultaneous detection of cervical cancer biomarkers, p16 and Ki67, in single exfoliated cells using a SERS-tag functionalized with the monoclonal antibodies against p16/Ki67 [45][39].References
- Sung, H.; Ferlay, J.; Siegel, R.L.; Laversanne, M.; Soerjomataram, I.; Jemal, A.; Bray, F. Global Cancer Statistics 2020: GLOBOCAN Estimates of Incidence and Mortality Worldwide for 36 Cancers in 185 Countries. CA Cancer J. Clin. 2021, 71, 209–249.
- Walboomers, J.M.M.; Jacobs, M.V.; Manos, M.M.; Bosch, F.X.; Kummer, J.A.; Shah, K.V.; Snijders, P.J.F.; Peto, J.; Meijer, C.J.L.M.; Muñoz, N. Human Papillomavirus Is a Necessary Cause of Invasive Cervical Cancer Worldwide. J. Pathol. 1999, 189, 12–19.
- Paavonen, J.; Naud, P.; Salmerón, J.; Wheeler, C.M.; Chow, S.N.; Apter, D.; Kitchener, H.; Castellsague, X.; Teixeira, J.C.; Skinner, S.R.; et al. Efficacy of Human Papillomavirus (HPV)-16/18 AS04-Adjuvanted Vaccine against Cervical Infection and Precancer Caused by Oncogenic HPV Types (PATRICIA): Final Analysis of a Double-Blind, Randomised Study in Young Women. Lancet 2009, 374, 301–314.
- Franco, E.L.; Schlecht, N.F.; Saslow, D. The Epidemiology of Cervical Cancer. Cancer J. 2003, 9, 348–359.
- Simms, K.T.; Steinberg, J.; Caruana, M.; Smith, M.A.; Lew, J.-B.; Soerjomataram, I.; Castle, P.E.; Bray, F.; Canfell, K. Impact of Scaled up Human Papillomavirus Vaccination and Cervical Screening and the Potential for Global Elimination of Cervical Cancer in 181 Countries, 2020–2099: A Modelling Study. Lancet Oncol. 2019, 20, 394–407.
- Sundström, K.; Miriam Elfström, K. Advances in Cervical Cancer Prevention: Efficacy, Effectiveness, Elimination? PLoS Med. 2020, 17, e1003035.
- Davies-Oliveira, J.C.; Smith, M.A.; Grover, S.; Canfell, K.; Crosbie, E.J. Eliminating Cervical Cancer: Progress and Challenges for High-Income Countries. Clin. Oncol. (R. Coll. Radiol.) 2021, 33, 550–559.
- Bruni, L.; Diaz, M.; Barrionuevo-Rosas, L.; Herrero, R.; Bray, F.; Bosch, F.X.; de Sanjosé, S.; Castellsagué, X. Global Estimates of Human Papillomavirus Vaccination Coverage by Region and Income Level: A Pooled Analysis. Lancet Glob. Health 2016, 4, e453–e463.
- Lei, J.; Ploner, A.; Lehtinen, M.; Sparén, P.; Dillner, J.; Elfström, K.M. Impact of HPV Vaccination on Cervical Screening Performance: A Population-Based Cohort Study. Br. J. Cancer 2020, 123, 155–160.
- Tota, J.E.; Bentley, J.; Blake, J.; Coutlée, F.; Duggan, M.A.; Ferenczy, A.; Franco, E.L.; Fung-Kee-Fung, M.; Gotlieb, W.; Mayrand, M.H.; et al. Introduction of Molecular HPV Testing as the Primary Technology in Cervical Cancer Screening: Acting on Evidence to Change the Current Paradigm. Prev. Med. 2017, 98, 5–14.
- Bonde, J.; Floore, A.; Ejegod, D.; Vink, F.J.; Hesselink, A.; Ven, P.M.; Valenčak, A.O.; Pedersen, H.; Doorn, S.; Quint, W.G.; et al. Methylation Markers FAM19A4 and miR124-2 as Triage Strategy for Primary Human Papillomavirus Screen Positive Women: A Large European Multicenter Study. Int. J. Cancer 2020, 148, 396–405.
- Ellis, D.I.; Cowcher, D.P.; Ashton, L.; O’Hagan, S.; Goodacre, R. Illuminating Disease and Enlightening Biomedicine: Raman Spectroscopy as a Diagnostic Tool. Analyst 2013, 138, 3871–3884.
- Raman, C.V. The Colour of the Sea. Nature 1921, 108, 367.
- Raman, C.V.; Krishnan, K.S. A New Type of Secondary Radiation. Nature 1928, 121, 501–502.
- Wells, L.J. Diagnosis of Uterine Cancer by the Vaginal Smear. By George, N. Papanicolaou and Herbert, F. Traut. The Commonwealth Fund, New York. Vii + 46 Pp. 1943 ($5.00). Anat. Rec. 1943, 86, 591–592.
- Swid, M.A.; Monaco, S.E. Should Screening for Cervical Cancer Go to Primary Human Papillomavirus Testing and Eliminate Cytology? Mod. Pathol. 2022, 35, 858–864.
- Javier, R.T.; Butel, J.S. The History of Tumor Virology. Cancer Res. 2008, 68, 7693–7706.
- Bedell, S.L.; Goldstein, L.S.; Goldstein, A.R.; Goldstein, A.T. Cervical Cancer Screening: Past, Present, and Future. Sex. Med. Rev. 2020, 8, 28–37.
- Gibb, R.K.; Martens, M.G. The Impact of Liquid-Based Cytology in Decreasing the Incidence of Cervical Cancer. Rev. Obstet. Gynecol. 2011, 4, S2–S11.
- Cheng, L.; Wang, Y.; Du, J. Human Papillomavirus Vaccines: An Updated Review. Vaccines 2020, 8, 391.
- Malinowski, D.P.; Broache, M.; Vaughan, L.; Andrews, J.; Gary, D.; Kaufman, H.W.; Alagia, D.P.; Chen, Z.; Onisko, A.; Austin, R.M. Cotesting in Cervical Cancer Screening. Am. J. Clin. Pathol. 2021, 155, 150–154.
- Maver, P.J.; Poljak, M. Primary HPV-Based Cervical Cancer Screening in Europe: Implementation Status, Challenges, and Future Plans. Clin. Microbiol. Infect. 2020, 26, 579–583.
- What Early Detection and Prevention Measures Are Available? Germany. Available online: https://www.krebsdaten.de/krebs/en/content/cancer_sites/cervical_cancer/cervical_cancer_node.html (accessed on 3 January 2020).
- Bazant-Hegemark, F.; Edey, K.; Swingler, G.R.; Read, M.D.; Stone, N. Review: Optical Micrometer Resolution Scanning for Non-Invasive Grading of Precancer in the Human Uterine Cervix. Technol. Cancer Res. Treat. 2008, 7, 483–496.
- Chilakapati, M.; Sockalingum, G.; Vidyasagar, M.; Manfait, M.; Fernanades, D.; Vadhiraja, B.; Maheedhar, K. An Overview on Applications of Optical Spectroscopy in Cervical Cancers. J. Cancer Res. Ther. 2008, 4, 26.
- Vargis, E.; Tang, Y.-W.; Khabele, D.; Mahadevan-Jansen, A. Near-Infrared Raman Microspectroscopy Detects High-Risk Human Papillomaviruses. Transl. Oncol. 2012, 5, 172–179.
- Rubina, S.; Amita, M.; Kedar, K.D.; Bharat, R.; Krishna, C.M. Raman Spectroscopic Study on Classification of Cervical Cell Specimens. Vib. Spectrosc. 2013, 68, 115–121.
- Gautam, R.; Vanga, S.; Ariese, F.; Umapathy, S. Review of Multidimensional Data Processing Approaches for Raman and Infrared Spectroscopy. EPJ Tech. Instrum. 2015, 2, 8.
- Talari, A.C.S.; Movasaghi, Z.; Rehman, S.; Rehman, I.U. Raman Spectroscopy of Biological Tissues. Appl. Spectrosc. Rev. 2015, 50, 46–111.
- Hole, A.; Tyagi, G.; Sahu, A.; Shaikh, R.; Chilakapati, M. Exploration of Raman Exfoliated Cytology for Oral and Cervical Cancers. Vib. Spectrosc. 2018, 98, 35–40.
- Bonnier, F.; Traynor, D.; Kearney, P.; Clarke, C.; Knief, P.; Martin, C.; O’Leary, J.J.; Byrne, H.J.; Lyng, F. Processing ThinPrep Cervical Cytological Samples for Raman Spectroscopic Analysis. Anal. Methods 2014, 6, 7831–7841.
- Ramos, I.; Meade, A.D.; Ibrahim, O.; Byrne, H.; McMenamin, M.; McKenna, M.; Malkin, A.; Lyng, F. Raman Spectroscopy for Cytopathology of Exfoliated Cervical Cells. Faraday Discuss. 2015, 187, 187–198.
- Kearney, P.; Traynor, D.; Bonnier, F.; Lyng, F.M.; O’Leary, J.J.; Martin, C.M. Raman Spectral Signatures of Cervical Exfoliated Cells from Liquid-Based Cytology Samples. J. Biomed. Opt. 2017, 22, 1.
- Traynor, D.; Duraipandian, S.; Martin, C.M.; O’Leary, J.J.; Lyng, F.M. Improved Removal of Blood Contamination from ThinPrep Cervical Cytology Samples for Raman Spectroscopic Analysis. J. Biomed. Opt. 2018, 23, 1.
- Duraipandian, S.; Traynor, D.; Kearney, P.; Martin, C.; O’Leary, J.J.; Lyng, F.M. Raman Spectroscopic Detection of High-Grade Cervical Cytology: Using Morphologically Normal Appearing Cells. Sci. Rep. 2018, 8, 15048.
- Traynor, D.; Kearney, P.; Ramos, I.; Martin, C.M.; O’Leary, J.J.; Lyng, F.M. A Study of Hormonal Effects in Cervical Smear Samples Using Raman Spectroscopy. J. Biophotonics 2018, 11, e201700240.
- Aljakouch, K.; Hilal, Z.; Daho, I.; Schuler, M.; Krauß, S.D.; Yosef, H.K.; Dierks, J.; Mosig, A.; Gerwert, K.; El-Mashtoly, S.F. Fast and Noninvasive Diagnosis of Cervical Cancer by Coherent Anti-Stokes Raman Scattering. Anal. Chem. 2019, 91, 13900–13906.
- Zheng, X.; Wang, J.; Yin, L.; Luo, B.; Lv, X.; Wu, G. Label-Free Detection of High-Risk Human Papillomaviruses Infection Using Raman Spectroscopy and Multivariate Analysis. Laser Phys. Lett. 2020, 17, 115601.
- Sitarz, K.; Czamara, K.; Bialecka, J.; Klimek, M.; Zawilinska, B.; Szostek, S.; Kaczor, A. HPV Infection Significantly Accelerates Glycogen Metabolism in Cervical Cells with Large Nuclei: Raman Microscopic Study with Subcellular Resolution. Int. J. Mol. Sci. 2020, 21, 2667.
- Karunakaran, V.; Saritha, V.N.; Joseph, M.M.; Nair, J.B.; Saranya, G.; Raghu, K.G.; Sujathan, K.; Kumar, K.S.; Maiti, K.K. Diagnostic Spectro-Cytology Revealing Differential Recognition of Cervical Cancer Lesions by Label-Free Surface Enhanced Raman Fingerprints and Chemometrics. Nanomed. Nanotechnol. Biol. Med. 2020, 29, 102276.
- Karunakaran, V.; Saritha, V.N.; Ramya, A.N.; Murali, V.P.; Raghu, K.G.; Sujathan, K.; Maiti, K.K. Elucidating Raman Image-Guided Differential Recognition of Clinically Confirmed Grades of Cervical Exfoliated Cells by Dual Biomarker-Appended SERS-Tag. Anal. Chem. 2021, 93, 11140–11150.
- Sitarz, K.; Czamara, K.; Bialecka, J.; Klimek, M.; Szostek, S.; Kaczor, A. Dual Switch in Lipid Metabolism in Cervical Epithelial Cells during Dysplasia Development Observed Using Raman Microscopy and Molecular Methods. Cancers 2021, 13, 1997.
- Shen, Z.-W.; Zhang, L.-J.; Shen, Z.-Y.; Zhang, Z.-F.; Xu, F.; Zhang, X.; Li, R.; Xiao, Z. Efficacy of Raman Spectroscopy in the Diagnosis of Uterine Cervical Neoplasms: A Meta-Analysis. Front. Med. 2022, 9, 1277.