Your browser does not fully support modern features. Please upgrade for a smoother experience.
Please note this is a comparison between Version 4 by Lindsay Dong and Version 5 by Lindsay Dong.
One of the most common failures or breakdowns that can occur in high-voltage (HV) equipment is due to partial discharges (PDs). This occurs as a result of inadequate insulation, aging, harsh environmental effects, or manufacturing flaws. PD detection and recognition methods have gained growing attention and have seen great progress in the past decades. Radiometric methods are one of the most investigated detection approaches due to their immunity to electromagnetic interference (EMI) and their capabilities to detect and locate PD activities in different applications such as transformers, cables, etc.
- partial discharge detection
- HV equipment diagnosis
- radiometric detection
1. Introduction
The stability of the electrical insulation in high-voltage (HV) equipment can have a major impact on the lifespan of the apparatus, depending on working conditions and operating stability. In the contemporary electric power industry, technicians and engineers oversee the operation as well as the maintenance of electrical equipment, cables, and machinery that connect electrical substations to power plants [1]. Extending the usable life of electrical apparatus by reducing the potential sources of failure or degradation is a critical part of these experts’ tasks [2]. However, a high percentage of failures occur in the insulation system due to the uncontrolled existence of several aging mechanisms of electrical, chemical, thermal, radiation [3], and environmental origin [4]. These phenomena, over time, tend to accelerate the deterioration of the material’s dielectric properties, leading to equipment breakdown. One of the important indicators when diagnosing the insulation condition of an electrical asset is the measurement of partial discharge (PD) activity, since its presence can be considered both a cause and a result of most electrical problems in insulation systems [5].
PD activity is a detectable fault that tends to occur in those parts of the insulation of any electrical device where the dielectric strength is low or where there is greater electric field stress [6]. In this respect, it is essential not to exceed the rated operating values to avoid overloading, which could lead to damaging some point or area of the insulation material. However, it has been demonstrated that PD activity can be detected even during operation at nominal voltage levels without causing immediate equipment failure, and its recurrence can lead to progressive insulation deterioration due to electron and ion attacks and chemical degradation [2][5][7][2,5,7]. PDs can be categorized into four classes based on their nature and location, namely: internal, surface, treeing, and corona [8]. The effect of some PD types can be simulated using the finite element method to examine their adverse effect on the electric field distribution in the insulator [9]. Some types of PD may be less detrimental to material deterioration than others and, once discovered, can be effectively controlled during periodic maintenance work [10][11][10,11]. Therefore, the quantification of PD activity in the equipment during the maintenance process is essential, as it will help to accurately assess the severity of possible failures or the appearance of new defects that likely will affect performance in the short, medium, or long term [12]. To obtain sufficient monitoring capabilities for PD detection, various methods have been devised and used for insulation testing, including the conventional electrical method based on IEC 60270 as well as other unconventional approaches [13]. The standard electrical approach is the most widely used due to its efficiency; nevertheless, the existence of disturbances due to external electrical noise and interference during PD testing is a drawback. This noise causes a loss of sensitivity, especially when low-energy PD pulses are present in the HV system. Another disadvantage of PD electrical measurements is the presence of more than one source of the pulse-shaped signal in the HV electric system under examination. In this case, proper selection of the unconventional measurement approach followed by efficient signal processing is required to accomplish an accurate assessment of the insulation condition. Unconventional approaches rely on physical phenomena associated with PD events such as acoustic pressure waves, optical emission [14], chemical byproducts [15], and electromagnetic (EM) waves [16].
2. Partial Discharges Overview
2.1. PD Background and Types
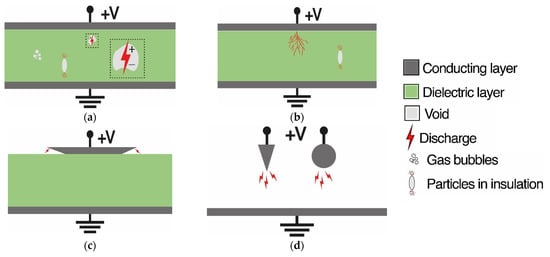
A PD is a localized dielectric breakdown (that does not completely bridge the gap between the two conductors), caused by a localized electric field greater than the system’s dielectric withstand capability, of a small part of an electrical insulation system (solid, fluid, or gas). From the 1990s to the present day, much research has been carried out to investigate PDs, and intriguing publications have been published that detail the physical characteristics of the phenomenon [10][17][18][10,28,29]. PDs exhibit stochastic behavior over time due to the stochasticity of the delay caused by the random availability of the discharge’s starting electron and memory impacts caused by prior discharges influencing subsequent ones. Particularly once stimulated, PDs affect the characteristics of the dielectric material and leave behind residual charges trapped on the dielectric surface, which then impact the occurrence of future PDs [19][20][30,31]. However, as is well known, an insulation diagnosis is difficult to obtain because characteristics such as the magnitude and timing of the onset of the PD change stochastically. Partial discharges may be categorized into four types: internal, treeing, surface, and corona discharges, as shown in Figure 1. Internal partial discharges are the most common and are one of the leading causes of premature insulator failure in the electrical power grid. In fact, during the manufacturing process, micro air cavities may get trapped in the dielectric material, and thus, when the insulation is subjected to a high voltage stress, an unbalanced distribution is formed between the electric field present in the air microcavities and that in the surrounding dielectric layer (Figure 1a). Internal PD is a silent defect without sound, smell, or visual indication of a problem prior to failure, which makes it the most harmful. Therefore, the presence of air voids within the dielectric bulk seems to be a disruptive and dangerous source of PD phenomena. Another type of discharge that occurs in dielectrics is known as ‘treeing discharge’, so named because of its branched tree expansion path (Figure 1b). Different types of electrical trees exist, such as branch types, bush types, dendrites, spikes, bow ties, and vented trees. They can occur due to high divergent electric stress over a long period of time, initiated from mechanical defects (e.g., protrusions, cracks, physical sharp points, imperfections, etc.), gas voids, or impurities within the insulation materials. Recurring faults will cause the electrical trees to spread and lengthen due to the decomposition of organic substances forming the bulk dielectric, which will then degrade its insulating capability. Thus, electrical trees have long been considered a significant insulation hazard that, if triggered, results in a full discharge [21][32]. Surface discharges occur on the surface of any solid insulating material under the tangential components of the electric field (Figure 1c). This discharge, identified by crackling and the smell of ozone, is commonly seen on overhead line insulators, especially contaminated insulators, during days of high humidity. Corona discharges (CDs) occur under high voltage stress when a conductor has sharp irregularities and is exposed to air. At these sharp points, a strong enough electric field is created and causes the ionization of the air, which conducts electricity and ignites an electric arc, corroding the insulation (Figure 1d) [8][22][8,33]. Unlike other types of PD, a corona discharge is visible and usually revealed by a relatively steady glow or brush discharge in the air.Figure 1.
Different types of partial discharges: (
a
) internal, (
b
) treeing, (
c
) surface, and (
d) corona.
2.2. PD Patterns Representation
The processing of PD-related information includes three main steps: detection, classification, of which recognition is an important part, and finally, localization. In 1961, Kreuger was the first to deal with the identification of the PD phenomena [23], followed by Gulski’s work on their recognition in 1991 [24] and their classification in 1993 [10]. Discharges of unknown origin can be recognized via the classification process by matching the fingerprint of the examined discharge with known patterns. As such, differentiating between diverse types of PDs provides an initial assessment of the nature and severity of the deteriorated spot where the PD is occurring to facilitate grid diagnosis operations and reduce maintenance time [12]. Recognition of PD defects (including corona, internal, poor contact, floating metal work, etc.) can be performed with two basic implementation approaches: time-resolved or phase-resolved patterns; each has advantages and challenges. The time-resolved pattern, or
) corona.
2.2. PD Patterns Representation
The processing of PD-related information includes three main steps: detection, classification, of which recognition is an important part, and finally, localization. In 1961, Kreuger was the first to deal with the identification of the PD phenomena [34], followed by Gulski’s work on their recognition in 1991 [35] and their classification in 1993 [10]. Discharges of unknown origin can be recognized via the classification process by matching the fingerprint of the examined discharge with known patterns. As such, differentiating between diverse types of PDs provides an initial assessment of the nature and severity of the deteriorated spot where the PD is occurring to facilitate grid diagnosis operations and reduce maintenance time [12]. Recognition of PD defects (including corona, internal, poor contact, floating metal work, etc.) can be performed with two basic implementation approaches: time-resolved or phase-resolved patterns; each has advantages and challenges. The time-resolved pattern, or
q-t
, is the signal output waveform
q
(where
q
is the amplitude of either the apparent charge in pC or the voltage pulse—discharge voltage—in mV) captured by the sensor versus time,
t. This individual PD pulse shape may be of interest in time-resolved data patterns since there is a link between the PD signal shape and the type of insulation defect, which offers aging information about the insulation system [10][25]. The phase-resolved PD (PRPD) pattern is a visual representation of PD activities relative to the 360 degrees of an AC cycle. The HV AC test voltage waveform is used as a reference for gathering PRPD data, which is frequently referred to by
. This individual PD pulse shape may be of interest in time-resolved data patterns since there is a link between the PD signal shape and the type of insulation defect, which offers aging information about the insulation system [10,36]. The phase-resolved PD (PRPD) pattern is a visual representation of PD activities relative to the 360 degrees of an AC cycle. The HV AC test voltage waveform is used as a reference for gathering PRPD data, which is frequently referred to by
φ-q-n. In the phase-resolved recognition method, a strong relationship is found between the shape and type of PD pattern, but it is independent of the electrical path between the defect and the detector [26]. Practically, a PD detector is required to pick up the individual PD signal and measure all pulse occurrences over a given duration based on the phase angle (
. In the phase-resolved recognition method, a strong relationship is found between the shape and type of PD pattern, but it is independent of the electrical path between the defect and the detector [37]. Practically, a PD detector is required to pick up the individual PD signal and measure all pulse occurrences over a given duration based on the phase angle (
φ
), discharge magnitude (
q
), and discharge rate (or number of PDs,
n), at a specified test voltage [27]. For computational purposes, the relevant phase and amplitude pulse numbers of PRPD patterns are often kept in matrix format [25]. The data analysis module is often equipped with advanced pattern recognition techniques to help differentiate PD from noise and even to identify the specific sources of PD and locate them. However, in the time-resolved method, a strong relationship between the physics of the defects and the shape of the signal is found [26]. When compared to phase-resolved measurements, time-resolved patterns often require less costly measurement apparatus. Phase-resolved data are commonly utilized in PD classification studies because they can describe the physical operation process at the PD location, as individual PD pulses have a strong relationship to PRPD patterns.
), at a specified test voltage [38]. For computational purposes, the relevant phase and amplitude pulse numbers of PRPD patterns are often kept in matrix format [36]. The data analysis module is often equipped with advanced pattern recognition techniques to help differentiate PD from noise and even to identify the specific sources of PD and locate them. However, in the time-resolved method, a strong relationship between the physics of the defects and the shape of the signal is found [37]. When compared to phase-resolved measurements, time-resolved patterns often require less costly measurement apparatus. Phase-resolved data are commonly utilized in PD classification studies because they can describe the physical operation process at the PD location, as individual PD pulses have a strong relationship to PRPD patterns.
Figure 2 depicts typical PRPD representative patterns for each defect type. These results were recorded using an HFCT sensor, according to Romano et al. [28].
depicts typical PRPD representative patterns for each defect type. These results were recorded using an HFCT sensor, according to Romano et al. [39].
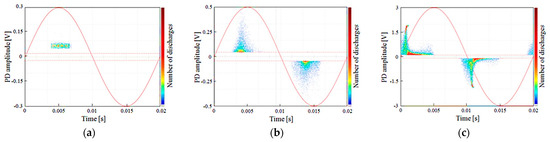
Figure 2.
PRPD patterns (colored points) showing the magnitude of all recorded discharge events (
y
-axis) plotted against time (
x
-axis) compared to the excitation AC for: (
a
) corona discharge, (
b
) surface discharge, and (
Offline and online PD detections are the two basic ways of measuring PD. Offline procedures are tests in which the equipment under inspection is disconnected from regular operation and powered by an external voltage source [29][45]. Since the applied measurement voltage may be varied, offline PD testing offers advantages, such as the ability to calculate PD extinction voltage (PDEV) and PD inception voltage (PDIV). Online testing is carried out while the equipment is powered up at the recommended operating voltage, allowing accurate PD behavior to be acquired and assessed (real operating conditions are applied). The benefits of online PD testing include PD characteristics that may be measured under varied load circumstances and the ability to conduct tests without causing a power interruption. Now only offline procedures are standardized in IEC 60270. Online approaches continue to be novel, with no standard to compare them against. On the other hand, in recent years, online tests have gained popularity for diagnosing PD in cables. Indeed, current online detection and localization techniques can locate PD sources in switching and cabling equipment, thereby reducing the downtime needed to repair or replace assets. Online and offline PD testing complement each other. A more accurate assessment of cable condition can be achieved by combining both approaches. The majority of PD classification research employs the offline detection approach, as it is more convenient to undertake in a lab setting.

2.4. Different Methods for PD Detection
2.4.1. Conventional Detection Method: IEC 60270
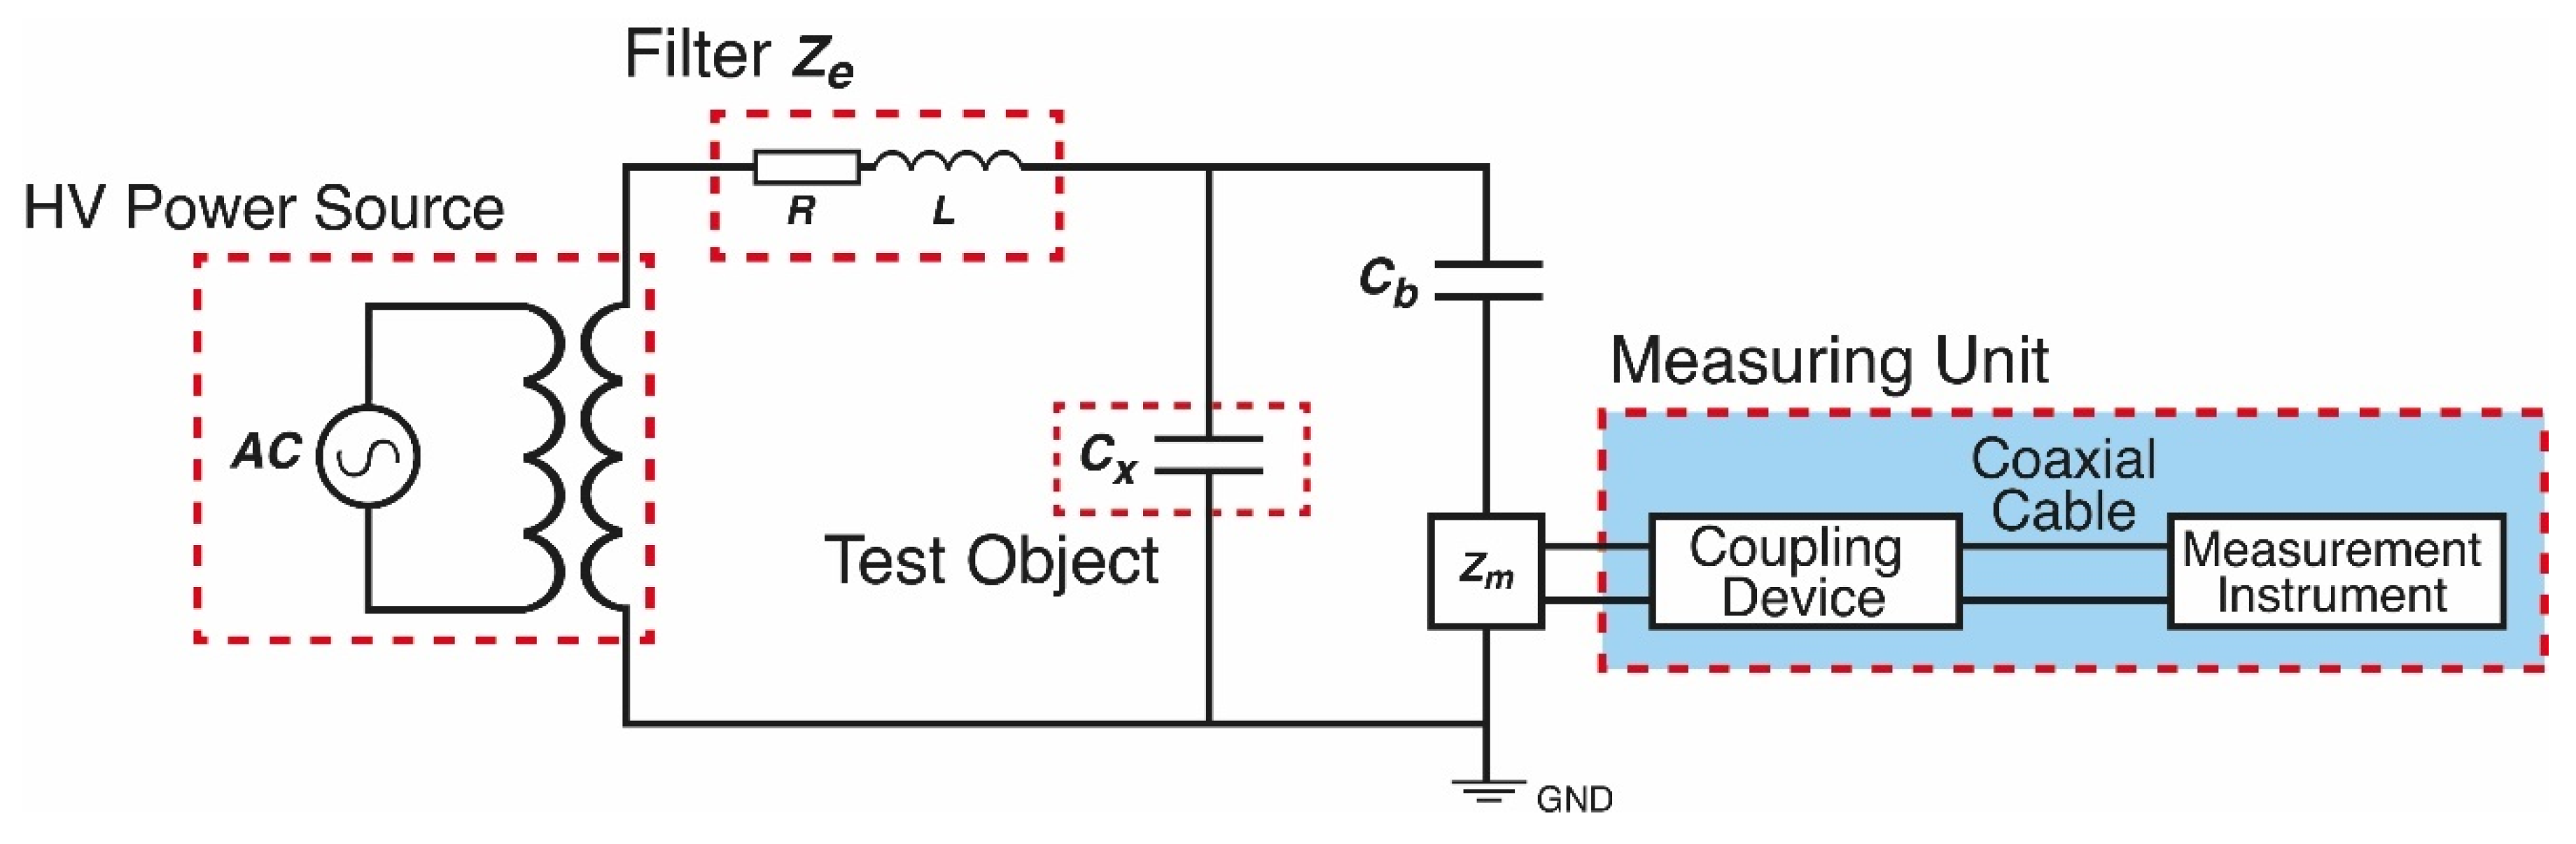
Electrical detection of PD relies on sensing the high-frequency current pulse that travels through the object’s insulating capacitance due to a flashover occurrence. The electrical method based on a coupling capacitor for PD detection as described in the IEC 60270 standard is widely established due to its accuracy and ability to detect PD levels under offline conditions. Figure 3 depicts the test circuit used for PD measurements in this approach, which consists of an HV AC source with a sufficiently low level of background noise, the test object Cx (in which the PD occurs), a coupling capacitor Cb (with low inductance design), and a measuring impedance Zm, as important circuit components. The filter unit Ze suppresses unwanted high-frequency background noise or disturbances generated by AC voltage sources. It is usually built as a large inductor because the tested object insulation system, Cx, exhibits a predominantly capacitive character. The coupling capacitor, when connected in series with the impedance Zm, creates a capacitive divider, converting the high-frequency current into a voltage signal detectable by the measuring instrument [30][57]. When a discharge occurs in the object under test, the coupling capacitor transfers a charge to it to compensate for the momentary collapse of the voltage across it [31][18].
Figure 3.
Electrical PD measuring circuit based on the IEC 60270 standard.
2.4.2. Radiofrequency (RF) Methods
The RF approach utilizes appropriate sensors to detect and receive the electromagnetic wave generated when PD occurs. The emitted EM radiation consists of a combination of different frequency components up to a few GHz, which are classified into three bands: high-frequency (HF), very high-frequency (VHF), and ultra-high-frequency (UHF) [32][58]. RF-based techniques to detect PD activity have interesting characteristics because they allow noninvasive, continuous, and low-cost monitoring of PD activity. Moreover, among the various PD detection methods, they have the advantage of supporting online monitoring and allowing defect classification. Since EM waves in space consist of an electric field measured in V/m and a magnetic field measured in A/m, by using a loop antenna, the magnetic field perpendicular to the electric field can be detected separately.2.4.3. Non-Electrical Methods
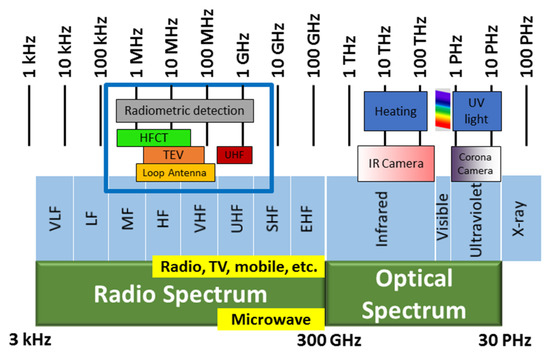
Besides RF detection, other unconventional methods rely on other physical phenomena associated with PD events, such as light waves, chemical by-products, acoustic signals, local temperature rises, etc. Optical sensing is undertaken by placing an optical sensor close to the power equipment. It is based on the detection of light generated as a result of the ionization, excitation, and recombination processes that take place during the discharge. However, the optical spectrum of various discharge types is not the same. The insulating medium (gaseous, liquid, or solid) and other factors (temperature, pressure, etc.) affect the amount of light emitted and its wavelength. As a result, the surrounding medium and the intensity of the discharge affect the spectrum of light emitted by PD. The optical spectrum extends from ultraviolet in the visible range to infrared (Figure 4) [33][62]. The competitive advantage of this method is its immunity to electromagnetic interference (EMI). However, a significant limitation is its low sensitivity, which is excessively affected by internal barriers within the equipment, which causes light reflection, scattering, and attenuation [8]. Another drawback is the high cost of optical sensors, which still requires improvement.Figure 4.
Location of the different radio and optical detection methods on the electromagnetic spectrum.
3. Radiometric Sensors for PD Detection
The RF method was developed in 1988 to record the EM waves radiated from the PD source for gas-insulated switchgear (GIS) [34][71] and was subsequently adapted to power transformers and cables in 1997 and 1998 [35][72]. The PD rise time of the pulses (as low as a few ns) indicates that they have a wide frequency spectrum that can reach up to several hundred MHz or even the GHz range. Hence, the RF signal created by PD activity could fall within many RF frequency bands (HF, VHF, and UHF). The main advantage of these types of sensors is that they do not require galvanic contact with the equipment to be monitored. With the proper calibration, observed PD signals may be utilized to diagnose the insulation status of the GIS, transformers, and cables.

3.1. Inductive Sensors
3.1.1. High-Frequency Current Transformer (HFCT)
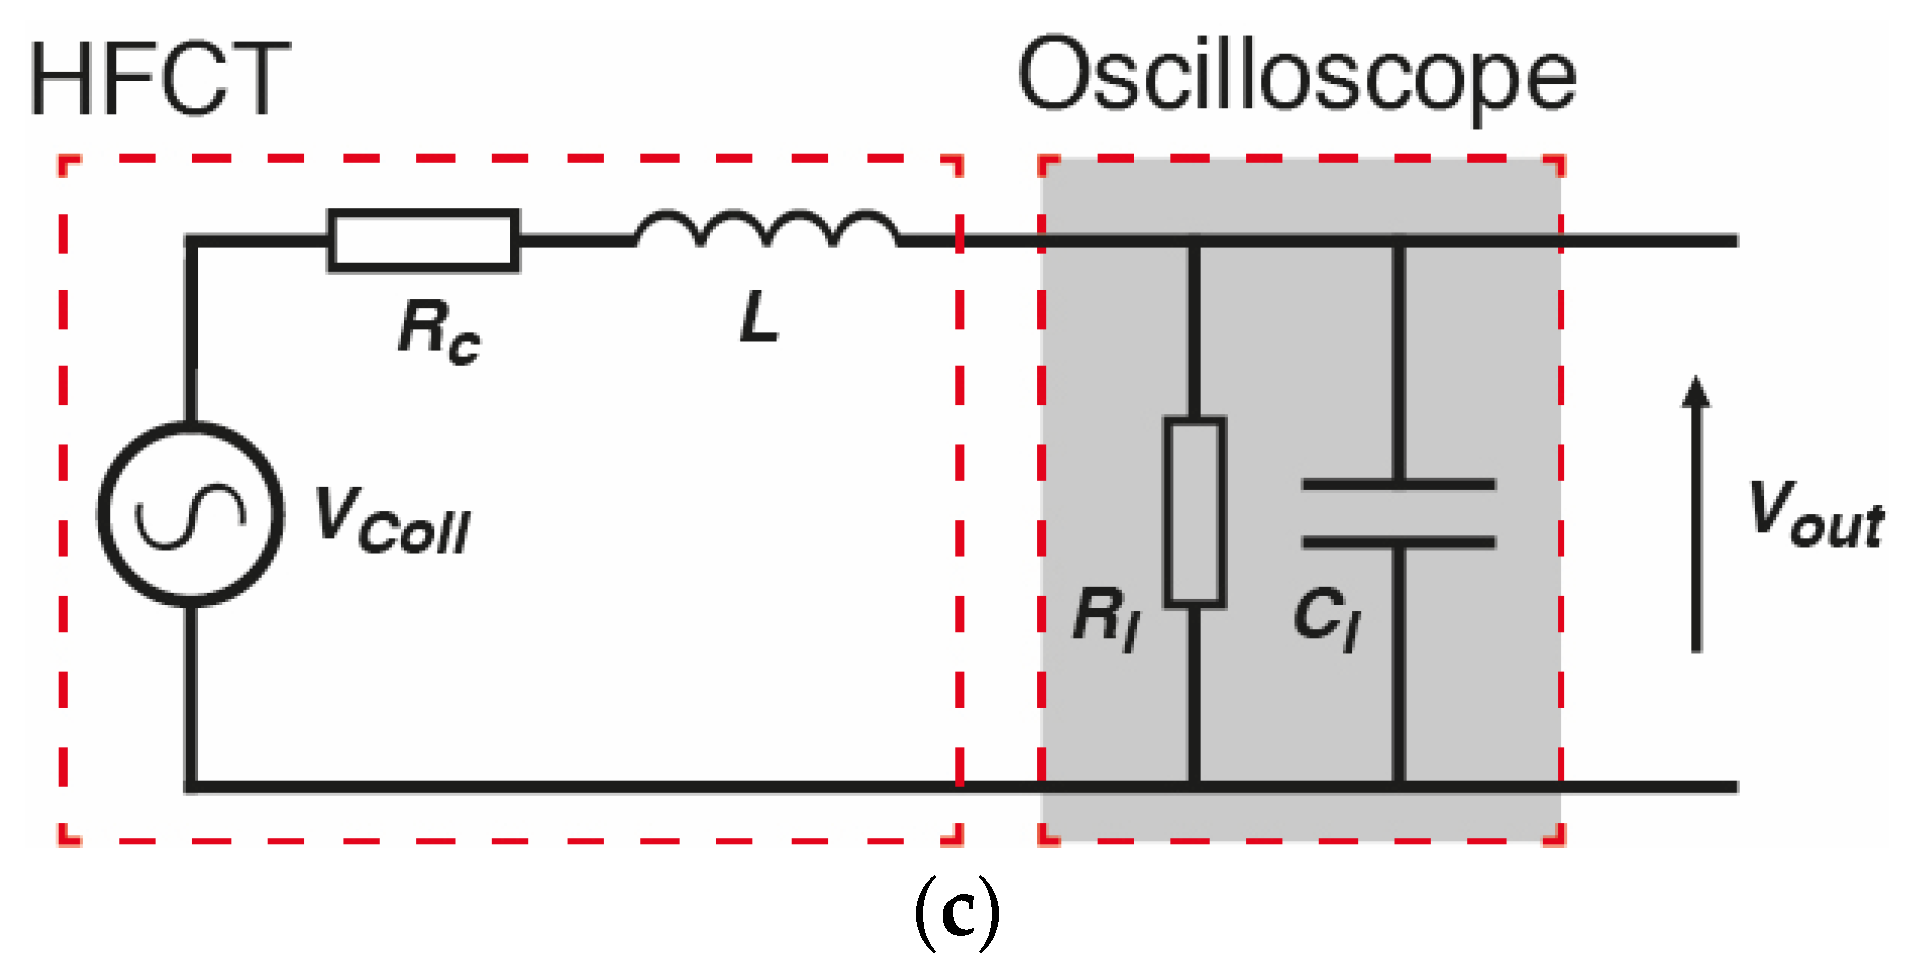
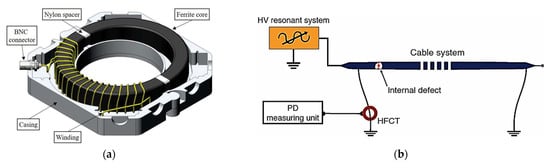
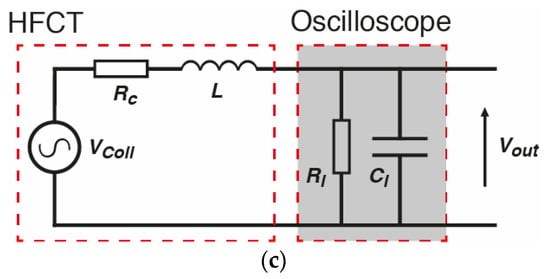
The HFCT sensor is a high-frequency current transformer designed specifically for picking up partial discharge signals, predominantly in power cables. It consists mainly of an electrical wire (the secondary) wound around a toroidal, soft ferrite core (Figure 5a). The toroid is clamped around the earth sheath (the primary), through which pulse-shaped noise interferences (PD pulses) pass (Figure 5b). This transient current signal in the power cable excites a magnetic field that will be concentrated and confined in the toroidal core. This magnetic flux induces a corresponding voltage in the secondary winding of the HFCT, which can be measured at the output of the sensor [36][73]. HFCT sensors often have a ferrite split core, which makes them easy to install and allows them to be retrofitted to earth straps without disconnection. The measuring frequency range for this type of sensor is 30 kHz–30 MHz, which covers the HF band. Indeed, ferrite cores are widely accessible in the required frequency range, making the production of high-quality HFCT sensors simple and affordable. Certainly, a higher cutoff frequency would ensure faithful rendering of fast transients. The equivalent circuit model of the sensor is illustrated in Figure 5c.Figure 5. (a) HFCT model (20 winding turns) with the top part of the casing removed [37][74], (b) HFCT sensor placed in a ground conductor for PD measurement in the cable system, (c) the equivalent circuit model of the HFCT sensor.
Online HFCT’s capability to locate and identify dangerous PD activity in rotating machines, cables, switchgears, and transformers has been confirmed [38][75]. The severity of the PD is quantified by measuring the burst interval between the end of a burst and the beginning of the next burst. As the insulation failure worsens, the burst interval shortens until the critical point of two milliseconds is reached, resulting in a major failure with full-blown discharge. Current pulses created near the discharge’s origin have risen times of nanoseconds or less, producing a frequency spectrum with substantial components down to hundreds of MHz or even units of GHz [39][76]. PD detection with HFCT sensors has several advantages, including: (i) sensitivity is not as dependent on pulse shape as in traditional PD measurement equipment; (ii) data evaluation in certain frequency bands and signal-to-noise ratio (SNR) can be enhanced; and (iii) sensitivity is high when the sensor is close to the PD source and low when far from it. In addition, when two or more HFCT sensors are installed in an HV installation, measuring PD pulses with a common time reference allows fault locations to be determined using time-of-flight analysis [38][75].
3.1.2. Rogowski Coil (RC)
HFCT sensors are excellent for measuring PD pulses but are made of expensive ferromagnetic materials, which can become saturated when coupled to high voltage wires on one side, and can handle up to 50 MHz in flux lines on the other. As an alternative, the Rogowski coil (RC), named after Walter Rogowski, is an electrical device that has been employed for around a century for measuring alternating and impulse currents. It consists of a helical coil, of which the wire from one end returns through the center of the helical to join the first end so that the two terminals of the coil are at the same side [40][41][21,77]. RC is similar to HFCT but without a magnetic core; hence the term “air-cored coil”. Depending on the type of construction, the smallest currents with rise times in the nanosecond range or the largest power-frequency short-circuit currents can be measured. The coil is constructed using a helical winding wound on a non-magnetic toroidal solid core. The return wire is passed through the torus to have both ends on the same side for even easier installation rather than a split-core current transformer and to cancel out unnecessary electromagnetic fields. Indeed, any axial magnetic flux will induce voltages in both the central conductor and the helical winding turns. If the diameter of the toroidal winding is small enough compared to the major torus diameter, the induced voltages from the two wires will oppose and cancel each other out. In contrast, a radial flux will not produce any voltage in the central conductor. Toroidal windings, with a relatively large pitch, can induce significant voltage. However, the radial flux must intersect these turns in the positive and negative directions, so the induced voltages almost cancel each other out. Consequently, only azimuthal magnetic flux induces significant voltages in an RC. The RC sensor operates with the same principle (Faraday’s law) as the HFCT sensor, so it senses the time derivative of the current pulses associated with PD and produces a proportional output. This variable current creates a magnetic field that connects the secondary of the coil and causes a voltage that is directly proportional to the current change in the conductor as well as the mutual inductance between the coil and the conductor [42][78].3.1.3. Inductive Loop Sensor (ILS)
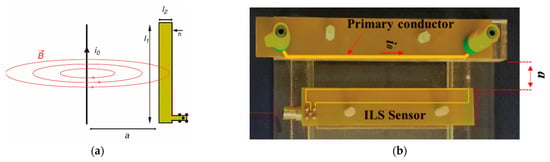
An effective PD sensor should be compact and easy to install, sensitive to tens of pC of PD level, and have high saturation performance. Another simple, low-cost air-cored inductive coupling sensor capable of measuring PD pulses with simple distributed parameter models with high-frequency and high saturation performance can be used. The loop inductive sensor (ILS), consist of a single conductive rectangular loop printed on a circuit board and placed parallel to the line that conducts the PD pulse stream (in series with the coupling capacitor). Like HFCT and RC sensors, ILSs are based on Faraday’s law and measure the voltage induced in a loop through the change in the magnetic field caused by the PD pulse. Hence, the magnetic flux through the surface of the loop induces a voltage proportional to the derivative of the primary current, which depends on the geometry of the turn and its separation from the primary conductor (Figure 68). It has been experimentally proven that these sensors are able to monitor various forms of PD from the ground line leakage current. The use of ILS sensors is very limited since a fixed separation distance of 1 mm from the primary conductor must be respected. This restricts the use of these sensors with real apparatus, such as generators and transformers, as there is no easy access to ensure galvanic coupling.Figure 68. ILS sensor: (a) working principle based on Faraday’s law, and (b) arrangement with the primary conductor carrying the PD pulse [43][87].
3.2. Loop Antennas
Loop antennas, with one or more turns, are simple, compact, inexpensive, and versatile antennas with a wide range of applications. They consist of a closed loop, or coil of wire, of electrical conductors wrapped in a spiral or around a core. They may be in any shape, such as circular, rectangular, triangular, square, or hexagonal, according to the designer’s convenience. Preferably, the loop should not meander in order to reduce its size, as this increases capacitive effects and results in low efficiency. Loop antennas pick up the magnetic component of an electromagnetic field in the HF band, unlike dipole antennas, which mainly respond to the electric component. Loop antennas are of two types: large loop antennas (or resonant antennas) and electrically small loop antennas (or magnetic antennas). The loop circumference of a resonant antenna is nearly equal to the signal wavelength to be measured. The circumference of the small loop antennas is well below the signal wavelength (in a ratio of a tenth up to a sixteenth) so that the current flowing through all the wires remains in phase. The characteristics of small loop antennas are: (i) low radiation resistance, which results in loss of power in the form of heat (this could be enhanced with a ferrite core), and (ii) low radiation efficiency due to high losses; hence, they perform better as receiving antennas at lower frequencies. Due to their closed design, loop antennas are primarily sensitive to the magnetic field and may function in near- or far-field situations depending on the circumstances [44][89]. According to Faraday’s law of induction, the electromotive force induced in a receiving loop antenna is precisely proportional to the rate of change of magnetic flux over time across the loop surface. The sensitivity of the loop antenna is a function of the sensor’s orientation. In electromagnetic waves, the magnetic and electric fields are transverse.
Loop antennas, unlike ILS, do not need to be connected parallel to the ground wire to detect PD and can operate in free space close to the equipment to be monitored. Lopez-Roldan et al. [45][91] presented a first comparison review of antennas for PD applications in oil-filled transformers, including a small loop antenna with dimensions of 25 mm × 100 mm. The scholars noticed that the loop antenna has less gain than the majority of the other tested types. Jin et al. [46][92] compared a 10-turn small loop antenna with an Mn-Zn ferrite core (relative permeability of 2000) and a diameter of 38 mm to a Hilbert fractal antenna. The loop antenna has a frequency pass band from 100 MHz to 700 MHz, while the other is from 500 MHz to 900 MHz. Both compact antennas are used for laboratory PD measurements of three typical transformer insulation faults, namely, cavity, surface, and corona discharges. The results demonstrated that both can be used effectively for PD online transformer monitoring.
3.3. VHF/UHF Antennas
The EM-radiated pulse, due to the current through the voids/impurities, propagates from the PD source, containing a combination of different frequency components up to a few GHz, and falling within the range of VHF and UHF bands. The main advantages of the radiometric detection of these PD pulses are to: (i) monitor all apparatus online; (ii) locate the site of partial discharge; and (iii) to some extent, classify the type of PD (need to have the grid frequency as a reference). However, the frequency content of signals from PDs can vary widely depending on (i) the location of the discharge, (ii) the propagation path through the apparatus, (iii) RF interference with power lines and surrounding HV equipment, and (iv) other sources of interference from telecommunications systems such as FM radio, TV broadcast, Wi-Fi, mobile telecommunications, etc., which can affect and reduce the accuracy of the on-site UHF method by passing the signal-included frequencies to tens of kHz and several MHz. Thus, incorrect monitoring information may occur due to such interference. Therefore, it is necessary to use antennas with sufficiently wide passbands (ultra-wideband—UBW) to optimize the measurement. For this reason, broadband antennas are of particular interest in partial discharge classification applications, and maximizing bandwidth while maintaining compactness will be one of the antenna design goals. Log-periodic and fractal schemes can be used to improve the bandwidth, although their size can increase substantially when they are used in the low-frequency range of the UHF band.
As shown in Figure 712, a UHF sensor is important in PD measurement since the first stage in the detection chain is to capture electromagnetic signals for subsequent signal processing utilizing these devices. Consequently, the performance of the sensors will have a significant impact on the accuracy and sensitivity of the PD detection system. UHF sensors might be considered antennas due to the nature of the detected signal, as these sensors are necessary to receive the generated EM waves from the PD source.
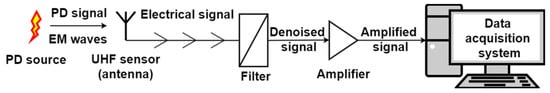
Figure 712. The principal of VHF/UHF detection [47].
3.3.1. VHF Antennas
In some circumstances, due to attenuation of the UHF components of the PD pulse due to reflection and propagation over long distances, mostly only HF and VHF components remain [48]. However, very high frequency (VHF) sensors are not very common due to their large size and indoor installation, which can be difficult and risky [13]. The VHF method typically entails detecting the VHF signal with an antenna or a window-type sensor mounted directly to the apparatus case. While UHF antennas are typically placed in equipment via oil drain valves or dielectric windows to pick up UHF signals.
The principal of VHF/UHF detection [22].
3.3.1. VHF Antennas
In some circumstances, due to attenuation of the UHF components of the PD pulse due to reflection and propagation over long distances, mostly only HF and VHF components remain [100]. However, very high frequency (VHF) sensors are not very common due to their large size and indoor installation, which can be difficult and risky [13]. The VHF method typically entails detecting the VHF signal with an antenna or a window-type sensor mounted directly to the apparatus case. While UHF antennas are typically placed in equipment via oil drain valves or dielectric windows to pick up UHF signals.
3.3.2. Wire Antennas
The simplest form of a wire antenna is the monopole antenna, which is a half-dipole antenna mounted above some sort of ground plane. Monopole antennas are extensively employed in PD detection due to their simple structure, excellent radiation pattern, and appropriate size. However, the operational bandwidth of typical monopole antennas is limited, resulting in information loss [49][104]. Various UHF wire antennas have been used to detect PD under online conditions in laboratory experiments.
3.3.3. PCB Trace Antennas
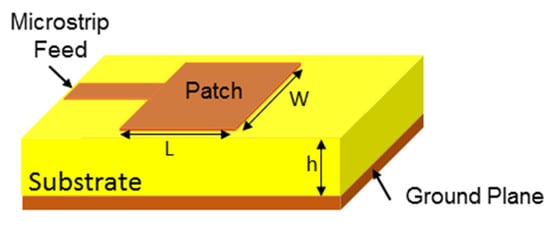
The main challenge in antenna design is to have a wide frequency bandwidth while keeping a compact size, which is difficult to achieve. Given the frequency spectrum of PDs, UHF antennas naturally need large dimensions for PD detection. As a result, in most common design methods, further miniaturization is often sought. In this regard, some researchers have attempted to miniaturize the UWB UHF antenna by implementing some hybrid design techniques of non-uniform element spacing and combinatorial cyclic different sets, such as fractal antenna design, with appropriate feeding techniques. The antennas are gaining improvements; however, it was not sufficient for UHF operating antenna designs, although some researchers used stacked layer techniques, based on multilayered substrates, and incorporated metamaterial for superstate antennas, etc., in order to increase the antenna gain, which is considered one of the most important parameters for early PD signal detection. A fractal-based antenna can be described by self-similarity in the repetition of a motif over two or more scale sizes, or iterations, to fill up a given total surface. The objective is to maximize the effective length or increase the material perimeter in order to have exceptional performance in coupling the UHF signal and to provide a broad bandwidth. Several patterns are used in fractal antenna design for PD detection, such as Hilbert, Peano, Moore, Koch, Minkowski, etc. The fractal antenna has various advantages over other types, including its ease of fabrication by etching or photolithography and its ability to be fed via 50-ohm coaxial cable in its bandwidth. The PCB-printed type of the monopole antenna, called the microstrip printed monopole antenna (PMA) or patch antenna, has also been suggested for PD detection in the UHF domain [50][116]. Figure 816 illustrates the basic construction of a microstrip antenna. This technology made great progress in the 1970s and 1980s in the field of communication devices [10]. Patch antennas are primarily used in telecommunications applications and have high gain when matched to a specific resonant frequency. By optimizing the sensor design, greater frequency bandwidth can be achieved for PD detection in a wide UHF range. Due to the key benefits of microstrip antennas, which consist of a tiny thickness, low mass, a cheap manufacturing cost, and a compact volume, this form of sensor might be a viable alternative to commercial UHF probes. However, the fundamental constraints of such an antenna are its limited bandwidth and significant ohmic and dielectric losses.Figure 816.
Basic design of the microstrip Antenna.
Spiral antennas have the shape of a two-armed spiral fed by a coplanar waveguide line [51][123]. The Archimedean spiral antenna (Figure 918a) is a type of spiral antenna. It has attracted much interest as UHF sensors for PD diagnostics due to their polarization-independent radiation pattern. Lozano-Claros et al. [51][123] examined two different types of antennas, namely a planar complex spiral antenna and a fractal tree log-periodic dipole antenna, both located on the GIS junction of two segments. The spiral antenna has a bandwidth of 300 to 700 MHz, while the dipole antenna has a bandwidth of 700 MHz to 1.5 GHz. The spiral antenna has a diameter of 19.1 cm and is made on a 2.5 mm-thick substrate. The spiral antenna was difficult to design despite its wide bandwidth, which covers the entire spectrum of PD activity. Indeed, it was difficult to determine the ideal number of turns in order to combine between the two antennas, and the assembly of the two structures required a complex design process (Figure 918b).
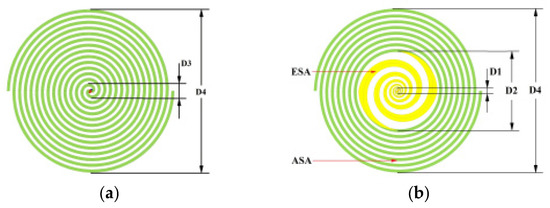
Figure 18.
The (a
) Archimedean spiral antenna, and () Planar complex spiral antenna proposed in [123].
Bowtie antennas, a subfamily of biconical antennas, are another popular option for PD detection in the UHF range [52][53][128,129]. These antennas are simple to manufacture using printable technology because of their bow tie design.
Vivaldi antennas, a subfamily of aperture antennas, are common for PD detection. This type of antenna is composed of two copper parts, one of which is separated from the other by a dielectric substrate. This antenna consists of a slot line that is embedded in a dielectric substrate. Vivaldi antennas are considered non-resonant, and by improving the slot and feeding shapes, a wide bandwidth can be achieved. If an EM signal’s wavelength is greater than the maximum slot width of the Vivaldi antenna, the latter cannot radiate effectively [54][132].