One of the most common failures or breakdowns that can occur in high-voltage (HV) equipment is due to partial discharges (PDs). This occurs as a result of inadequate insulation, aging, harsh environmental effects, or manufacturing flaws. PD detection and recognition methods have gained growing attention and have seen great progress in the past decades. Radiometric methods are one of the most investigated detection approaches due to their immunity to electromagnetic interference (EMI) and their capabilities to detect and locate PD activities in different applications such as transformers, cables, etc.
- partial discharge detection
- HV equipment diagnosis
- radiometric detection
- inductive sensors
- UHF antennas
- loop antennas
- printed antennas
1. Introduction
2. Partial Discharges Overview
2.1. PD Background and Types
A PD is a localized dielectric breakdown (that does not completely bridge the gap between the two conductors), caused by a localized electric field greater than the system’s dielectric withstand capability, of a small part of an electrical insulation system (solid, fluid, or gas). From the 1990s to the present day, much research has been carried out to investigate PDs, and intriguing publications have been published that detail the physical characteristics of the phenomenon [10][28][29]. PDs exhibit stochastic behavior over time due to the stochasticity of the delay caused by the random availability of the discharge’s starting electron and memory impacts caused by prior discharges influencing subsequent ones. Particularly once stimulated, PDs affect the characteristics of the dielectric material and leave behind residual charges trapped on the dielectric surface, which then impact the occurrence of future PDs [30][31]. However, as is well known, an insulation diagnosis is difficult to obtain because characteristics such as the magnitude and timing of the onset of the PD change stochastically. Partial discharges may be categorized into four types: internal, treeing, surface, and corona discharges, as shown in Figure 1. Internal partial discharges are the most common and are one of the leading causes of premature insulator failure in the electrical power grid. In fact, during the manufacturing process, micro air cavities may get trapped in the dielectric material, and thus, when the insulation is subjected to a high voltage stress, an unbalanced distribution is formed between the electric field present in the air microcavities and that in the surrounding dielectric layer (Figure 1a). Internal PD is a silent defect without sound, smell, or visual indication of a problem prior to failure, which makes it the most harmful. Therefore, the presence of air voids within the dielectric bulk seems to be a disruptive and dangerous source of PD phenomena. Another type of discharge that occurs in dielectrics is known as ‘treeing discharge’, so named because of its branched tree expansion path (Figure 1b). Different types of electrical trees exist, such as branch types, bush types, dendrites, spikes, bow ties, and vented trees. They can occur due to high divergent electric stress over a long period of time, initiated from mechanical defects (e.g., protrusions, cracks, physical sharp points, imperfections, etc.), gas voids, or impurities within the insulation materials. Recurring faults will cause the electrical trees to spread and lengthen due to the decomposition of organic substances forming the bulk dielectric, which will then degrade its insulating capability. Thus, electrical trees have long been considered a significant insulation hazard that, if triggered, results in a full discharge [32]. Surface discharges occur on the surface of any solid insulating material under the tangential components of the electric field (Figure 1c). This discharge, identified by crackling and the smell of ozone, is commonly seen on overhead line insulators, especially contaminated insulators, during days of high humidity. Corona discharges (CDs) occur under high voltage stress when a conductor has sharp irregularities and is exposed to air. At these sharp points, a strong enough electric field is created and causes the ionization of the air, which conducts electricity and ignites an electric arc, corroding the insulation (Figure 1d) [8][33]. Unlike other types of PD, a corona discharge is visible and usually revealed by a relatively steady glow or brush discharge in the air. Corona PD is what we often hear in outdoor switchyards, particularly when the weather is humid, and it is usually not harmful.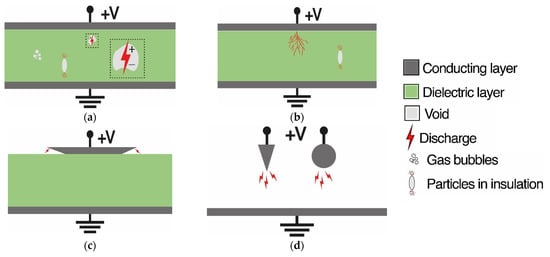
2.2. PD Patterns Representation
2.3. Offline Versus Online Measurement
2.4. Different Methods for PD Detection
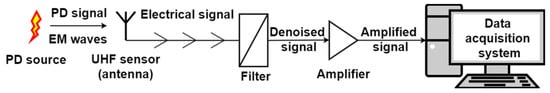
Several methods have been developed over the years, both offline and online, to detect and locate the presence of a PD based on the phenomena generated during the discharge defect. Most of these focus on wideband measurements using various types of sensors, different noise rejection techniques, pulse classification methods, and defect location and identification possibilities [46]. Table 1 describes the various PD detection techniques based on physical characteristics, such as the electrical discharge current impulses based on the IEC 60270 standard, by-products of chemical reactions, acoustic emissions (pressure waves), and electromagnetic (EM) waves or electromagnetic interference (EMI) emitted in different frequency ranges (HF, VHF, UHF, light). A brief introduction to the principle of each method as well as the sensor used will be presented thereafter.
| Method | Detection Phenomena | Applied Sensor | PD Localization | Online Monitoring | |||||
|---|---|---|---|---|---|---|---|---|---|
| Electrical method | Compensation current due to dielectric loss (current pulse from kHz to some MHz) | Coupling capacitor (IEC 60270) | [47] | Transient earth voltage (TEV) | [48] | Yes | No | ||
| Chemical method | Change of gas pressure Chemical change |
Gas chronographs High-performance liquid chromatography (HPLC) Dissolved gas analysis (DGA) | [49] | No | Yes | ||||
| Acoustic method | Mechanical pressure waves (sound) | Ultrasonic microphone (with 40 kHz center frequency) Piezoelectric sensors | [50] | Acoustic contact sensor (with detection bandwidth range 20 kHz–300 kHz) |
Yes | Yes | |||
| Electromagnetic method | Electromagnetic interference (EMI) detection (high-frequency waves) | VHF/UHF antennas | [51] | Radio/high-frequency current transformer (RFCT/HFCT) | [52] | Inductive loop sensors | [53] | Yes | Yes |
| Optical method | Optical effects (ultraviolet—visible—infrared range) | Mach–Zehnder fiber interferometers/Fabry–Perot interferometers | [54] | Infrared camera | [55] | Yes | Yes | ||
| Thermal method | Heat/high temperature | Resistance-temperature sensor (RTD) | [56] | No | Yes |
2.4.1. Conventional Detection Method: IEC 60270
2.4.1. Conventional Detection Method: IEC 60270
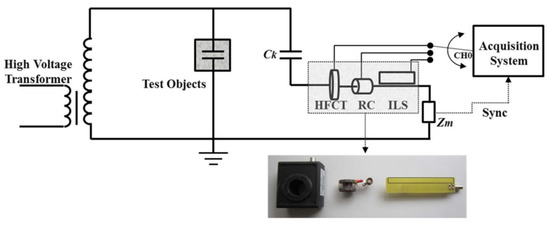
Electrical detection of PD relies on sensing the high-frequency current pulse that travels through the object’s insulating capacitance due to a flashover occurrence. The electrical method based on a coupling capacitor for PD detection as described in the IEC 60270 standard is widely established due to its accuracy and ability to detect PD levels under offline conditions. Figure 3 depicts the test circuit used for PD measurements in this approach, which consists of an HV AC source with a sufficiently low level of background noise, the test object Cx (in which the PD occurs), a coupling capacitor Cb (with low inductance design), and a measuring impedance Zm, as important circuit components. The filter unit Ze suppresses unwanted high-frequency background noise or disturbances generated by AC voltage sources. It is usually built as a large inductor because the tested object insulation system, Cx, exhibits a predominantly capacitive character. The coupling capacitor, when connected in series with the impedance Zm, creates a capacitive divider, converting the high-frequency current into a voltage signal detectable by the measuring instrument [57]. When a discharge occurs in the object under test, the coupling capacitor transfers a charge to it to compensate for the momentary collapse of the voltage across it [18]. As a result, when coupling the sense impedance Zm, the sub-1 MHz current pulse resulting from PD activity in the test object (Cx) can also be detected from the coupling capacitor branch. The coupling device serves as a measuring module from which the PD voltage signal can be extracted. Such an approach provides additional information about the test voltage, which is needed for a phase-related partial discharge (PRPD) measurement. The signal can be represented in both time and phase domains to illustrate the characteristics of the PD events. The test configuration shown in Figure 3 is appropriate for measuring PD from a test object that has a ground terminal or is connected between the HV AC source and the ground [18]. The coupling capacitor picks up and detects the PD-generated current at the test object, which has a connecting loop to the ground line through some impedance. When a discharge occurs, a transient current flows in some ns in the external circuit Zm corresponding to an amount of charge (known as the apparent charge). This pulse can be measured using the impedance Zm, often composed by a parallel RLC circuit. The inductance L strongly attenuates the low-frequency components of the measured signal, the capacitance C incorporates rapid PD pulses, and the resistance R dampens the voltage oscillations at its terminals. After calibration, this circuit measures a signal proportional to the apparent PD. Electrical measurement provides high sensitivity and is easy to execute. However, due to its high sensitivity, it is prone to problems and therefore unsuitable for the long-term monitoring of transformers.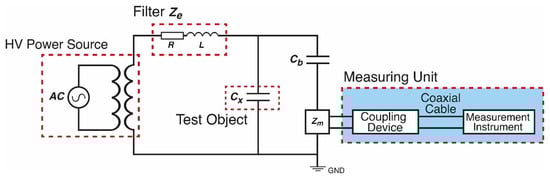
2.4.2. Radiofrequency (RF) Methods
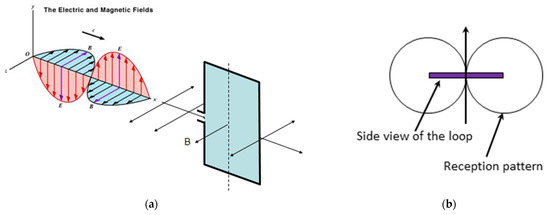
The RF approach utilizes appropriate sensors to detect and receive the electromagnetic wave generated when PD occurs. The emitted EM radiation consists of a combination of different frequency components up to a few GHz, which are classified into three bands: high-frequency (HF), very high-frequency (VHF), and ultra-high-frequency (UHF) [58]. RF-based techniques to detect PD activity have interesting characteristics because they allow noninvasive, continuous, and low-cost monitoring of PD activity. Moreover, among the various PD detection methods, they have the advantage of supporting online monitoring and allowing defect classification. Since EM waves in space consist of an electric field measured in V/m and a magnetic field measured in A/m, by using a loop antenna, the magnetic field perpendicular to the electric field can be detected separately. On the other hand, since the PD causes a high-current pulse to travel along the shield to the ground strap, inductive sensors, based on Faraday’s law of induction, are also used to measure changes in the magnetic field surrounding the ground line caused by the PD pulse. Hence, several types of sensors can be used for EM wave detection, such as UHF/VHF antennas [51], inductive sensors [59], or loop antennas [60]. The high-frequency current transformer (HFCT) is an inductive sensor clamped over the ground terminal of the HV equipment that may measure HF signals (3–30 MHz). However, the result can only suggest the presence of PD defects without pinpointing their precise position. On the other hand, the UHF method is widely used for online monitoring of PD sources due to its noise immunity and localization efficiency [61]. The UHF method has a high signal-to-noise ratio thanks to its measurement frequency range of 300 MHz–3 GHz [10], which is superior to electromagnetic interference from corona discharge in the surrounding environment. Various RF approaches have been studied, developed, and applied to PD measurement, location, and processing techniques for different configurations in order to obtain precise diagnoses [46].2.4.3. Non-Electrical Methods
Besides RF detection, other unconventional methods rely on other physical phenomena associated with PD events, such as light waves, chemical by-products, acoustic signals, local temperature rises, etc. Optical sensing is undertaken by placing an optical sensor close to the power equipment. It is based on the detection of light generated as a result of the ionization, excitation, and recombination processes that take place during the discharge. However, the optical spectrum of various discharge types is not the same. The insulating medium (gaseous, liquid, or solid) and other factors (temperature, pressure, etc.) affect the amount of light emitted and its wavelength. As a result, the surrounding medium and the intensity of the discharge affect the spectrum of light emitted by PD. The optical spectrum extends from ultraviolet in the visible range to infrared (Figure 4) [62]. The competitive advantage of this method is its immunity to electromagnetic interference (EMI). However, a significant limitation is its low sensitivity, which is excessively affected by internal barriers within the equipment, which causes light reflection, scattering, and attenuation [8]. Another drawback is the high cost of optical sensors, which still require improvement.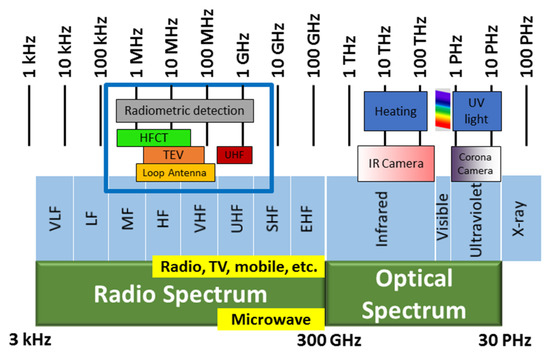
3. Radiometric Sensors for PD Detection
3.1. Inductive Sensors
Inductive sensors, which are suitable for detecting the PD mainly in the HF band, are detailed afterward
3.1.1. High-Frequency Current Transformer (HFCT)
The HFCT sensor is a high-frequency current transformer designed specifically for picking up partial discharge signals, predominantly in power cables. It consists mainly of an electrical wire (the secondary) wound around a toroidal, soft ferrite core (Figure 5a). The toroid is clamped around the earth sheath (the primary), through which pulse-shaped noise interferences (PD pulses) pass (Figure 5b). This transient current signal in the power cable excites a magnetic field that will be concentrated and confined in the toroidal core. This magnetic flux induces a corresponding voltage in the secondary winding of the HFCT, which can be measured at the output of the sensor [73]. HFCT sensors often have a ferrite split core, which makes them easy to install and allows them to be retrofitted to earth straps without disconnection. The measuring frequency range for this type of sensor is 30 kHz–30 MHz, which covers the HF band. Indeed, ferrite cores are widely accessible in the required frequency range, making the production of high-quality HFCT sensors simple and affordable. Certainly, a higher cutoff frequency would ensure faithful rendering of fast transients. The equivalent circuit model of the sensor is illustrated in Figure 5c.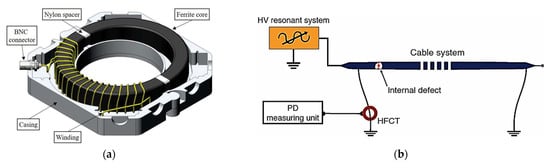
3.1.2. Rogowski Coil (RC)
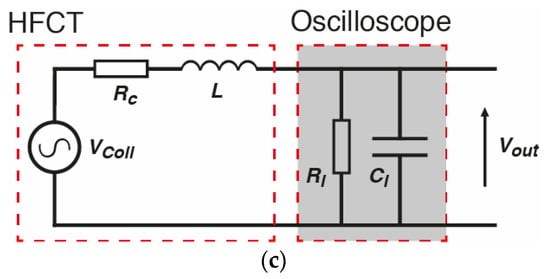
HFCT sensors are excellent for measuring PD pulses but are made of expensive ferromagnetic materials, which can become saturated when coupled to high voltage wires on one side, and can handle up to 50 MHz in flux lines on the other. As an alternative, the Rogowski coil (RC), named after Walter Rogowski, is an electrical device that has been employed for around a century for measuring alternating and impulse currents. It consists of a helical coil, of which the wire from one end returns through the center of the helical to join the first end so that the two terminals of the coil are at the same side [21][77]. RC is similar to HFCT but without a magnetic core; hence the term “air-cored coil”. Depending on the type of construction, the smallest currents with rise times in the nanosecond range or the largest power-frequency short-circuit currents can be measured. The coil is constructed using a helical winding wound on a non-magnetic toroidal solid core. The return wire is passed through the torus to have both ends on the same side for even easier installation rather than a split-core current transformer and to cancel out unnecessary electromagnetic fields. Indeed, any axial magnetic flux will induce voltages in both the central conductor and the helical winding turns. If the diameter of the toroidal winding is small enough compared to the major torus diameter, the induced voltages from the two wires will oppose and cancel each other out. In contrast, a radial flux will not produce any voltage in the central conductor. Toroidal windings, with a relatively large pitch, can induce significant voltage. However, the radial flux must intersect these turns in the positive and negative directions, so the induced voltages almost cancel each other out. Consequently, only azimuthal magnetic flux induces significant voltages in an RC. The RC sensor operates with the same principle (Faraday’s law) as the HFCT sensor, so it senses the time derivative of the current pulses associated with PD and produces a proportional output. This variable current creates a magnetic field that connects the secondary of the coil and causes a voltage that is directly proportional to the current change in the conductor as well as the mutual inductance between the coil and the conductor [78]. Often, a passive integrator used with a Rogowski coil can provide an output signal proportional to the current passing through the toroidal opening. Common integration methods are active integration with operational amplifiers and passive integration with resistive-capacitive circuits [79]. The RC sensor has a linear characteristic due to the absence of magnetic materials. It has some notable characteristics that have attracted attention in recent years, including: (i) withstanding large overloads without damage; (ii) measuring currents over a wide range, without saturation; (iii) being easy to use, due to its flexibility and lightness; (iv) low cost; (v) non-intrusive nature (drawing no power from the main circuit); (vi) wide bandwidth, in the range of 0.1 Hz to 1 GHz (HF and VHF bands); and (vii) excellent transient response and safety (electrically isolated from the main circuit) [80]. Aside from this, RC can be influenced by nearby conductors carrying high currents because it utilizes a non-magnetic core to support the secondary windings, resulting in a weak mutual coupling between the primary and secondary windings. Due to this issue, identifying the proper number of RC turns should be one of the solutions to determining and optimizing sensitivity. A higher number of turns causes an increase in inductance, which in turn will decrease the resonant frequency. The RC is designed for PD detection and measurement at high frequencies ranging from tens to hundreds of MHz.
3.1.3. Inductive Loop Sensor (ILS)
An effective PD sensor should be compact and easy to install, sensitive to tens of pC of PD level, and have high saturation performance. Another simple, low-cost air-cored inductive coupling sensor capable of measuring PD pulses with simple distributed parameter models with high-frequency and high saturation performance can be used. The loop inductive sensor (ILS), consists of a single conductive rectangular loop printed on a circuit board and placed parallel to the line that conducts the PD pulse stream (in series with the coupling capacitor). Like HFCT and RC sensors, ILSs are based on Faraday’s law and measure the voltage induced in a loop through the change in the magnetic field caused by the PD pulse. Hence, the magnetic flux through the surface of the loop induces a voltage proportional to the derivative of the primary current, which depends on the geometry of the turn and its separation from the primary conductor (Figure 8). It has been experimentally proven that these sensors are able to monitor various forms of PD from the ground line leakage current. The use of ILS sensors is very limited since a fixed separation distance of 1 mm from the primary conductor must be respected. This restricts the use of these sensors with real apparatus, such as generators and transformers, as there is no easy access to ensure galvanic coupling.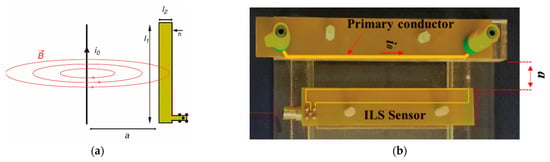
3.2. Loop Antennas
3.3. VHF/UHF Antennas
3.3.1. VHF Antennas
3.3.2. Wire Antennas
The simplest form of a wire antenna is the monopole antenna, which is a half-dipole antenna mounted above some sort of ground plane. Monopole antennas are extensively employed in PD detection due to their simple structure, excellent radiation pattern, and appropriate size. However, the operational bandwidth of typical monopole antennas is limited, resulting in information loss [103]. Various UHF wire antennas have been used to detect PD under online conditions in laboratory experiments. Albarracin et al. [105] presented a monopole antenna used in a transformer tank for PD diagnostics. The designed antenna had a size of less than 10 cm (Figure 14b), which was below the diameter of the dielectric windows of the power transformer enclosure (the oil drain valve). The experiment was carried out in both positions inside and outside the transformer tank (Figure 14c). The monopole antenna was used for picking up background noise and PD signal detection. Based on modeling and testing results, the antenna with the smallest size had the maximum sensitivity for PD activities compared to larger antennas. However, based on the SNR, inception voltage, and signal classification rate, it was concluded that the monopole antenna was capable of capturing PD from anywhere near the transformer tank. It was concluded that the PD source and the enclosure resonance modes are the main factors to be considered in PD acquisitions with UHF monopole sensors.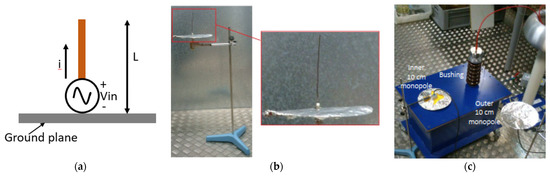
3.3.3. PCB Trace Antennas
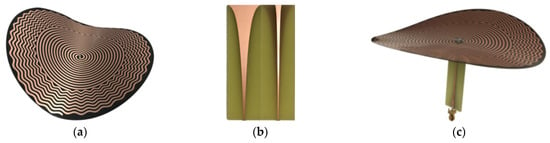
The main challenge in antenna design is to have a wide frequency bandwidth while keeping a compact size, which is difficult to achieve. Given the frequency spectrum of PDs, UHF antennas naturally need large dimensions for PD detection. As a result, in most common design methods, further miniaturization is often sought. In this regard, some researchers have attempted to miniaturize the UWB UHF antenna by implementing some hybrid design techniques of non-uniform element spacing and combinatorial cyclic different sets, such as fractal antenna design, with appropriate feeding techniques. The antennas are gaining improvements; however, it was not sufficient for UHF operating antenna designs, although some researchers used stacked layer techniques, based on multilayered substrates, and incorporated metamaterial for superstate antennas, etc., in order to increase the antenna gain, which is considered one of the most important parameters for early PD signal detection. (a) Fractal antennas A fractal-based antenna can be described by self-similarity in the repetition of a motif over two or more scale sizes, or iterations, to fill up a given total surface. The objective is to maximize the effective length or increase the material perimeter in order to have exceptional performance in coupling the UHF signal and to provide a broad bandwidth. Several patterns are used in fractal antenna design for PD detection, such as Hilbert, Peano, Moore, Koch, Minkowski, etc. The fractal antenna has various advantages over other types, including its ease of fabrication by etching or photolithography and its ability to be fed via 50-ohm coaxial cable in its bandwidth. Hilbert’s fractal antenna has been introduced by referring to the fractal curve of Hilbert, which is a continuous curve with tight self-similarity for optimal space filling. If the order of the curve increases, the length of the fractal Hilbert curve should increase. Figure 15a shows third- and fourth-order Hilbert fractal antennas. It has been found that a fourth-order Hilbert fractal antenna (Figure 15b) plays the same role as a multiple multi-resonance circuit [106].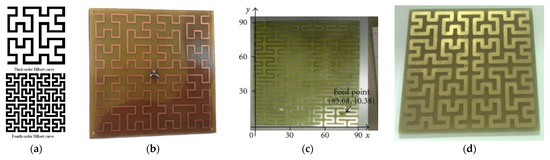
- (d)
-
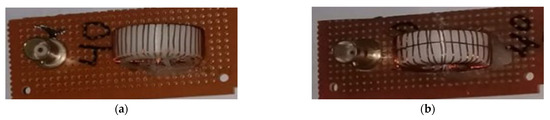
Biconical antennasBowtie antennas, a subfamily of biconical antennas, are another popular option for PD detection in the UHF range [127][128]. These antennas are simple to manufacture using printable technology because of their bow tie design. Daulay and Khayam [129] proposed a series of dual-layer bowtie antennas with edge and middle sliced modifications for detecting PDs (Figure 21a). The antenna, which measured 160 × 54 mm2 and was built on a 1.6 mm-thick FR4 board, had a return loss of 10 dB and a VSWR of 2. Real-world PD tests were not performed. Uwiringiyimana and Khayam [130] designed a double-layer bowtie antenna by modifying the wings’ shape (Figure 21b) for corona PD measurement. The bowtie antenna was tested and compared with a conventional RC detector. Since the antenna’s bandwidth included several communication bands as background noise while excluding the region where PD occurs most frequently, the antenna’s ability to detect PD signals was limited.
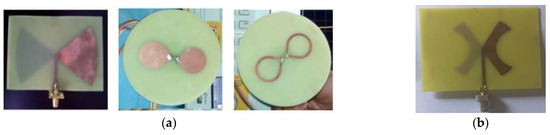 Figure 21. (a) A series of double-layer bowtie antennas with edge and middle sliced modifications a top view studied in [129], and (b) The double-layer bowtie antenna studied in [128].
- (e)
-
Aperture AntennasVivaldi antennas, a subfamily of aperture antennas, are common for PD detection. This type of antenna is composed of two copper parts, one of which is separated from the other by a dielectric substrate. This antenna consists of a slot line that is embedded in a dielectric substrate. Vivaldi antennas are considered non-resonant, and by improving the slot and feeding shapes, a wide bandwidth can be achieved. If an EM signal’s wavelength is greater than the maximum slot width of the Vivaldi antenna, the latter cannot radiate effectively [131]. Depending on the feeding mode, there are three types of Vivaldi antennas: antipodal, normal, and balanced. Vivaldi antennas can detect EM pulses with a low-frequency component generated from corona and surface PDs, although they are designed for high frequencies. Therefore, these antennas are susceptible to interference with FM radio and low-frequency television broadcasts. Zhang et al. [131] suggested an antipodal Vivaldi antenna (Figure 22a). The latter, which was designed on a Teflon substrate instead of the more common FR4 substrate, makes a justifiable argument by claiming that FR-4 struggles to keep the doping concentrations of different manufacturers under control. The FR-4 substrate had good performance below 1 GHz, but due to its high dielectric loss above this frequency, the antenna gain became low, which is undesirable for early PD detection. Saleh et al. [132] proposed a compact UWB Vivaldi conical slot antenna (Figure 22b).
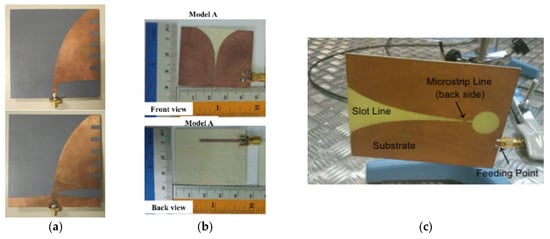 Figure 22. Aperture antennas: (a) antipodal Vivaldi antenna used in [131], (b) compact UWB Vivaldi tapered slot antenna [132], and (c) Vivaldi antenna studied in [133].Albarracin et al. [133] proposed a Vivaldi antenna with a bandwidth ranging from 1.3 to 3.0 GHz (Figure 22c). Although this also contained communication noises, the antenna was not naturally able to separate. Results showed that at a distance of 1 m and by turning on only the Wi-Fi signals, PD pulses were detected in a noisy environment. As has already been noted, antennae with bowtie, spiral, and Vivaldi shape designs typically experience complicated construction, particularly because they require sophisticated balun-based feeding methods. In order to diagnose PD, Vivaldi antennas face integration challenges with electrical equipment.Table 2summarizes all the UHF antennas used for PD detection described in the paper, along with their performance.
Antenna Type Pattern Type Physical Size VSWR Bandwidth Application Test Ref. Fractal antennas Hilbert 110 mm <2 0.8–2 GHz PD model [105] Peano 90 mm <5 0.3–1 GHz PD model [106][107] Moore 65 mm <2 0.3–3 GHz GIS [108] Hilbert 100 mm <5 0.3–1 GHz Transformer [110] Hilbert 100 mm - 0.1–3 GHz PD model [111] Hilbert 105 mm - 0.3–3 GHz - [112] Meander 70 mm <2 0.3–1 GHz Transformer [109] Hilbert 80 mm <2 0.3–4 GHz PD model [113] Minkowski 300 mm - 0.7–3 GHz Transformer [114] Hilbert 100 mm - 0.3–3 GHz PD model [134] Microstrip antennas Monopole 100 mm - 0.5–2.5 GHz Transformer [104] Squared 232 mm - 0.35–0.8 GHz High-voltage equipment [116] Circular 320 mm - 0.3–1.5 GHz PD model [117] U-shaped 215 mm - 0.5–1.5 GHz High-voltage switchgears [119] Microstrip 105 mm <2 0.5–1.5 GHz - [120] Microstrip patch 100 mm <2 1.2–4.5 GHz PD model [121] Microstrip patch 100 mm <2 1.18–3 GHz Transformer [135] Conical 100 mm <5 0.6–3 GHz Transformer [136] Circular 100 mm <2 1.2–3 GHz Transformer [137] Koch Snowflake 280 mm <5 0.3–1 GHz High-voltage switchgears [138] Spiral antennas planar complex 191 mm ≤2 0.3–3 GHz GIS [122] Archimedean 190 mm - 0.6–1.7 GHz - [123] cavity-backed cosine slot 70 mm - 0.5–5 GHz PD model [124] Two Arm equiangular 150 mm - 0.7–3 GHz GIS [125] Archimedean 198 mm ≤2 0.61–3 GHz High-voltage switchgears [126] Single Arm 200 mm - 1.15–2.4 GHz Transformer [139] Biconical antennas Asymmetric biconical 150 mm/
95 mm<2 0.47–3 GHz Power substation [46] Long bowtie 60 mm ≤2 0.8–1.06 GHz/
2.01–2.63 GHzGIS [127] Bowtie 100 mm <2 782 MHz GIS [128] Double layer bowtie 36 mm <2 1.576–2.1 GHz PD model [130] Aperture antennas Antipodal Vivaldi 100 mm - 0.8–3 GHz Transformer [131] Tapered Slot 270 mm - 3.1–10.6 GHz - [132] Vivaldi 120 mm - 1.3–3 GHz PD model [133]
4. Conclusions
References
- Liao, Y.; Liu, H.; Yuan, J.; Xu, Y.; Zhou, W.; Zhou, C. A holistic approach to risk-based maintenance scheduling for HV cables. IEEE Access 2019, 7, 118975–118985.
- Montanari, G.C.; Mazzanti, G. Ageing of polymeric insulating materials and insulation system design. Polym. Int. 2002, 51, 1151–1158.
- Afia, R.S.; Mustafa, E.; Tamus, Z.Á. Aging Assessment of XLPE/CSPE LV Nuclear Power Cables Under Simultaneous Radiation-Mechanical Stresses. Energy Rep. 2022, 8, 1028–1037.
- Gjerde, A. Multifactor ageing models-origin and similarities. IEEE Electr. Insul. Mag. 1997, 13, 6–13.
- Morshuis, P.H.F. Partial Discharge Mechanisms: Mechanisms Leading to Breakdown, Analyzed by Fast Electrical and Optical Measurements. Ph.D. Thesis, Delft University of Technology, Delft, The Netherlands, 1993.
- Ardila-Rey, J.A.; Cerda-Luna, M.P.; Rozas-Valderrama, R.A.; De Castro, B.A.; Andreoli, A.L.; Muhammad-Sukki, F. Separation techniques of partial discharges and electrical noise sources: A review of recent progress. IEEE Access 2020, 8, 199449–199461.
- Morshuis, P.H. Degradation of solid dielectrics due to internal partial discharge: Some thoughts on progress made and where to go now. IEEE Trans. Dielectr. Electr. Insul. 2005, 12, 905–913.
- Niemeyer, L. A generalized approach to partial discharge modeling. IEEE Trans. Dielectr. Electr. Insul. 1995, 2, 510–528.
- Moradnouri, A.; Vakilian, M.; Hekmati, A.; Fardmanesh, M. HTS transformer’s partial discharges raised by floating particles and nitrogen bubbles. J. Supercond. Nov. Magn. 2020, 33, 3027–3034.
- Kreuger, F.; Gulski, E.; Krivda, A. Classification of partial discharges. IEEE Trans. Electr. Insul. 1993, 28, 917–931.
- Cavallini, A.; Montanari, G.; Puletti, F.; Contin, A. A new methodology for the identification of PD in electrical apparatus: Properties and applications. IEEE Trans. Dielectr. Electr. Insul. 2005, 12, 203–215.
- Wu, M.; Cao, H.; Cao, J.; Nguyen, H.-L.; Gomes, J.B.; Krishnaswamy, S.P. An overview of state-of-the-art partial discharge analysis techniques for condition monitoring. IEEE Electr. Insul. Mag. 2015, 31, 22–35.
- Lu, S.; Chai, H.; Sahoo, A.; Phung, B. Condition monitoring based on partial discharge diagnostics using machine learning methods: A comprehensive state-of-the-art review. IEEE Trans. Dielectr. Electr. Insul. 2020, 27, 1861–1888.
- Biswas, S.; Koley, C.; Chatterjee, B.; Chakravorti, S. A methodology for identification and localization of partial discharge sources using optical sensors. IEEE Trans. Dielectr. Electr. Insul. 2012, 19, 18–28.
- Duval, M. A review of faults detectable by gas-in-oil analysis in transformers. IEEE Electr. Insul. Mag. 2002, 18, 8–17.
- Descoeudres, A.; Hollenstein, C.; Demellayer, R.; Wälder, G. Optical emission spectroscopy of electrical discharge machining plasma. J. Phys. D Appl. Phys. 2004, 37, 875.
- Ilkhechi, H.D.; Samimi, M.H. Applications of the acoustic method in partial discharge measurement: A review. IEEE Trans. Dielectr. Electr. Insul. 2021, 28, 42–51.
- Morsalin, S.; Das, N. Diagnostic aspects of partial discharge measurement at very low frequency: A review. IET Sci. Meas. Technol. 2020, 14, 825–841.
- Rostaminia, R.; Saniei, M.; Vakilian, M.; Mortazavi, S.S. Evaluation of transformer core contribution to partial discharge electromagnetic waves propagation. Int. J. Electr. Power Energy Syst. 2016, 83, 40–48.
- Upton, D.W.; Mistry, K.K.; Mather, P.J.; Zaharis, Z.D.; Atkinson, R.C.; Tachtatzis, C.; Lazaridis, P.I. A review of techniques for RSS-based radiometric partial discharge localization. Sensors 2021, 21, 909.
- Samimi, M.H.; Mahari, A.; Farahnakian, M.A.; Mohseni, H. The Rogowski coil principles and applications: A review. IEEE Sens. J. 2014, 15, 651–658.
- Chai, H.; Phung, B.T.; Mitchell, S. Application of UHF sensors in power system equipment for partial discharge detection: A review. Sensors 2019, 19, 1029.
- Roslizan, N.; Rohani, M.; Wooi, C.; Isa, M.; Ismail, B.; Rosmi, A.; Mustafa, W. A review: Partial discharge detection using UHF sensor on high voltage equipment. J. Phys. Conf. Ser. 2020, 1432, 012003.
- Hikita, M.; Ohtsuka, S.; Matsumoto, S. Recent trend of the partial discharge measurement technique using the UHF electromagnetic wave detection method. IEEJ Trans. Electr. Electron. Eng. 2007, 2, 504–509.
- Tenbohlen, S.; Beura, C.P.; Sikorski, W.; Sánchez, R.A.; de Castro, B.A.; Beltle, M.; Fehlmann, P.; Judd, M.; Werner, F.; Siegel, M. Frequency Range of UHF PD Measurements in Power Transformers. Energies 2023, 16, 1395.
- Mondal, M.; Kumbhar, G.B. Detection, measurement, and classification of partial discharge in a power transformer: Methods, trends, and future research. IETE Tech. Rev. 2018, 35, 483–493.
- Mondal, M.; Kumbhar, G.B. Partial discharge localization in a power transformer: Methods, trends, and future research. IETE Tech. Rev. 2017, 34, 504–513.
- Bartnikas, R. Detection of partial discharges (corona) in electrical apparatus. IEEE Trans. Electr. Insul. 1990, 25, 111–124.
- Bartnikas, R. Partial discharges. Their mechanism, detection and measurement. IEEE Trans. Dielectr. Electr. Insul. 2002, 9, 763–808.
- Pan, C.; Wu, K.; Chen, G.; Gao, Y.; Florkowski, M.; Lv, Z.; Tang, J. Understanding partial discharge behavior from the memory effect induced by residual charges: A review. IEEE Trans. Dielectr. Electr. Insul. 2020, 27, 1951–1965.
- Van Brunt, R.J.; Cernyar, E.; Von Glahn, P. Importance of unraveling memory propagation effects in interpreting data on partial discharge statistics. IEEE Trans. Electr. Insul. 1993, 28, 905–916.
- Dissado, L.A. Understanding electrical trees in solids: From experiment to theory. IEEE Trans. Dielectr. Electr. Insul. 2002, 9, 483–497.
- Stone, G.; Boulter, E.A.; Culbert, I.; Dhirani, H. Electrical Insulation for Rotating Machines: Design, Evaluation, Aging, Testing, and Repair; Wiley-IEEE Press: Hoboken, NJ, USA, 2004.
- Kreuger, F.H. Detection and Location of Discharges. Ph.D. Thesis, Technische Universiteit Delft, Delft, The Nederland, 1961.
- Gulski, E. Computer-Aided Recognition of Partial Dicharges Using Statistical Tools. Ph.D. Thesis, Delft University Press, Delft, The Netherlands, 1991.
- Contin, A.; Montanari, G.; Ferraro, C. PD source recognition by Weibull processing of pulse height distributions. IEEE Trans. Dielectr. Electr. Insul. 2000, 7, 48–58.
- Basharan, V.; Siluvairaj, W.I.M.; Velayutham, M.R. Recognition of multiple partial discharge patterns by multi-class support vector machine using fractal image processing technique. IET Sci. Meas. Technol. 2018, 12, 1031–1038.
- Sahoo, N.; Salama, M.; Bartnikas, R. Trends in partial discharge pattern classification: A survey. IEEE Trans. Dielectr. Electr. Insul. 2005, 12, 248–264.
- Romano, P.; Imburgia, A.; Ala, G. Partial discharge detection using a spherical electromagnetic sensor. Sensors 2019, 19, 1014.
- Peng, X.; Yang, F.; Wang, G.; Wu, Y.; Li, L.; Li, Z.; Bhatti, A.A.; Zhou, C.; Hepburn, D.M.; Reid, A.J.; et al. A Convolutional Neural Network-Based Deep Learning Methodology for Recognition of Partial Discharge Patterns from High-Voltage Cables. IEEE Trans. Power Deliv. 2019, 34, 1460–1469.
- Barrios, S.; Buldain, D.; Comech, M.P.; Gilbert, I.; Orue, I. Partial discharge classification using deep learning methods—Survey of recent progress. Energies 2019, 12, 2485.
- Cavallini, A.; Montanari, G.; Contin, A.; Pulletti, F. A new approach to the diagnosis of solid insulation systems based on PD signal inference. IEEE Electr. Insul. Mag. 2003, 19, 23–30.
- Hirata, A.; Nakata, S.; Kawasaki, Z.-I. Toward automatic classification of partial discharge sources with neural networks. IEEE Trans. Power Deliv. 2005, 21, 526–527.
- Gulski, E.; Krivda, A. Neural networks as a tool for recognition of partial discharges. IEEE Trans. Electr. Insul. 1993, 28, 984–1001.
- IEEE. Guide for Partial Discharge Testing of Shielded Power Cable Systems in a Field Environment; IEEE: New York, NY, USA, 2007.
- Hu, Y.; Zeng, Z.; Liu, J.; Wang, J.; Zhang, W. Design of a distributed UHF sensor array system for PD detection and location in substation. IEEE Trans. Instrum. Meas. 2019, 68, 1844–1851.
- IEC-60270; High-Voltage Test Techniques: Partial Discharge Measurements. IEC: Geneva, Switzerland, 2000; pp. 13–31.
- Cheng, C.; Fan, C.-L.; Hsiao, H.-C.; Wang, W.-M. On-site partial discharge measurement of uderground cable system. In Proceedings of the 2011 7th Asia-Pacific International Conference on Lightning, Chengdu, China, 1–4 November 2011; pp. 575–580.
- Bakar, N.A.; Abu-Siada, A.; Islam, S. A review of dissolved gas analysis measurement and interpretation techniques. IEEE Electr. Insul. Mag. 2014, 30, 39–49.
- Danouj, B.; Tahan, S.; David, E. Using a new generation of piezoelectric sensors for partial discharge detection. Measurement 2013, 46, 660–666.
- Zhang, Y.; Glover, I. Design of an ultrawideband VHF/UHF antenna for partial discharge detection. In Proceedings of the 2014 IEEE International Conference on Signal Processing, Communications and Computing (ICSPCC), Guilin, China, 5–8 August 2014; pp. 487–490.
- Mor, A.R.; Heredia, L.C.C.; Muñoz, F.A. A novel approach for partial discharge measurements on GIS using HFCT sensors. Sensors 2018, 18, 4482.
- Kaziz, S.; Imburgia, A.; Flandre, D.; Rizzo, G.; Romano, P.; Viola, F.; Ala, G.; Tounsi, F. Performances of a PCB-based Loop Antenna Inductive Sensor for Partial Discharges Detection. In Proceedings of the 2022 IEEE 4th International Conference on Dielectrics (ICD), Palermo, Italy, 3–7 July 2022; pp. 9–12.
- Wang, X.; Li, B.; Xiao, Z.; Lee, S.H.; Roman, H.; Russo, O.L.; Chin, K.K.; Farmer, K.R. An ultra-sensitive optical MEMS sensor for partial discharge detection. J. Micromechan. Microeng. 2004, 15, 521.
- Salustiano, R.; Capelini, R.; De Abreu, S.; Martinez, M.; Tavares, I.; Ferraz, G.; Romano, M. Development of new methodology for insulators inspections on aerial distribution lines based on partial discharge detection tools. In Proceedings of the 2014 ICHVE International Conference on High Voltage Engineering and Application, Poznan, Poland, 8–11 September 2014; pp. 1–4.
- Kanegami, M.; Miyazaki, S.; Miyake, K. Partial Discharge Detection with High-Frequency Band through Resistance-Temperature Sensor of Hydropower Generator Stator Windings. Electr. Eng. Jpn. 2016, 195, 9–15.
- Kindl, V.; Skala, B.; Pechanek, R.; Kus, V.; Hornak, J. Low-pass filter for HV partial discharge testing. Sensors 2018, 18, 482.
- Kaziz, S.; Romano, P.; Imburgia, A.; Ala, G.; Sghaier, H.; Flandre, D.; Tounsi, F. PCB-Based Planar Inductive Loops for Partial Discharges Detection in Power Cables. Sensors 2023, 23, 290.
- Robles, G.; Martinez-Tarifa, J.M.; Rojas-Moreno, M.V.; Sanz-Feito, J. Inductive sensor for measuring high frequency partial discharges within electrical insulation. IEEE Trans. Instrum. Meas. 2009, 58, 3907–3913.
- Rozi, F.; Khayam, U. Development of loop antennas for partial discharge detection. Int. J. Electr. Eng. Inform. 2015, 7, 29.
- Azam, S.K.; Othman, M.; Illias, H.A.; Latef, T.A.; Islam, M.T.; Ain, M.F. Ultra-high frequency printable antennas for partial discharge diagnostics in high voltage equipment. Alex. Eng. J. 2023, 64, 709–729.
- Schwarz, R.; Muhr, M. Modern technologies in optical partial discharge detection. In Proceedings of the 2007 Annual Report-Conference on Electrical Insulation and Dielectric Phenomena, Vancouver, BC, Canada, 14–17 October 2007; pp. 163–166.
- Wang, Z.; Cotton, I. Northcote, and others, Dissolved gas analysis of alternative fluids for power transformers. IEEE Electr. Insul. Mag. 2007, 23, 5–14.
- Qian, S.; Chen, H.; Xu, Y.; Su, L. High sensitivity detection of partial discharge acoustic emission within power transformer by sagnac fiber optic sensor. IEEE Trans. Dielectr. Electr. Insul. 2018, 25, 2313–2320.
- Chelmiah, E.T.; Kavanagh, D.F. Acoustic Sensor Array Topologies for Partial Discharge Localisation in Electric Machines. In Proceedings of the 2022 International Conference on Electrical Machines (ICEM), Valencia, Spain, 5–8 September 2022; pp. 1582–1588.
- BúaNúñez, I.; Posada-Román, J.E.; Rubio-Serrano, J.; Garcia-Souto, J.A. Instrumentation system for location of partial discharges using acoustic detection with piezoelectric transducers and optical fiber sensors. IEEE Trans. Instrum. Meas. 2013, 63, 1002–1013.
- Liu, B.; Ma, H.; Ju, P. Partial discharge diagnosis by simultaneous observation of discharge pulses and vibration signal. IEEE Trans. Dielectr. Electr. Insul. 2017, 24, 288–295.
- Posada-Roman, J.; Garcia-Souto, J.A.; Rubio-Serrano, J. Fiber optic sensor for acoustic detection of partial discharges in oil-paper insulated electrical systems. Sensors 2012, 12, 4793–4802.
- Zhou, H.-Y.; Ma, G.-M.; Zhang, M.; Zhang, H.-C.; Li, C.-R. A high sensitivity optical fiber interferometer sensor for acoustic emission detection of partial discharge in power transformer. IEEE Sens. J. 2019, 21, 24–32.
- Campbell, S.; Stone, G. Investigations into the use of temperature detectors as stator winding partial discharge detectors. In Proceedings of the Conference Record of the 2006 IEEE International Symposium on Electrical Insulation, Toronto, ON, Canada, 11–14 June 2006; pp. 369–375.
- Hampton, B.; Meats, R. Diagnostic measurements at UHF in gas insulated substations. IEE Proc. C Gener. Transm. Distrib. 1988, 135, 137–144.
- Ahmed, N.; Srinivas, N. On-line partial discharge detection in cables. IEEE Trans. Dielectr. Electr. Insul. 1998, 5, 181–188.
- Fritsch, M.; Wolter, M. High-Frequency Current Transformer Design and Construction Guide. IEEE Trans. Instrum. Meas. 2022, 71, 1–9.
- Zachariades, C.; Shuttleworth, R.; Giussani, R.; MacKinlay, R. Optimization of a high-frequency current transformer sensor for partial discharge detection using finite-element analysis. IEEE Sens. J. 2016, 16, 7526–7533.
- Álvarez, F.; Garnacho, F.; Ortego, J.; Sánchez-Urán, M.Á. Application of HFCT and UHF sensors in on-line partial discharge measurements for insulation diagnosis of high voltage equipment. Sensors 2015, 15, 7360–7387.
- Luo, G.; Zhang, D. Study on performance of HFCT and UHF sensors in partial discharge detection. In Proceedings of the 2010 Conference Proceedings IPEC, Singapore, 27–29 October 2010; pp. 630–635.
- Paulus, S.; Kammerer, J.-B.; Pascal, J.; Bona, C.; Hebrard, L. Continuous calibration of Rogowski coil current transducer. Analog. Integr. Circuits Signal Process. 2016, 89, 77–88.
- Hashmi, G.M.; Lehtonen, M.; Nordman, M. Modeling and experimental verification of on-line PD detection in MV covered-conductor overhead networks. IEEE Trans. Dielectr. Electr. Insul. 2010, 17, 167–180.
- Moreno, M.V.R.; Robles, G.; Albarracin, R.; Rey, J.A.; Tarifa, J.M.M. Study on the self-integration of a Rogowski coil used in the measurement of partial discharges pulses. Electr. Eng. 2017, 99, 817–826.
- Metwally, I.A. Self-integrating Rogowski coil for high-impulse current measurement. IEEE Trans. Instrum. Meas. 2009, 59, 353–360.
- Han, R.-Y.; Wu, J.-W.; Ding, W.-D.; Jing, Y.; Zhou, H.-B.; Liu, Q.-J.; Qiu, A.-C. Hybrid PCB Rogowski coil for measurement of nanosecond-risetime pulsed current. IEEE Trans. Plasma Sci. 2015, 43, 3555–3561.
- Kumar, C.L.G.P.; Khalid, N.H.A.; Ahmad, M.H.; Nawawi, Z.; Sidik, M.A.B.; Jambak, M.I.; Kurnia, R.F.; Waldi, E.P. Development and Validation of Rogowski Coil with Commercial High Frequency Current Transformer for Partial Discharge Detection. In Proceedings of the 2018 International Conference on Electrical Engineering and Computer Science (ICECOS), Pangkal Pinang, Indonesia, 2–4 October 2018; pp. 315–320.
- Shafiq, M.; Kutt, L.; Lehtonen, M.; Nieminen, T.; Hashmi, M. Parameters identification and modeling of high-frequency current transducer for partial discharge measurements. IEEE Sens. J. 2012, 13, 1081–1091.
- Sharifinia, S.; Allahbakhshi, M.; Ghanbari, T.; Akbari, A.; Mirzaei, H.R. A New Application of Rogowski Coil Sensor for Partial Discharge Localization in Power Transformers. IEEE Sens. J. 2021, 21, 10743–10751.
- Waldi, E.P.; Lestari, A.I.; Fernandez, R.; Mulyadi, S.; Murakami, Y.; Hozumi, N. Rogowski coil sensor in the digitization process to detect partial discharge. Telecommun. Comput. Electron. Control. 2020, 18, 1062–1071.
- Liu, X.; Huang, H.; Dai, Y. Effect of frequency on the linearity of double-layer and single-layer Rogowski coils. IEEE Sens. J. 2020, 20, 9910–9918.
- Ardila-Rey, J.A.; Barrueto, A.; Zerene, A.; de Castro, B.A.; Ulson, J.A.C.; Mas’ud, A.A.; Valdivia, P. Behavior of an inductive loop sensor in the measurement of partial discharge pulses with variations in its separation from the primary conductor. Sensors 2018, 18, 2324.
- Rojas-Moreno, M.V.; Robles, G.; Mart’, J.M.; Sanz-Feito, J. Self-integrating inductive loop for measuring high frequency pulses. Rev. Sci. Instrum. 2011, 82, 085102.
- Ardila-Rey, J.A.; Montaña, J.; De Castro, B.A.; Schurch, R.; Ulson, J.A.C.; Muhammad-Sukki, F.; Bani, N.A. A comparison of inductive sensors in the characterization of partial discharges and electrical noise using the chromatic technique. Sensors 2018, 18, 1021.
- Imburgia, A.; Kaziz, S.; Romano, P.; Flandre, D.; Artale, G.; Rizzo, G.; Viola, F.; Tounsi, F.; Ala, G. Investigation of PCB-based Inductive Sensors Orientation for Corona Partial Discharge Detection. In Proceedings of the 2022 IEEE 21st Mediterranean Electrotechnical Conference (MELECON), Palermo, Italy, 14–16 June 2022; pp. 559–563.
- Lopez-Roldan, J.; Tang, T.; Gaskin, M. Optimisation of a sensor for onsite detection of partial discharges in power transformers by the UHF method. IEEE Trans. Dielectr. Electr. Insul. 2008, 15, 1634–1639.
- Jin, Z.; Sun, C.; Cheng, C.; Li, J. Two types of compact UHF antennas for partial discharge measurement. In Proceedings of the 2008 International Conference on High Voltage Engineering and Application, Chongqing, China, 19–12 November 2008; pp. 616–620.
- Widjaja, C.D.; Fahren, A.A.M.; Khayam, U.; Hidayat, S. Design of Loop Antenna as Partial Discharge Sensor on Metal-Enclosed Power Apparatus. In Proceedings of the 2020 IEEE Region 10 Symposium (TENSYMP), Dhaka, Bangladesh, 5–7 June 2020; pp. 1506–1510.
- Ye, H.-F.; Qian, Y.; Dong, Y.; Sheng, G.H.; Jiang, X.C. Development of multi-band ultra-high-frequency sensor for partial discharge monitoring based on the meandering technique. IET Sci. Meas. Technol. 2014, 8, 327–335.
- Zeidi, N.; Kaziz, S.; Said, M.H.; Rufer, L.; Cavallini, A.; Tounsi, F. Partial discharge detection with on-chip spiral inductor as a loop antenna. Rev. Sci. Instrum. 2021, 92, 094701.
- Mor, A.R.; Heredia, L.C.; Muñoz, F. A magnetic loop antenna for partial discharge measurements on GIS. Int. J. Electr. Power Energy Syst. 2020, 115, 105514.
- Rodrigo-Mor, A.; Muñoz, F.A.; Castro-Heredia, L.C. A novel antenna for partial discharge measurements in GIS based on magnetic field detection. Sensors 2019, 19, 858.
- Hussain, G.A.; Zaher, A.A.; Hummes, D.; Safdar, M.; Lehtonen, M. Hybrid sensing of internal and surface partial discharges in air-insulated medium voltage switchgear. Energies 2020, 13, 1738.
- Chen, G.; Tao, J.; Ma, Y.; Fu, H.; Liu, Y.; Zhou, Z.; Huang, C.; Guo, C. On-site portable partial discharge detection applied to power cables using HFCT and UHF methods. WSEAS Trans. Circuits Syst. 2016, 15, 83–90.
- Khan, A.A.; Malik, N.; Al-Arainy, A.; Alghuweinem, S. Investigation of attenuation characteristics of PD pulse during propagation in XLPE cable. In Proceedings of the 2013 IEEE Power & Energy Society General Meeting, Vancouver, BC, Canada, 21–25 July 2013; pp. 1–5.
- Tang, J.; Zhou, Q.; Tang, M.; Xie, Y. Study on mathematical model for VHF partial discharge of typical insulated defects in GIS. IEEE Trans. Dielectr. Electr. Insul. 2007, 14, 30–38.
- Thungsook, K.; Pattanadech, N.; Nimsanong, P.; Srinangyam, C. The Bandwidth Verification of VHF Antenna and Apply for Partial Discharge Measurement. In Proceedings of the 2022 9th International Conference on Condition Monitoring and Diagnosis (CMD), Kitakyushu, Japan, 13–18 November 2022; pp. 559–562.
- Maneerot, S.; Kando, M.; Pattanadech, N. Applying HF and VHF/UHF Partial Discharge Detection for Distribution Transformer. J. Mob. Multimed. 2019, 15, 357–376.
- Saktioto; Soerbakti, Y.; Syahputra, R.F.; Gamal, M.D.H.; Irawan, D.; Putra, E.H.; Darwis, R.S. Improvement of low-profile microstrip antenna performance by hexagonal-shaped SRR structure with DNG metamaterial characteristic as UWB application. Alex. Eng. J. 2022, 61, 4241–4252.
- Albarracin, R.; Ardila-Rey, J.A.; Masiud, A.A. On the use of monopole antennas for determining the effect of the enclosure of a power transformer tank in partial discharges electromagnetic propagation. Sensors 2016, 16, 148.
- Sikorski, W.; Szymczak, C.; Siod, K.; Polak, F. Hilbert curve fractal antenna for detection and on-line monitoring of partial discharges in power transformers. Eksploat. Niezawodn. 2018, 20, 343–351.
- Li, J.; Cheng, C.; Bao, L.; Jiang, T. Resonant frequency calculation and optimal design of peano fractal antenna for partial discharge detection. Int. J. Antennas Propag. 2012, 2012, 361517.
- Li, J.; Li, X.; Du, L.; Cao, M.; Qian, G. An intelligent sensor for the ultra-high-frequency partial discharge online monitoring of power transformers. Energies 2016, 9, 383.
- Wang, Y.; Wang, Z.; Li, J. UHF Moore fractal antennas for online GIS PD detection. IEEE Antennas Wirel. Propag. Lett. 2016, 16, 852–855.
- Li, M.; Guo, C.; Peng, Z. Design of meander antenna for UHF partial discharge detection of transformers. Sens. Transducers 2014, 171, 232.
- Li, J.; Jiang, T.; Cheng, C.; Wang, C. Hilbert fractal antenna for UHF detection of partial discharges in transformers. IEEE Trans. Dielectr. Electr. Insul. 2013, 20, 2017–2025.
- Zahed, A.H.; Harbaji, M.M.; Habboub, S.A.; AlMajidi, M.A.; Assaf, M.J.; El-Hag, A.H.; Qaddoumi, N.N. Design of hilbert fractal antenna for partial discharge detection and classification. In Proceedings of the 2015 4th International Conference on Electric Power and Energy Conversion Systems (EPECS), Sharjah, United Arab Emirates, 24–26 November 2015; pp. 1–4.
- Darmawan, M.A.; Khayam, U. Design, simulation, and fabrication of second, third, and forth order Hilbert antennas as ultra high frequency partial discharge sensor. In Proceedings of the Joint International Conference on Electric Vehicular Technology and Industrial, Mechanical, Electrical and Chemical Engineering (ICEVT\& IMECE), Surakarta, Indonesia, 4–5 November 2015; pp. 319–322.
- Salah, W.S.; Gad, A.H.; Attia, M.A.; Eldebeikey, S.M.; Salama, A.R. Design of a compact ultra-high frequency antenna for partial discharge detection in oil immersed power transformers. Ain Shams Eng. J. 2022, 13, 101568.
- Wang, F.; Bin, F.; Sun, Q.; Fan, J.; Liang, F.; Xiao, X. A novel uhf m inkowski fractal antenna for partial discharge detection. Microw. Opt. Technol. Lett. 2017, 59, 1812–1819.
- Ediriweera, W.; Priyanayana, K.; Rajakaruna, R.; Ranasinghe, R.; Lucas, J.; Samarasinghe, R. Microstrip Patch Antenna for Partial Discharge detection as a condition monitoring tool of power system assets. In Proceedings of the 2017 Moratuwa Engineering Research Conference (MERCon), Moratuwa, Sri Lanka, 29–31 May 2017; pp. 368–372.
- Sarkar, B.; Mishra, D.; Koley, C.; Roy, N. Microstrip patch antenna based UHF sensor for detection of partial discharge in high voltage electrical equipments. In Proceedings of the 2014 Annual IEEE India Conference (INDICON), Pune, India, 11–13 December 2014; pp. 1–6.
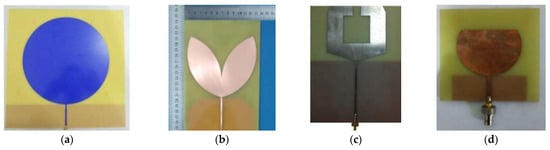
- Xavier, G.V.; da Costa, E.G.; Serres, A.J.; Nobrega, L.A.; Oliveira, A.C.; Sousa, H.F. Design and application of a circular printed monopole antenna in partial discharge detection. IEEE Sens. J. 2019, 19, 3718–3725.
- Cruz, J.N.; Serres, A.J.R.; de Oliveira, A.C.; Xavier, G.V.R.; de Albuquerque, C.C.R.; da Costa, E.G.; Freire, R.C.S. Bio-inspired printed monopole antenna applied to partial discharge detection. Sensors 2019, 19, 628.
- Yang, F.; Peng, C.; Yang, Q.; Luo, H.; Ullah, I.; Yang, Y. An UWB printed antenna for partial discharge UHF detection in high voltage switchgears. Prog. Electromagn. Res. C 2016, 69, 105–114.
- Luo, H.; Cheng, P.; Liu, H.; Kang, K.; Yang, F.; Liu, K. Research on the UHF microstrip antenna for partial discharge detection in high voltage switchgear. In Proceedings of the 2016 IEEE 11th Conference on Industrial Electronics and Applications (ICIEA), Hefei, China, 5–7 June 2016; pp. 2273–2276.
- Uwiringiyimana, J.P.; Khayam, U.; Suwarno; Montanari, G.C. Design and Implementation of Ultra-Wide Band Antenna for Partial Discharge Detection in High Voltage Power Equipment. IEEE Access 2022, 10, 10983–10994.
- Lozano-Claros, D.; Custovic, E.; Elton, D. Two planar antennas for detection of partial discharge in gas-insulated switchgear (GIS). In Proceedings of the 2015 IEEE International Conference on Communication, Networks and Satellite (COMNESTAT), Bandung, Indonesia, 10–12 December 2015; pp. 8–15.
- Park, S.; Jung, K.-Y. Design of a circularly-polarized UHF antenna for partial discharge detection. IEEE Access 2020, 8, 81644–81650.
- Yadam, Y.R.; Sarathi, R.; Arunachalam, K. Planar Ultrawideband Circularly Polarized Cosine Slot Archimedean Spiral Antenna for Partial Discharge Detection. IEEE Access 2022, 10, 35701–35711.
- Li, T.; Rong, M.; Zheng, C.; Wang, X. Development simulation and experiment study on UHF partial discharge sensor in GIS. IEEE Trans. Dielectr. Electr. Insul. 2012, 19, 1421–1430.
- Cheng, L.; Wen, H.; Liu, Y.; Jiang, Y.; Zhou, Z.; Zhang, J.; Zhang, G.; Mao, H. Study on Flexible Built-in Miniature Archimedes Spiral Antenna Sensor for High-voltage electrical equipment PD Detection. In Proceedings of the 2022 7th Asia Conference on Power and Electrical Engineering (ACPEE), Hangzhou, China, 15–17 April 2022; pp. 1477–1482.
- Andre, H.; Emeraldi, P.; Hazmi, A.; Waldi, E.P.; Khayam, U. Long bowtie antenna for partial discharge sensor in gas-insulated substation. In Proceedings of the 2017 International Conference on High Voltage Engineering and Power Systems (ICHVEPS), Bali, Indonesia, 2–5 October 2017; pp. 175–178.
- Rhamdhani, T.; Khayam, U.; Zaeni, A. Improving Antenna Performance by Combining Dipole and Bowtie Antenna for Partial Discharge Measurement in Gas Insulated Switchgear. In Proceedings of the 2022 IEEE International Conference in Power Engineering Application (ICPEA), Shah Alam, Malaysia, 7–8 March 2022; pp. 1–4.
- Daulay, M.S.H.; Khayam, U. New Design of Double Layer Bow-tie Antenna with Edge and Middle Sliced Modification for Partial Discharge Measurement. In Proceedings of the 2018 Conference on Power Engineering and Renewable Energy (ICPERE), Surakarta, Indonesia, 29–31 October 2018; pp. 1–5.
- Uwiringiyimana, J.P.; Khayam, U. Measurement of partial discharge in air insulation by using UHF double layer bowtie antenna with modified wings edges. In Proceedings of the 2019 International Conference on Electrical Engineering and Informatics (ICEEI), Bandung, Indonesia, 9–10 July 2019; pp. 228–233.
- Zhang, J.; Zhang, X.; Xiao, S. Antipodal Vivaldi antenna to detect uhf signals that leaked out of the joint of a transformer. Int. J. Antennas Propag. 2017, 2017, 9627649.
- Saleh, S.; Ismail, W.; Abidin, I.S.Z.; Bataineh, M.H.; Alzoubi, A.S. Compact UWB Vivaldi Tapered Slot Antenna. Alex. Eng. J. 2022, 61, 4977–4994.
- Albarracin, R.; Robles, G.; Mart’, J.; Ardila-Rey, J. Separation of sources in radiofrequency measurements of partial discharges using time-power ratio maps. ISA Trans. 2015, 58, 389–397.
- Harbaji, M.M.; Zahed, A.H.; Habboub, S.A.; AlMajidi, M.A.; Assaf, M.J.; El-Hag, A.H.; Qaddoumi, N.N. Design of Hilbert fractal antenna for partial discharge classification in oil-paper insulated system. IEEE Sens. J. 2016, 17, 1037–1045.
- Uwiringiyimana, J.P.; Suwarno; Khayam, U. Design of an Ultra-Wide Band Microstrip Patch Antenna for Partial Discharge Detection on Power Transformer. In Proceedings of the 2021 IEEE International Conference on the Properties and Applications of Dielectric Materials (ICPADM), Johor Bahru, Malaysia, 11–15 July 2021; pp. 242–245.
- Sinaga, H.H. Detection, Identification and Localization of Partial Discharges in Power Transformers Using UHF Techniques. Ph.D. Thesis, The University of New South Wales Australia, Sydney, Australia, 2012.
- Chai, H.; Phung, B.; Zhang, D. Development of UHF sensors for partial discharge detection in power transformer. In Proceedings of the 2018 Condition Monitoring and Diagnosis (CMD), Perth, Australia, 23–26 September 2018; pp. 1–5.
- Zhang, X.; Cheng, Z.; Gui, Y. Design of a new built-in UHF multi-frequency antenna sensor for partial discharge detection in high-voltage switchgears. Sensors 2016, 16, 1170.
- Khosronejad, M.; Gentili, G.G. Design of an Archimedean spiral UHF antenna for pulse monitoring application. In Proceedings of the 2015 Loughborough Antennas Propagation Conference (LAPC), Leicestershire, UK, 2–3 November 2015; pp. 1–4.