Your browser does not fully support modern features. Please upgrade for a smoother experience.
Please note this is a comparison between Version 1 by Hasan Mehraj and Version 3 by Sirius Huang.
Heterosis is an important phenomenon for high-yield crop breeding and is utilized for breeding F1 varieties in horticultural crops.
- hybrid vigor
- genetics
- transcriptome
- epigenetics
- QTL
- noncoding RNAs
- DNA methylation
- histone modification
1. Introduction
It is known that the F1 (first filial generation) resulting from a specific combination of parental lines can show traits superior to those of the parental lines; this phenomenon is known as hybrid vigor or heterosis. The discovery of this phenomenon dates back to the 19th century and is described in The Effect of Cross- and Self-Fertilisation in the Vegetable Kingdom in 1876 by Charles Darwin [1]. The word “heterosis” was introduced by George Shull instead of the ambiguous phrases, “stimulus of heterozygosis” or “heterozygotic stimulation” [2]. In plants, heterosis is accompanied by increased size and is also found in many crop and vegetable yield traits [3][4][3,4]. Heterosis occurs in livestock (animals) with greater milk, egg, or wool production [5]. The use of commercial F1 varieties began with the incorporation by George Shull of increased yield through heterosis into a breeding program in maize. In Iowa, in the U.S., where the introduction of hybrid corn was earlier than in other states, the share of hybrid corn of the total maize planting increased rapidly from 1935, reaching 90% in 1939 [3]. After replacing the double cross methodology, where both parents were hybrids, with the single cross methodology in the 1960s, by 2000 the yield was further increased by 140 bushels per acre and was about five times higher than before the use of hybrids (open-pollinated inbred lines) [3].
The genetic mechanism of heterosis has long been discussed. There are some hypotheses (“dominance hypothesis”, “overdominance hypothesis”, “pseudo-overdominance hypothesis”, and “epistasis hypothesis”) that have been proposed to explain heterosis. Under the dominance hypothesis, heterosis occurs when dominant alleles of one parent complement deleterious recessive alleles of the other parent in the F1 [3][6][7][3,6,7]. Based on this dominance hypothesis, an inbred line, which shows the same level of growth as the heterotic F1, can be created by accumulating dominant alleles. The accumulation of six dominant quantitative trait loci (QTLs) in sorghum could produce biomass that was equivalent to the heterotic F1, indicating that biomass heterosis in sorghum could be explained by the dominance hypothesis [8]. Hybrid mimics (inbred high-yielding lines), selected for superior growth and showing growth comparable to the heterotic F1 in Arabidopsis thaliana, wheat, and rice, may also be due to the accumulation of dominant alleles [9][10][11][12][9,10,11,12]. Under the overdominance hypothesis, heterozygosity itself results in heterosis and was formulated to explain the fact that few inbred lines approached the yield of the heterotic F1 [3][13][3,13]. In tomato, a heterozygote between a functional and nonfunctional SINGLE FLOWER TRUSS gene (SFT/sft) increased the yield by up to 60% compared with plants having either a homozygous functional or nonfunctional gene [14]. In some cases, overdominance is actually pseudo-overdominance, which is caused by dominance complementation of two recessive mutations at closely linked loci in trans or in repulsion [15]. The dominance hypothesis, overdominance hypothesis, and pseudo-overdominance are based on allelic interactions of gene activity. The epistasis hypothesis is based on nonallelic interactions derived from the parental lines leading to heterosis [16]. The genetic mechanism of heterosis is complicated, especially for yield heterosis, as many loci are involved in heterosis, and cumulative effects of dominance, overdominance, pseudo-overdominance, and epistasis could be important for heterosis [17][18][17,18]. Despite a century of examination, these hypotheses cannot fully explain the mechanism of heterosis, but they are still a cornerstone of heterosis research.
The most labor-intensive part of the F1 hybrid breeding process is finding the best parental combinations. The diallel cross where all parental combinations are crossed to make the F1 plants is particularly labor intensive. Estimation of optimal parental combinations by molecular markers is desired. Initially, it was considered that the genetic distance between parents would have the potential to predict the combination of parental lines displaying the largest heterotic effects. Some studies showed that more genetically divergent parents could lead to increased heterosis, but a positive correlation between genetic distance and heterosis was not always present [19]. In a tomato study, crosses showing significant best parent heterosis (BPH) in some traits were derived from parents having a close genetic distance, although another F1 derived from parental lines with a close genetic distance showed no significant BPH, indicating that genetic distance is not a predictor for heterosis in tomato [20]. There was also difficulty in predicting heterosis using the genetic distance of parental lines found in eggplant [21]. In the case of Chinese cabbage, there was a significant correlation between the genetic distance of parental lines and mid-parent heterosis (MPH) or between the genetic distance of parental lines and high parent heterosis (HPH)/BPH in some traits [22]. However, no such correlation was observed for plant weight at the harvesting stage (yield), consistent with the result of another study (Figure 1) [23]. The prediction of heterosis by genetic distance of parental lines is still under debate. It is difficult to predict heterosis from genome-wide genetic distances, and a limited number of chromosomal regions could be involved in heterosis.
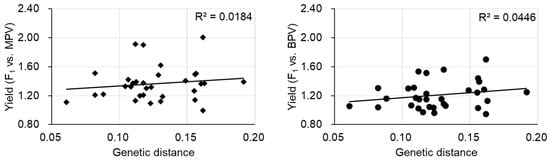
Figure 1. The relationship between yield heterosis and genetic distance of parental lines. MPV, mid-parent value, BPV, best parent value. Data are from [23].
Plant breeders have widely exploited heterosis for developing F1 varieties in cereals and vegetables [19][24][25][19,24,25]. F1 varieties not only show superiority in yield but also have stress tolerance and uniformity of growth in the field and size of products [19][26][19,26]. New F1 vegetable varieties are replacing open-pollinated varieties; the top five vegetables with the highest number of F1 varieties registered in Europe are tomato, pepper, melon, cucumber, and onion, in that order [27]. An effective, efficient, reliable, and stable method for F1 seed production without contamination by self-fertilized seeds from each parent is useful for F1 hybrid breeding [19][28][19,28]. For the commercial production of F1 seeds, there are many genetic systems such as cytoplasmic male sterility, genetic male sterility, and self-incompatibility [28][29][30][31][28,29,30,31]. Hand-pollination systems are also used for producing F1 seeds in some vegetables.
2. Heterosis Research Findings in A. thaliana
2.1. Genetic Analysis
To understand the genetic basis of the heterosis mechanism, QTL analysis and genome-wide association studies (GWAS) have been performed in A. thaliana [19][32][33][19,32,33]. QTLs of biomass or rosette diameter at 22 and 29 days after sowing (DAS) were identified on all chromosomes using a population derived from crossing between C24 and Columbia-0 (Col-0) accessions, and the overdominance model was mainly supported [34]. QTL analysis of biomass and leaf area at early developmental stage using recombinant inbred lines-test cross (RIL-TC) and introgression lines-test cross (IL-TC) from crossing between C24 and Col-0 identified QTLs on chromosomes 1, 3, and 4 [35]. Metabolite QTLs using RIL and IL populations derived from crossing between C24 and Col-0 were also identified, and hot spots of QTLs were observed on chromosomes 1, 3, and 4 [36]. Integration of QTL mapping using C24 and Col-0 accessions and systems biological network analysis revealed that overlapped genes of these two approaches are involved in biomass-related pathways [37]. Furthermore, multiple genes located in each QTL region, especially in chromosomes 2 and 4, might be involved in biomass heterosis in early development [37].
The genetics of the hybrid phenotype were explored by a GWAS in 30 inbred accessions and 435 hybrid combinations. A number of significant SNPs related to the MPH of dry mass were detected [32]. GWAS for biomass heterosis using 200 hybrids by crossing Col-0 with other accessions were performed, and no clear signals resembling a peak were observed, suggesting that many alleles could be involved in biomass heterosis [33]. Heterosis positively associated with 750 SNPs was identified using a modest significance threshold. Genes containing these SNPs were enriched in response to stimulus pathways, suggesting that genomic divergence of stimulus-responsive genes between parental lines might contribute to biomass heterosis [33]. These two studies did not identify a strong correlation between the genetic distance of parental lines and biomass heterosis, suggesting that a small number of genomic loci contribute to biomass heterosis [32][33][32,33].
2.2. Transcriptome
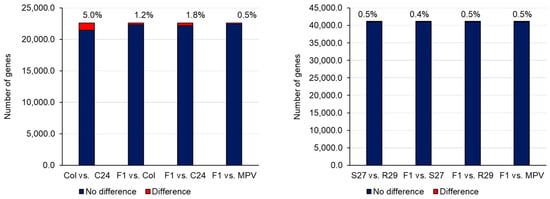
Transcriptome analysis such as microarray and RNA-sequencing (RNA-seq) has been used in heterosis studies of A. thaliana. Many attempts to pinpoint key genes associated with heterosis have been conducted by identifying differentially expressed genes (DEGs) between parental lines and their F1s, and the average expression levels of parental lines, the mid-parent value (MPV), and F1s have been compared [19][38][19,38]. When expression levels are different between the two parental lines, the same expression level between MPV and F1 is called additive expression, while a different expression level is considered non-additive expression [19]. A difference in expression between the two parental lines with the expression level of the F1 being the same as the parent with the higher expression level is considered high-parent dominance. The expression level of the F1 being the same as the parent with the lower expression level is described as low-parent dominance. Using SNPs in transcripts, it is possible to identify genes showing allele-specific expression in the F1 [19][39][19,39]. In general, most genes in the F1 showed additive expression, and the number of non-additively expressed genes is far fewer than additively expressed genes (Figure 2) [19][38][39][19,38,39]. Furthermore, the expression pattern in the parental lines and the F1 is tissue- and stage-specific, making it difficult to examine the association between DEGs and heterosis from the profile of only a specific tissue or stage [19].
Because the heterosis phenotype is superior to that of the parental lines, there has been a tendency to focus on non-additively expressed genes and associated overdominance or underdominance. Non-additively expressed genes categorized into ‘chloroplast’, ‘photosynthesis’, ‘circadian rhythm, ‘stress response’, ‘senescence’, or ‘plant hormone pathway’ have been identified, and the association between non-additively expressed genes and heterosis discussed [38][40][41][42][43][44][45][46][38,40,41,42,43,44,45,46]. On the other hand, a similar expression pattern between one parent and the F1 with developmental stage specificity might be important for heterosis [47]. Furthermore, the idea that the functional category showing high or low parent expression pattern changes through development could be important for heterosis has been proposed; a high parent expression pattern with the parent Per-1 in genes categorized into the photosynthesis pathway at 3–5 DAS (cotyledon developmental stage) and high parent expression pattern with another parent Col-0 in genes categorized into cell cycle pathway at 6–8 DAS (first true leaf developmental stage) were observed in the F1, suggesting that coordinated gene expression and functional complementation during plant development is important for heterosis [48].
N6-methyladenosine (m6A) is the most common covalent modification in mRNA and long noncoding RNA (lncRNA) [49][50][49,50]. Recently, many studies suggested that the modification of m6A regulates plant development [51]. Xu et al. [52] mapped m6A methylation of Col-0, Landsberg erecta (Ler), and their F1s, and the peaks of m6A were conserved among them; most m6A peaks (~95%) had an additive pattern in the F1 and only a few hundred peaks showed a non-additive pattern. About 7% of non-additively expressed genes showed a non-additive pattern of m6A modification. mRNA m6A modification has been proposed as a new component of heterosis [52], but further research is needed.
2.3. Epigenetics
Epigenetics can give rise to heritable changes in gene regulation without alterations of the DNA sequence [53]. One epigenetic system is DNA methylation, which is the methylation of cytosine residues, and it occurs in all cytosine contexts, namely CG, CHG, and CHH (H = A, T or C) [53][54][53,54]. Another epigenetic system is histone modification, such as methylation, acetylation, ubiquitylation, phosphorylation, and sumoylation of histone tails [53][54][53,54]. Genome-wide analysis comparing DNA methylation states or histone modification states between parental lines and their F1s showed additive states in the majority of genomic regions in F1s [41][55][56][41,55,56]. DNA methylation rarely appears or disappears in the regions without or with DNA methylation in both parental lines, respectively [41][55][41,55]. In regions where DNA methylation differs between parental lines, trans-chromosomal methylation (TCM) and trans-chromosomal demethylation (TCdM), which result in non-additive DNA methylation states in the F1, occur [55][57][55,57]. RNA-directed DNA methylation (RdDM), which is mediated by 24-nucleotide small interfering RNAs (24-nt siRNAs), is involved in these TCM and TCdM events [57][58][57,58]. An F1, which has a mutation of genes involved in the biosynthesis of 24 nt siRNAs, showed a similar level of heterosis to the wild-type F1, suggesting that 24 nt siRNAs do not play a significant role in heterosis [57][59][57,59]. The weak association between non-additive DNA methylation states and non-additive gene expression makes it difficult to explain the contribution of DNA methylation to heterosis. However, F1s between lines with the same genetic background and different levels of DNA methylation states showed growth vigor in certain combinations, suggesting that DNA methylation may be important for heterosis [60][61][60,61]. Furthermore, the level of heterosis decreased when the decrease in DNA methylation 1 (ddm1) homozygous mutations were present [59][62][59,62]. As DDM1 is involved in the maintenance of DNA methylation, these results suggest a contribution of DNA methylation to heterosis. However, it is not clear why the loss of DDM1 function reduces heterosis, and further studies are needed [63].
2.4. Trade-Off between Growth and Disease Resistance
There are reports of the effect of heterosis on stress tolerance, including a role in freezing tolerance or disease resistance in A. thaliana [19]. Since heterotic F1s with both increased biomass and disease resistance are rarely seen, a model for a trade-off relationship between defense and growth has been proposed [64][65][64,65]. Hybrid necrosis showing growth abnormalities due to autoimmunity-like responses has also been considered as a basis for this trade-off hypothesis [66]. Enhanced salicylic acid (SA) biosynthesis that regulates plant development and plant defense response contributes to the heterosis of disease resistance [65]. An elevation of salicylic acid accumulation promoted by a central circadian oscillator, CIRCADIAN CLOCK ASSOCIATED1 (CCA1), enables disease resistance heterosis. This F1 also showed enhanced growth heterosis, and CCA1 is also involved in the growth heterosis, suggesting that CCA1 contributes to the balance between defense and growth heterosis [67]. The possibility that SA is involved in growth heterosis has been reported; decreasing SA level in the F1 compared with MPV might cause growth heterosis [42]. However, the SA contents in heterotic F1s are lower than those in the C24 parent and higher than those in the Col/Ler/Ws parent [42]. F1s with increased SA show both growth heterosis and no growth heterosis [65][67][65,67]. Alternately, there may be an optimal concentration of SA for growth heterosis; heterosis is associated with increased SA at low concentrations, but inhibition is associated with high concentrations [62]. Direct evidence of the relationship between SA content and growth heterosis is needed.