Myotonic dystrophy (DM) is the most common muscular dystrophy in adults. Dominantly inherited CTG and CCTG repeat expansions in dystrophia myotonica protein kinase (DMPK) and cellular nucleic acid-binding protein (CNBP) genes cause DM type 1 (DM1) and 2 (DM2), respectively. These genetic defects lead to the abnormal splicing of different mRNA transcripts, which are thought to be responsible for the multiorgan involvement of these diseases. Cancer frequency in patients with DM appears to be higher than in the general population or non-DM muscular dystrophy cohorts.
1. Introduction
Myotonic dystrophy (
dystrophia myotonica or DM) is the most common muscular dystrophy in adults. It is an autosomal dominant multisystem disease with two different clinical forms: myotonic dystrophy type 1 (DM1, OMIM 160900) and myotonic dystrophy type 2 (DM2, OMIM 602668). The prevalence of DM1 varies widely across different populations, being higher in northern Sweden, Quebec, and the Basque region, suggesting a founder effect (prevalence = ~1/4000–8000)
[1][2][1,2]. DM1 is caused by a CTG trinucleotide expansion (>50 repeats) within the 3′UTR of the
dystrophia myotonica protein kinase (
DMPK) gene on chromosome 19
[3]. The prevalence of DM2, although lower than that of DM1 in most studies, has been reported to be as high as 1 in 1830 in the Finnish population
[4], which suggests that this disease form is probably underdiagnosed. DM2 is caused by a CCTG tetranucleotide expansion (>75 repeats) within intron 1 of the
cellular nucleic acid-binding protein (
CNBP) gene (formerly called
zinc finger protein 9, or
ZNF9) on chromosome 3
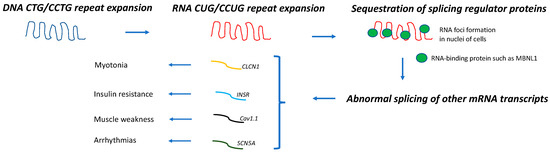
[5]. DM1 and DM2 share a common pathogenic mechanism; expanded DNA repeats are transcribed into expanded mRNA transcripts that accumulate within the nuclei of the cells forming the RNA foci. These mutant CUG-containing RNA strands sequester important splicing regulator proteins, such as CUGBP/Elav-like (CELF1) and muscleblind-like 1 (MBNL1). Thus, the functions of CELF1 and MBNL1 when these proteins are sequestered within these ribonuclear foci become impaired, resulting in the expression of an abnormally spliced variety of mRNAs that appear to be responsible for the multisystem involvement of these muscular dystrophies (
Figure 1). Thus, the abnormal splicing of the chloride channel (
CLCN1) is associated with myotonia, that of the insulin receptor (
INSR) with insulin resistance, that of the calcium channel (
Cav1.1) with muscle weakness, and that of the sodium channel (
SCN5A) with arrhythmias
[6][7][8][9][10][6,7,8,9,10].
Figure 1. Pathogenic mechanism in DM. DNA repeat expansions are transcribed into mRNA molecules that accumulate in nuclei of cells and sequester splicing regulator proteins, such as MBNL1. As a result, abnormal splicing of a subset of other mRNA occurs, leading to different disease manifestations
[6][7][8][9][10][6,7,8,9,10].
Both the somatic instability of the repeat expansion across different tissues (somatic mosaicism) and the presence of epigenetic modifications appear to contribute to the variable type and severity of the clinical manifestations of DM
[6][7][6,7]. Furthermore, the abnormal regulation of miRNAs in both DM1 tissue and extracellular vesicles in the biofluids of patients with DM1 have been postulated to play a key role in DM pathogenesis and even serve as disease biomarkers
[11].
The molecular mechanism underlying carcinogenic events in DM is uncertain, but several hypotheses have been postulated, as discussed below.
Myopathies and Cancer
In addition to myotonic dystrophies, several other myopathies have been associated with cancer or benign tumors. Thus, sporadic inclusion body myositis has been associated with T-cell granular lymphocytic leukemia/B-cell chronic lymphocytic leukemia; dermatomyositis has been associated with lung, ovary, breast, colorectal, cervical, bladder, nasopharyngeal, esophageal, pancreatic, colon, and kidney cancers; immune-mediated necrotizing myopathies have been associated with lung, ovary, breast, kidney, and gastrointestinal tract cancers; idiopathic myositis and myasthenia overlap syndrome have been associated with thymoma; late-onset sporadic nemaline myopathy has been associated with monoclonal gammopathy; and glycogen storage disease type 1a (von Gierke disease) has been associated with hepatocellular adenoma/adenocarcinoma
[12].
Thus, inflammatory or immune-mediated myopathies, and myotonic dystrophies are the myopathies that are associated with a greater variety of organ-related cancers. Although dermatomyositis and immune-mediated necrotizing myopathies (both treatable myopathies) are associated with several types of cancers, there are specific antibodies that can be determined in the serum of these patients to stratify their cancer risk. For example, a patient with dermatomyositis and positive Tif-1 antibodies is at a higher risk of having an associated cancer, and intensive malignancy screening would be highly recommended in this scenario
[13]. However, for myotonic dystrophies (for which no cure exists at this time), there are no stratifiers of cancer risk to guide malignancy screening in these patients.
2. Carcinogenesis in DM
Although DM1 and DM2 appear to share the same pathogenic mechanism (Figure 1), the association between DM and cancer and its molecular basis has been mostly studied in DM1.
There are two types of studies that link DM1 and carcinogenesis: one type includes those that investigated the cancer risk and predisposition to specific cancer types in predominantly DM1 cohorts by using the general population (or healthy subjects) or a non-muscular dystrophy cohort as a comparator group, and the other type of study includes those that addressed the potential molecular mechanisms underlying DM carcinogenesis. Within the latter group, some investigated the length of the pathogenic repeat expansion in the tumoral tissue of patients with DM1, and a few of those demonstrated that a longer CTG expansion was present in tumoral cells when compared with non-tumoral cells from the same individual [14][15][16][17][25,26,27,28].
Table 12 summarizes the main findings from the studies that reported an increased risk of specific cancer types in the DM (mostly DM1) population [18][19][20][21][22][23][24][25][19,20,22,23,29,30,31,32].
Table 12.
More frequent types of cancers in DM1 cohorts.
| Reference |
N |
Thyroid |
Cutaneous Melanoma |
Pancreas |
Colon |
Endometrium |
Ovary |
Prostate |
Testes |
Brain |
Eye |
| Gadalla et al., 2011 [19][20] |
1658 |
↑SIR 7.1
(1.8–19.3) |
––– |
↑SIR 3.2
(1.0–7.6) |
↑SIR 2.9
(1.5–5.1) |
↑SIR 7.6
(4.0–13.2) |
↑SIR 5.2
(2.3–10.2) |
SIR 0.7
(0.2–1.9) |
SIR 1.4
(0.1–6.8) |
↑SIR 5.3
(2.3–10.4) |
↑SIR 12.0
(2.0–39.6) |
| Win et al., 2012 [20][22] |
307 |
↑SIR 5.54
(1.80–12.93) |
SIR 2.05
(0.42–6.00) |
––– |
SIR 1.09
(0.22–3.18) |
SIR 1.07
(0.03–5.98) |
SIR 1.66
(0.04–9.25) |
SIR 2.21
(0.95–4.35) |
SIR 5.09
(0.62–18.38) |
SIR 1.54
(0.04–8.57) |
↑SIR 27.54
(3.34–99.49) |
| Mohamed et al., 2013 [22][29] |
109 |
––– |
RR 7.1
(0.8–25.8) |
––– |
RR 5.0
(0.6–18.2) |
↑RR 21.7
(2.4–78.5) |
RR 9.3
(0.1–51.5) |
––– |
––– |
––– |
––– |
| Abbott et al., 2016 [21][23] |
281 |
RR 3.78
(0.67–13.65) |
RR 0.89
(0.0–4.20) |
––– |
RR 2.15
(0.11–11.99) |
↑RR 6.98
(1.24–25.22) |
|
RR 1.43
(0.25–5.16) |
↑RR 10.74
(1.91–38.79) |
––– |
––– |
| Fernandez-Torron et al., 2016 [18][19] |
424 |
↑SIR 23.33
(9.38–48.08) |
SIR 1.72
(0.04–9.61) |
––– |
SIR 2.06
(0.94–3.92) |
↑SIR 6.86
(2.23–16.02) |
↑SIR 8.33
(1.72–24.31) |
SIR 0.46
(0.06–1.67) |
SIR 14.25
(0.35–79.6) |
↑SIR 9.80
(3.18–22.88) |
|
| Wang et al., 2018 [23][30] |
1061 |
––– |
HR: 2.40
(0.56–10.31) |
––– |
––– |
––– |
––– |
––– |
––– |
––– |
––– |
| Alsaggaf et al., 2018 [24][31] |
927 |
↑HR 15.93
(2.45–103.64) |
↑HR 5.98
(1.24–28.79) |
↑HR 2.96
(0.30–29.38) |
HR 1.82
(0.32–10.31) |
↑HR 14.88
(2.14–103.67) |
––– |
––– |
HR 4.99
(0.46–53.78) |
––– |
| |
|
HR 1.81
(0.21–15.23) |
HR 1.12
(0.37–3.45) |
HR 0.32
(0.04–2.62) |
HR 2.03
(0.23–17.68) |
| Emparanza et al., 2018 [25][32] |
2779
(meta-analysis) |
↑pSIR = 8.52
(3.62–20.1) |
↑pSIR = 2.45
(1.31–4.58) |
––– |
↑pSIR = 2.2
(1.39–3.49) |
↑pSIR = 7.48
(4.72–11.8) |
↑pSIR = 5.56
(2.99–10.3) |
––– |
↑pSIR = 5.95
(2.34–15.1) |
––– |
––– |