Your browser does not fully support modern features. Please upgrade for a smoother experience.
Please note this is a comparison between Version 2 by Catherine Yang and Version 1 by Afzal Shah.
Methylene blue is a toxic dye that is extensively used as a colorant in textile industries. Industrial effluent containing methylene blue, when drained into water bodies without proper treatment, poses a serious threat to aquatic and human lives. In order to protect the biocycle, various methods have been established to detect and remove hazardous dyes from aqueous systems. Electrochemical methods are preferred, owing to their characteristic features of simplicity, portability, potential selectivity, cost effectiveness, and rapid responsiveness.
- electrochemical sensor
- methylene blue detection
- photocatalytic degradation
1. Electrochemical Characterization
Electrochemical Impedance Spectroscopy (EIS) was used to assess the charge transfer features of bare and modified GCEs. The frequency was varied from 1 to 14 kHz with an amplitude of 10 mV in a solution of 5 mM K3[Fe(CN)6] and 0.1 M KCl. Nyquist plots constructed from the EIS data obtained at bare and modified GCEs showed a semicircle in the high-frequency region and a linear portion in the low-frequency region. The resistance due to the charge transfer at the electrode/electrolyte interface is shown by the semicircular part, while the straight-line segment of the plot in the lower-frequency region corresponds to diffusion mass transfer as represented by Warburg impedance [41,42,43][1][2][3]. The lower diameter of the semicircle in the Nyquist plot for NH2-fMWCNTs/GCE as compared to MWCNTs/GCE and the bare GCE demonstrates faster charge transfer as evident from Figure 1A [44][4]. The Rct values obtained for MWCNTs/GCE (3070.5 Ω) and NH2-fMWCNTs/GCE (2.6 Ω) are lower than the bare glassy carbon electrode (5493.7 Ω). This may be attributed to an increase in surface area of the modified GCE with enhanced conductivity characteristics for rapid charge transport of the redox probe. Randle’s equivalent circuit (inset Figure 1A) was used to fit EIS data for the evaluation of parameters where Rs denotes the solution resistance, Rct is the charge transfer resistance, and CPE is the constant phase element. The solution resistance (Rs) is offered to the migration of charges through the electrolyte solution, the constant phase element corresponds to the electrical double layer capacitance, Rct corresponds to the occurrence of charge transfer of the redox probe at the surface of the electrode, and the Warburg (W) impedance models represent the diffusional mass transport from the electrode surface to the bulk, and vice versa.
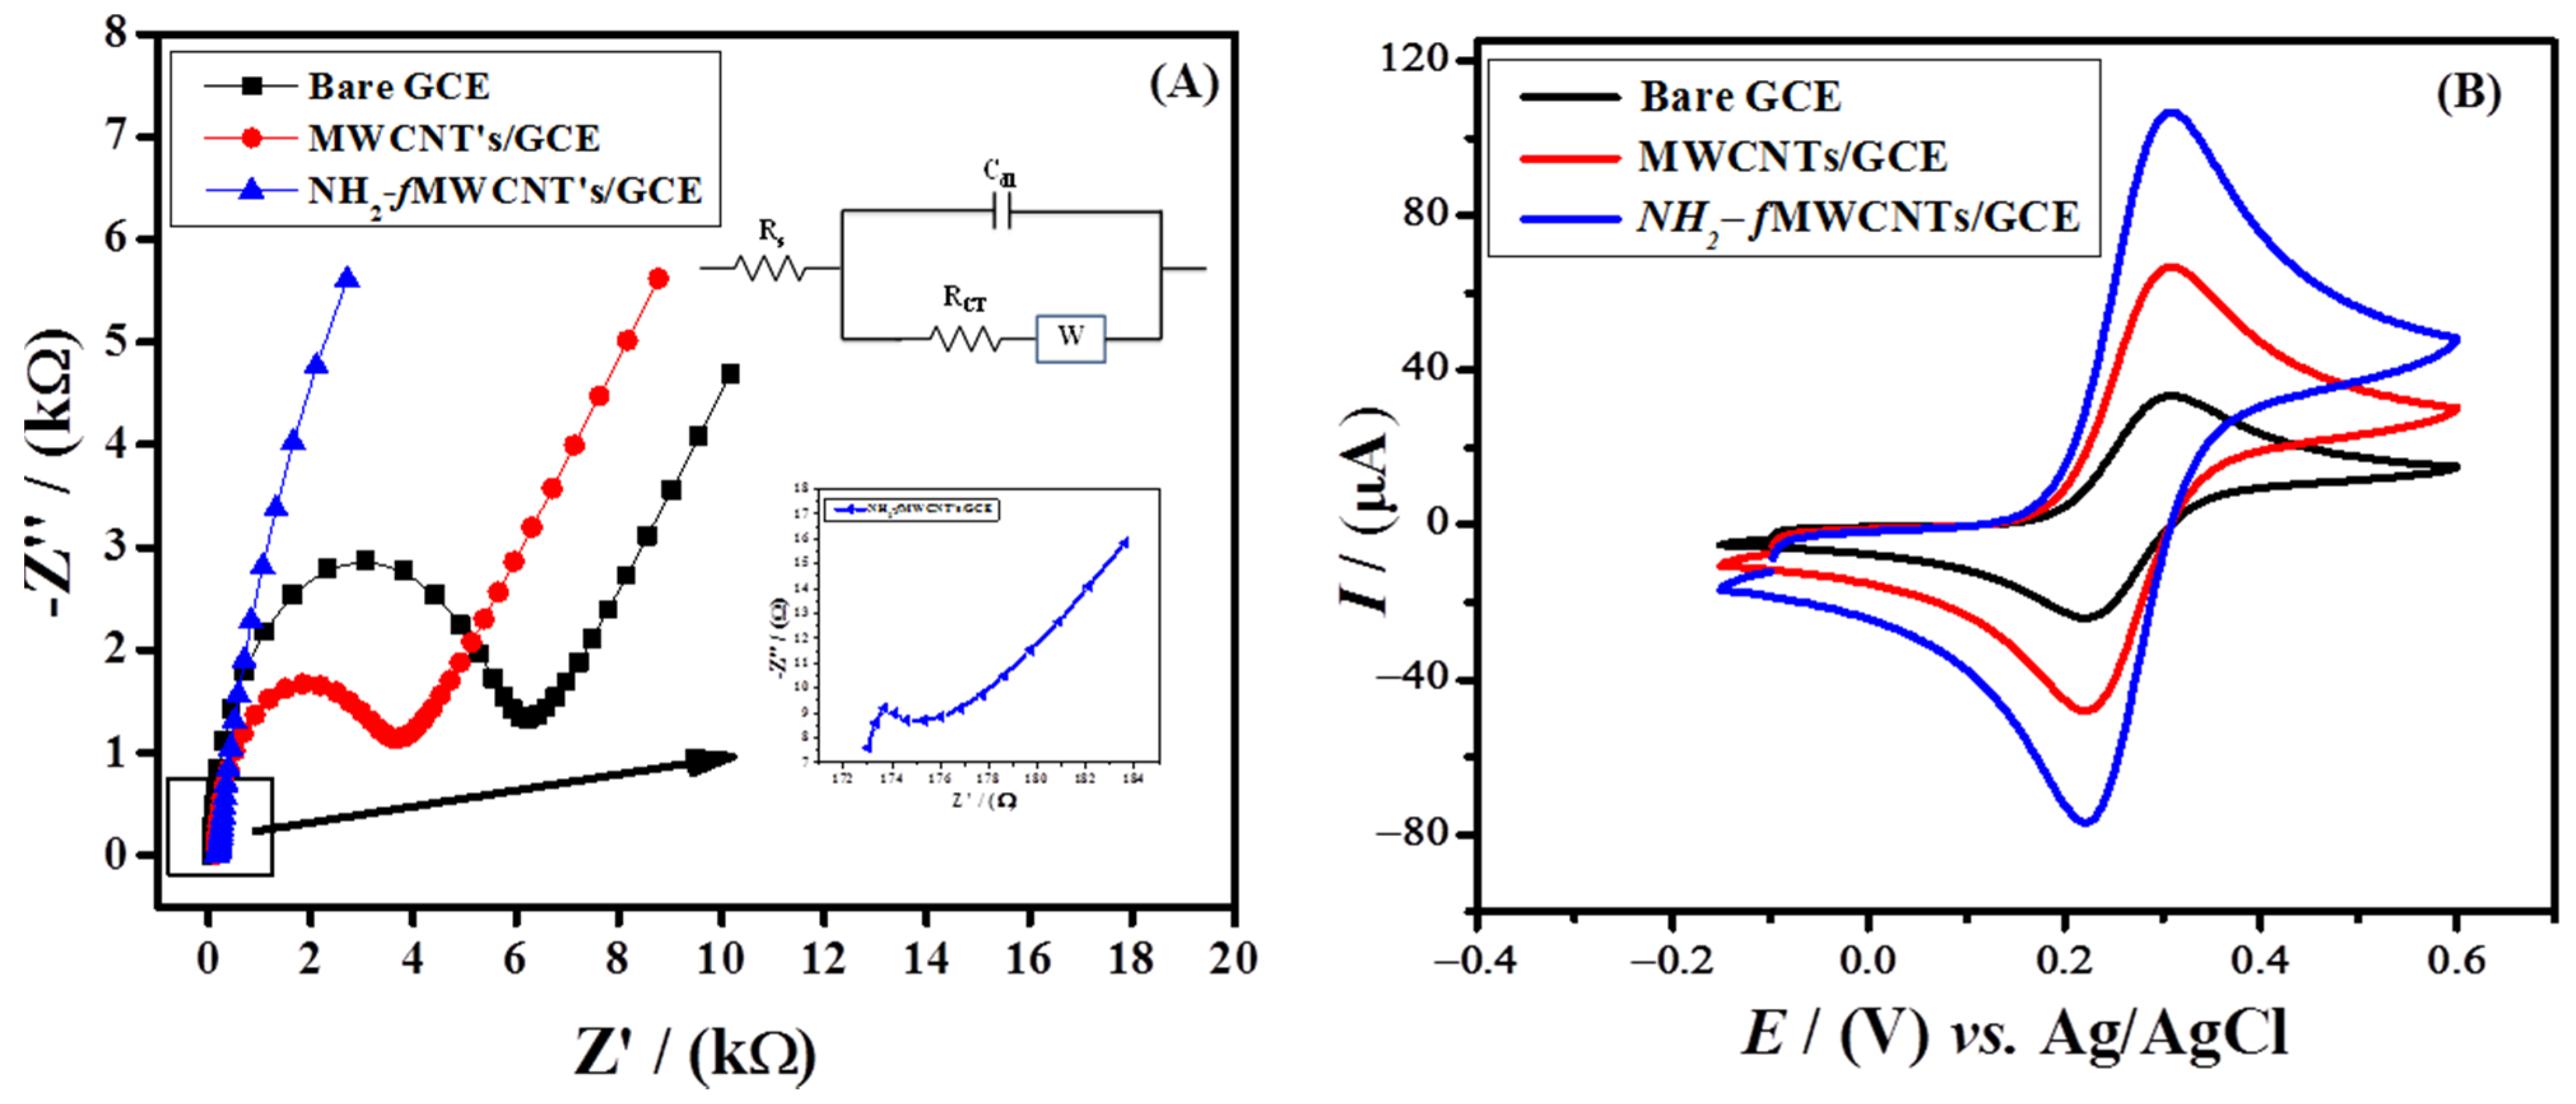
Figure 1. (A) Nyquist plots at bare and modified GCEs in a 5 mM K3[Fe(CN)6] and 0.1 M KCl solution and comparative cyclic voltammograms obtained at the bare and modified GCEs in 5 mM K3[Fe(CN)6] and (B) 0.1 M KCl solution at a scan rate of 100 mV/s in the potential range of −0.15 V to 0.6 V.
CV was performed to probe the current response of the analyte to the bare and modified GCEs. A 5 mM K3[Fe(CN)6] was used as a redox probe with a 0.1 M potassium chloride solution as a supporting electrolyte. In Figure 1B, the modified GCE shows an enhanced peak current of the redox probe as compared to bare GCE. The Randle–Sevcik equation (Ip = 2.6 × 10⁵ n3/2 D1/2 ν1/2 AC) was used to measure the active surface area of the modified and bare GCE. The calculated active surface areas, redox peak currents, and ΔEp of the modified and bare GCEs, which indicates that the designed sensor (NH2-fMWCNTs/GCE) provides more sites for [Fe(CN)6]−3/−4 than the signals obtained at MWCNTs/GCE and bare GCE, as witnessed by the enhanced peak current signal of K3[Fe(CN)6].
2. Voltammetric Analysis of the Targeted Analyte
Square wave voltammetry is a sensitive and rapid electroanalytical technique for analyzing the analyte signals with a high resolution. The voltammetric response of the MB dye at the bare and modified working electrodes was obtained in a 0.1 M PBS solution of pH 6 in a potential window of −0.6 V to 0.5 V at a scan rate of 125 mV/s. MB oxidized at −0.24 V with a maximum current response of 8.3 μA at bare GCE. The current response of MB jumped to 12.6 μA and 19.5 μA at MWCNTs/GCE and NH2-fMWCNTs/GCE, respectively, as shown in Figure 2. Thus, GCE modified with NH2-fMWCNTs is the best platform for MB detection. The amino group is introduced for enhancing the electrocatalytic activity of MWCNTs. However, due to the amino group, the modified electrode (NH2-fMWCNTs/GCE), when tested in a blank solution, gives an oxidation peak at 0.03 V. Every material has its own electrochemical oxidation potential [45][5]. It is interesting to note that the signal does not overlap with the response of MB. Hence, NH2-fMWCNTs/GCE allows the sensitive detection of MB.
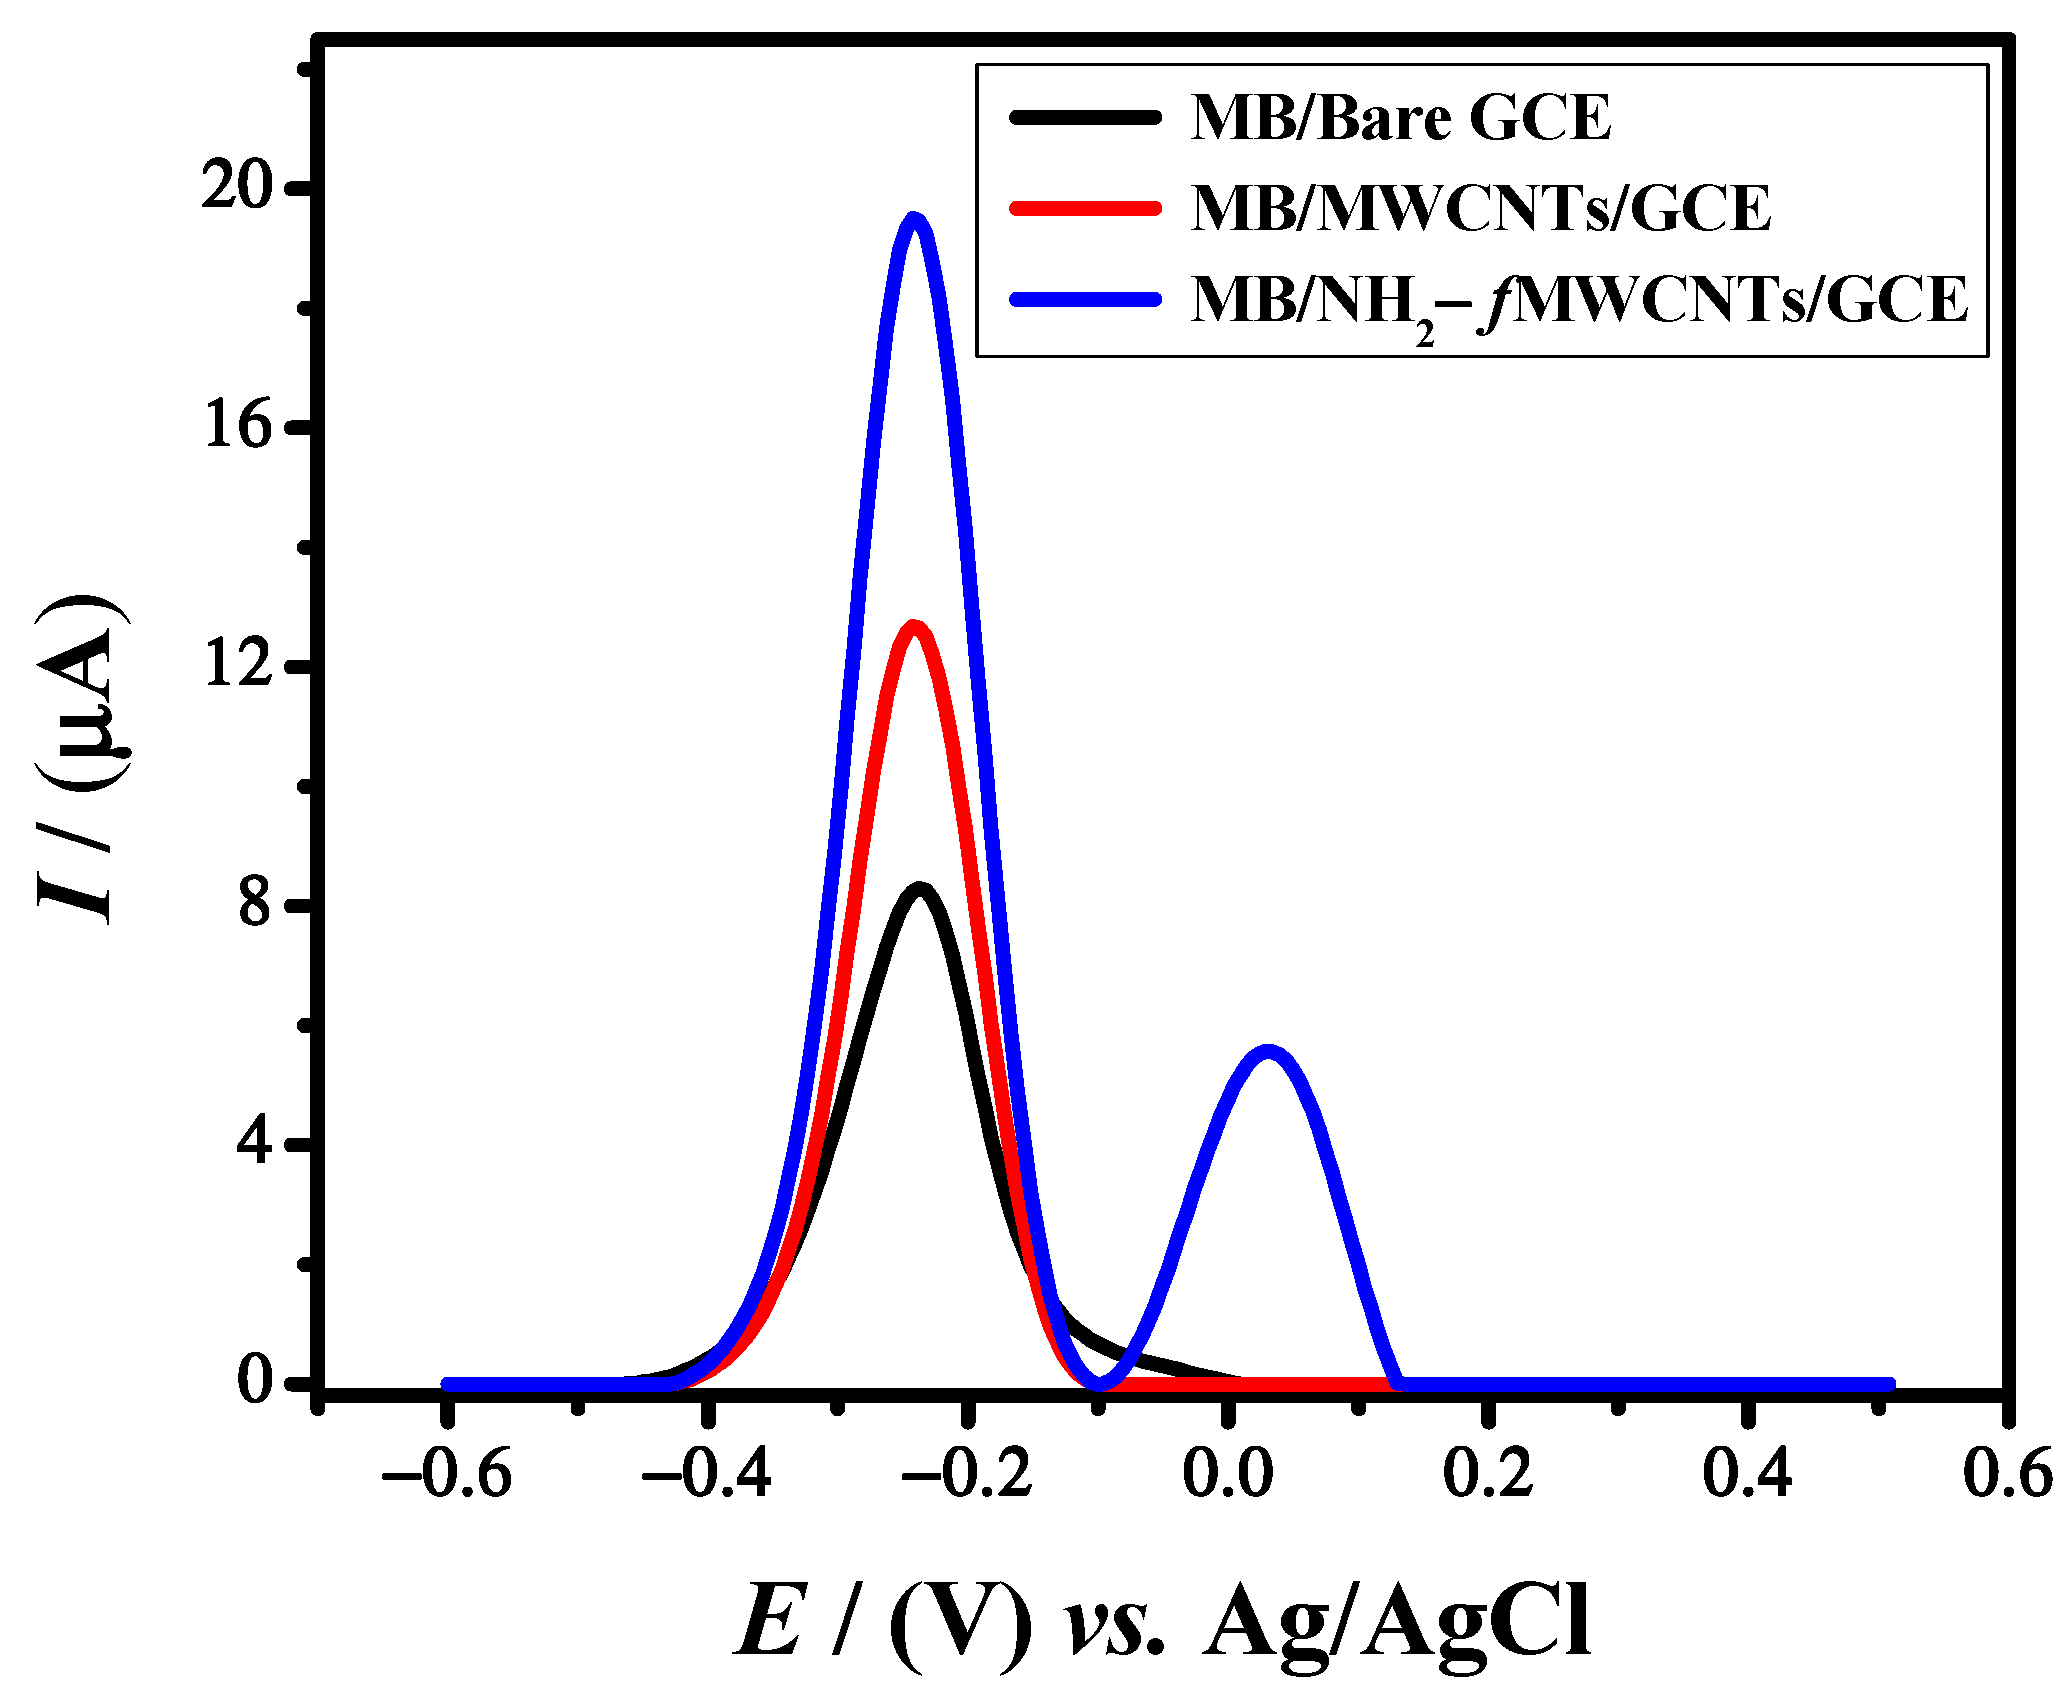
Figure 2.
Comparative SWVs of 10 μM MB at bare GCE, MWCNT’s/GCE, and NH
2
-
f
MWCNT’s/GCE in a potential window of −0.6 to 0.5.
3. Effect of Scan Rate
CV was performed to check the effect of the scan rate on the peak current of MB (Figure 3A). To ascertain whether the electrochemical reactions are surface assisted or diffusion controlled, the relation between the signal intensity and scan rate was investigated. A linear plot between the peak current and scan rate shows a surface-controlled reaction, while linearity between the peak current and the square root of the scan rate shows a diffusion-controlled reaction. The oxidative peak current of MB was plotted against the scan rate and square root of the scan rate, respectively. A literature survey reveals that the process should be diffusion controlled if the plot of the log of the peak current vs. the log of the scan rate has a slope of 0.5 and adsorption controlled if the slope is equal to 1 [46][6]. The plot between the log of the oxidation peak current and the log of scan rates shown in Figure 3B, with a slope of 0.72, suggests the involvement of both surface and diffusional processes. However, the adsorption process seems dominant as the correlation coefficient of the plot between the peak current and scan rates is higher as compared to the R2 of the plot between the peak current and the square root of scan rates.
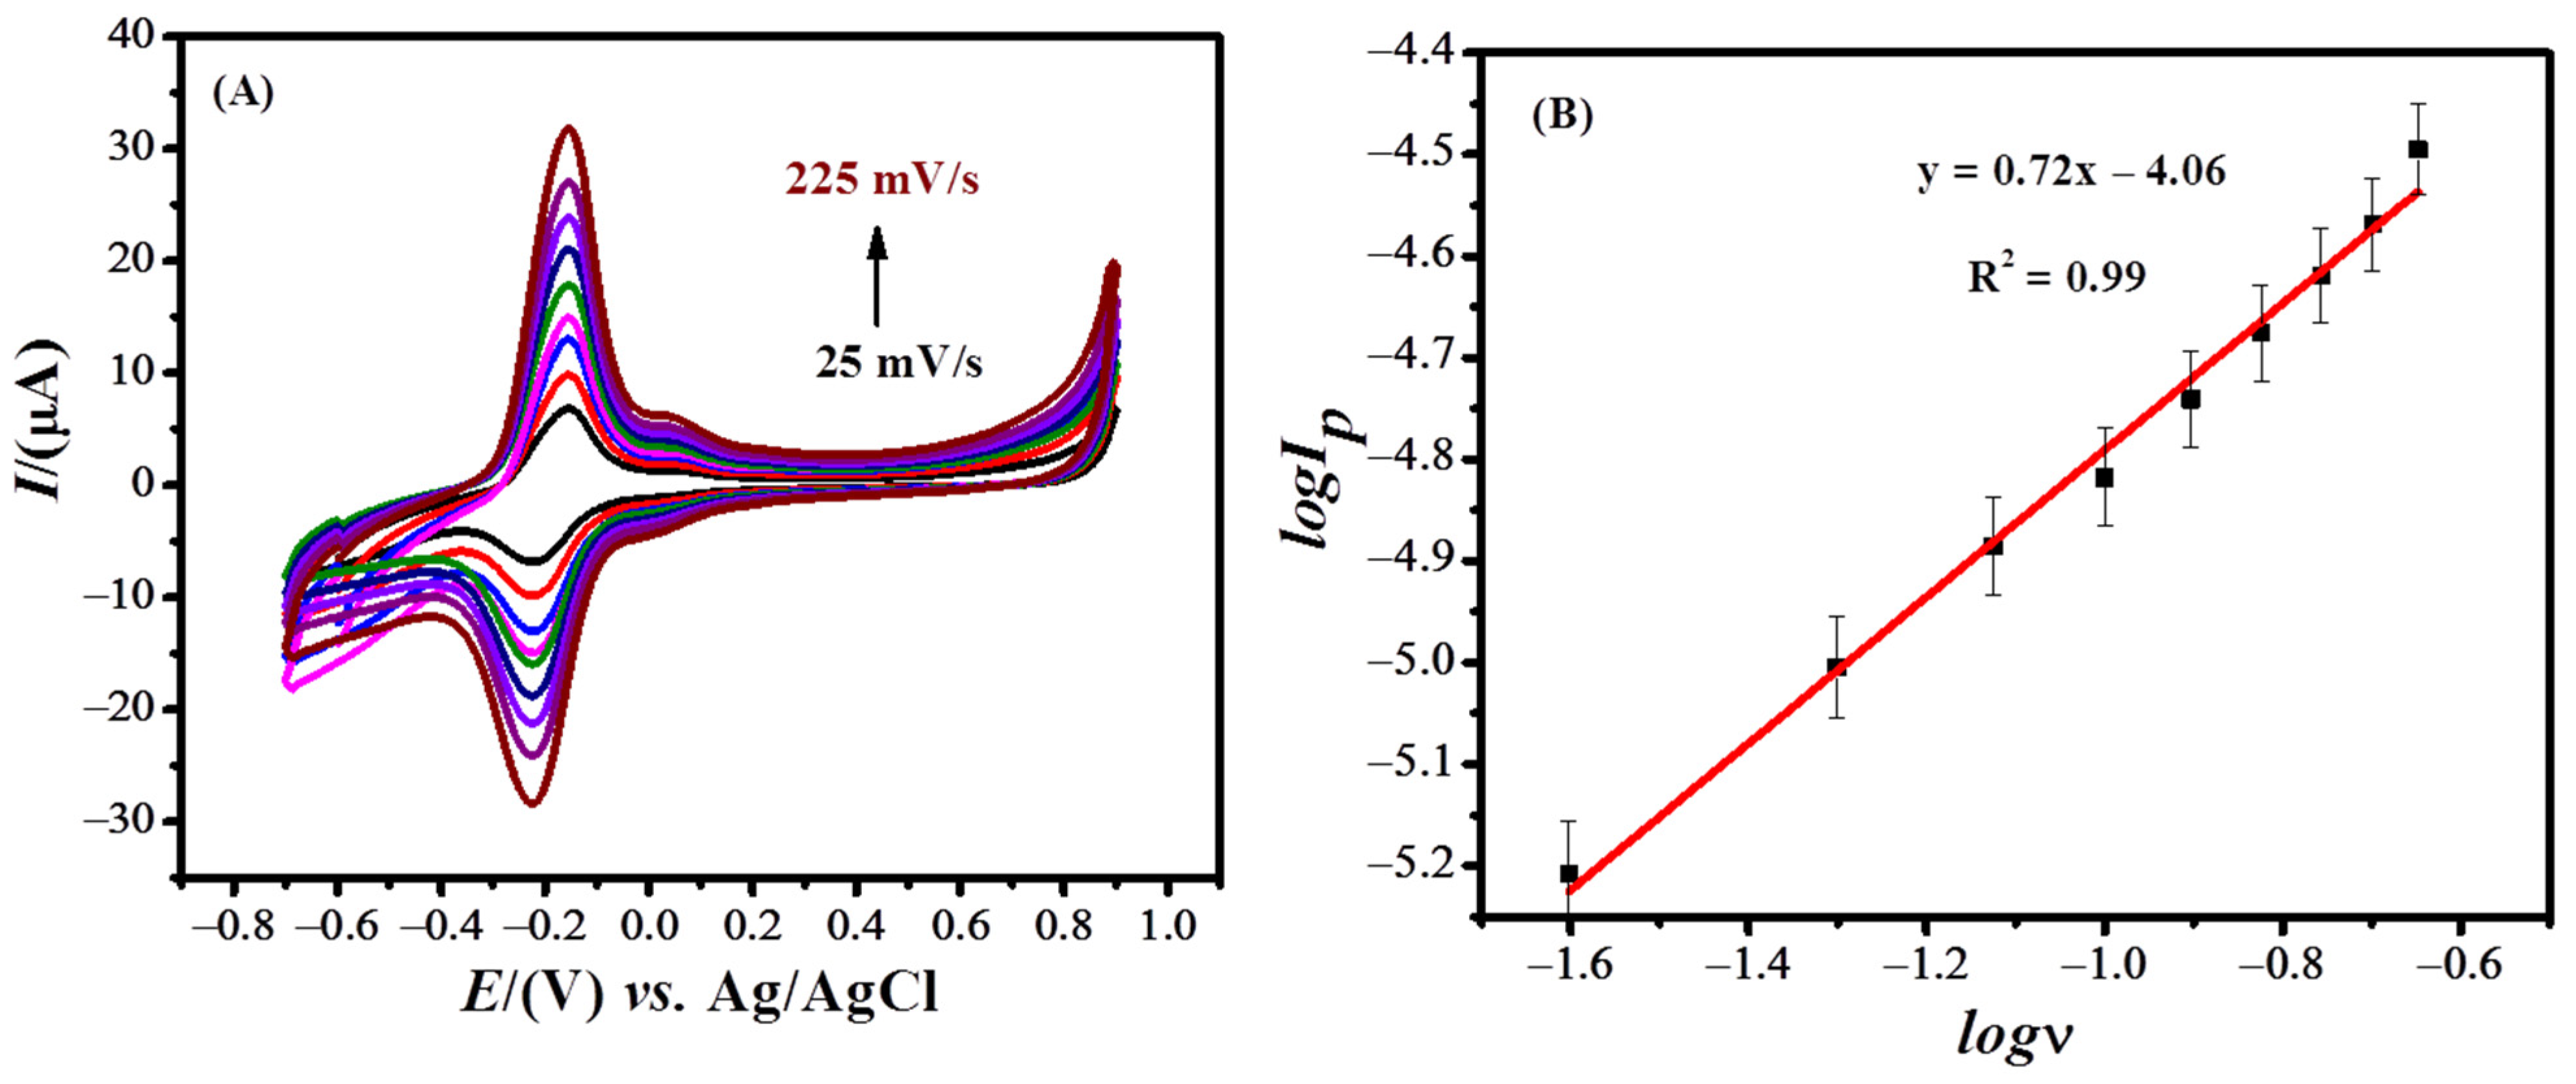
Figure 3.
(
A
) Cyclic voltammograms of 0.1 mM MB at various scan rates. (
B
) Plot of the log of the oxidative peak current of MB dye vs. log of scan rate.
4. Optimization of Experimental Parameters. Influence of Supporting Electrolyte, pH, Deposition Potential, and Deposition Time
Several parameters were optimized to obtain the maximum current response of MB using NH2-fMWCNTs modified GCE. The selection of the supporting electrolyte is important for obtaining a robust, intense signal of the targeted analyte. To investigate the maximum current response of the targeted analyte (MB), different supporting electrolytes, such as the Britton Robinson buffer (BRB), KCl, NaCl, HCl, H2SO4, NaOH, Acetate buffer, and phosphate buffer saline (pH = 6.0), of a 0.1 M concentration were examined. The most suitable supporting electrolyte was found to be PBS in which the analyte oxidized with the maximum current response and well-defined peak shape as compared to other electrolytes. The corresponding bar graph shown in Figure 4 demonstrates PBS as the most suitable supporting electrolyte for the detection of MB.
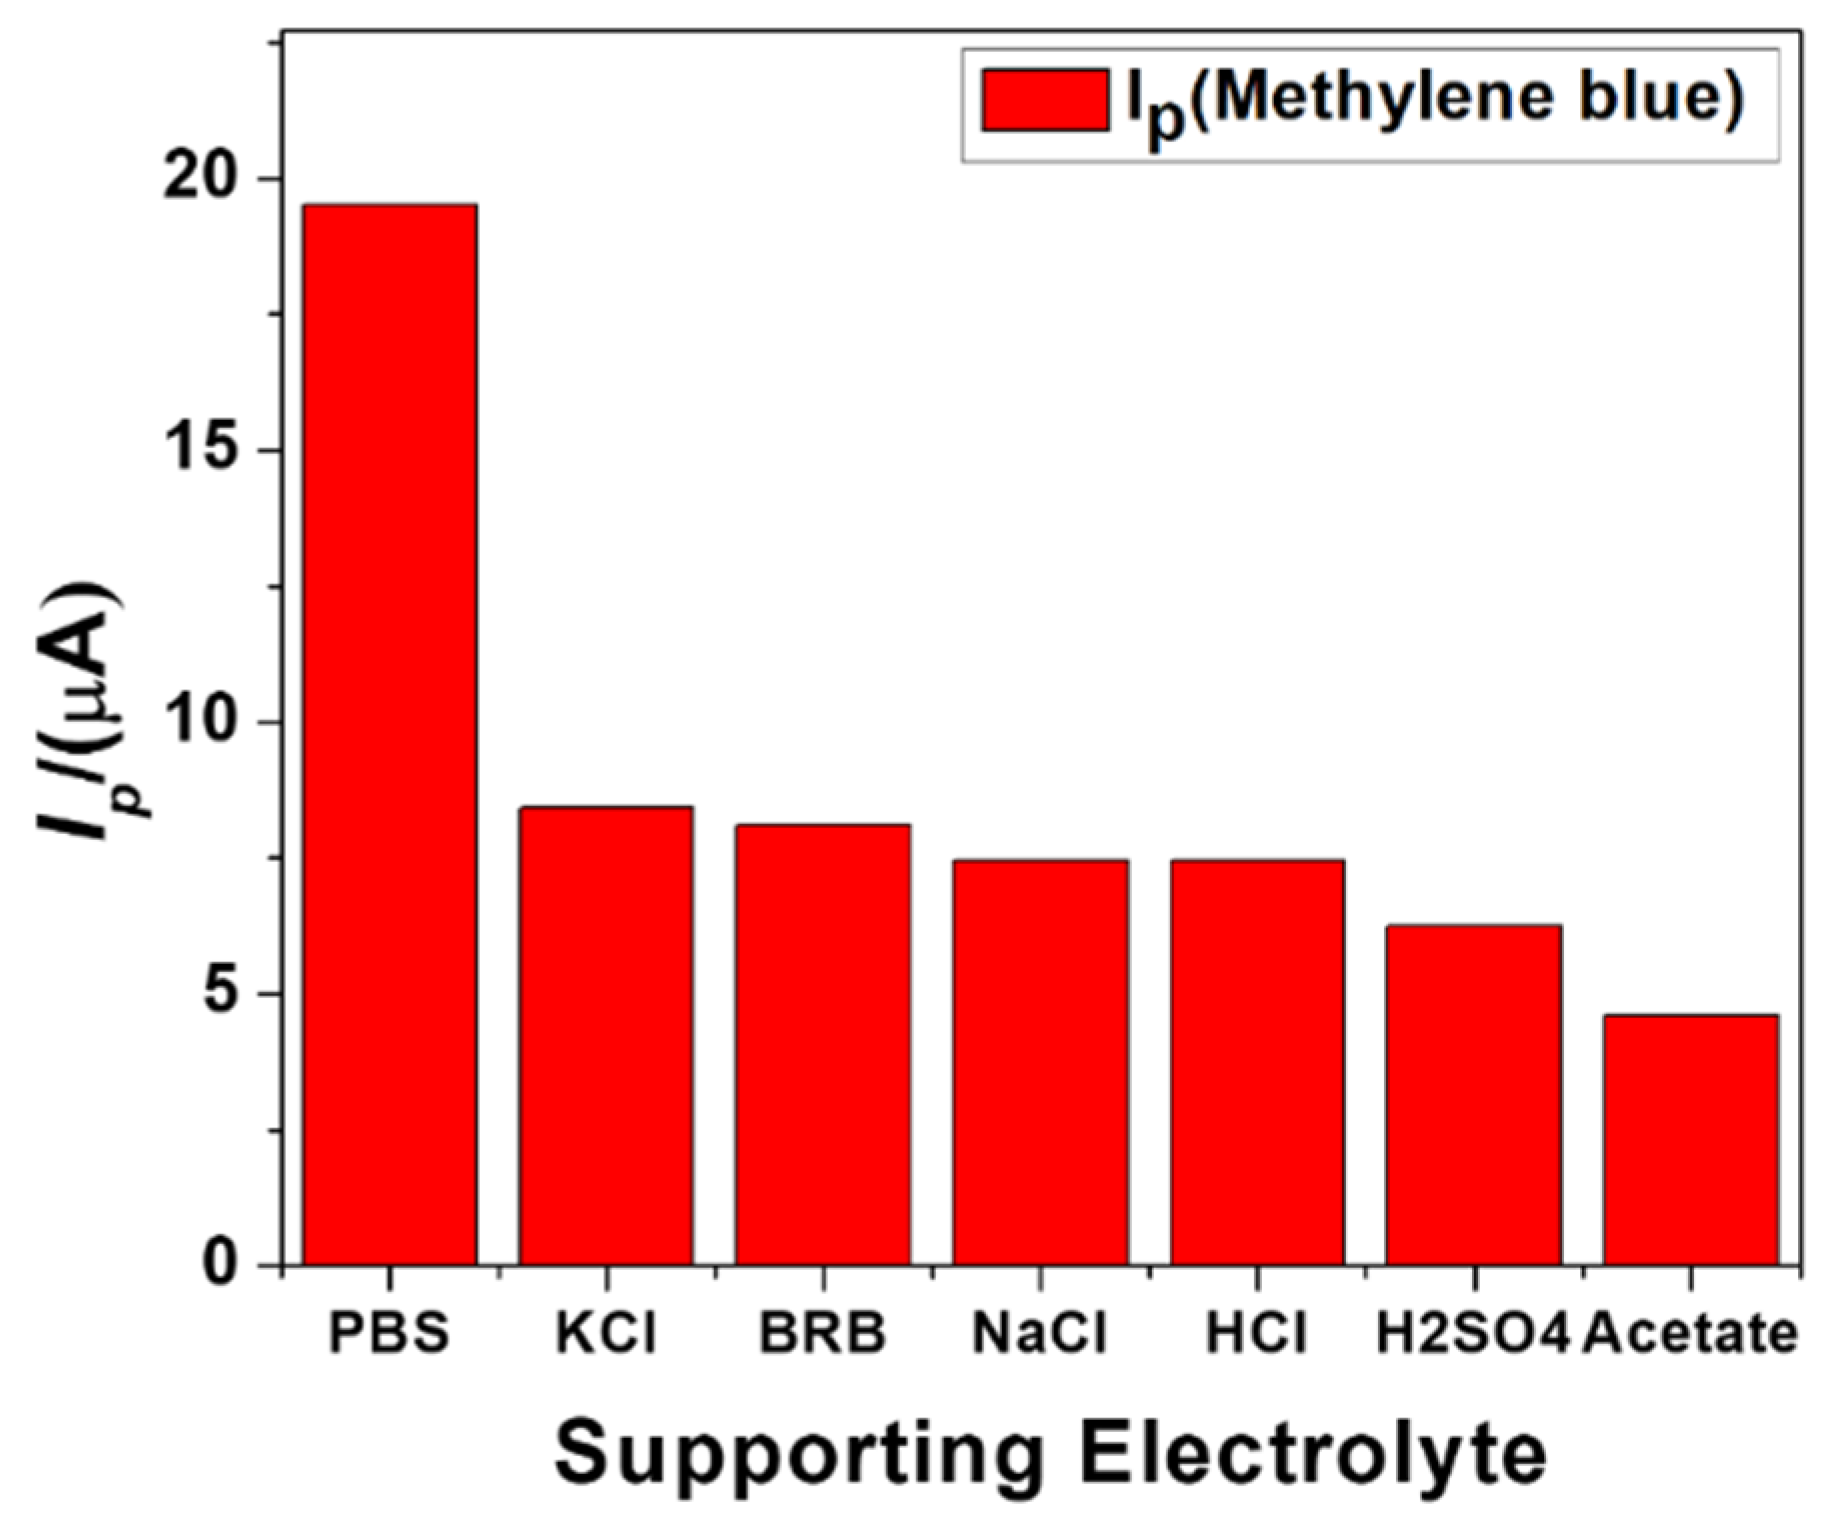
Figure 4.
Effect of the various electrolytes on peak current response of 10 μM MB at 125 mV/s scan rate, 5 s deposition time, and −0.5 V accumulation potential.
The effect of pH on the response of MB was investigated using PBS solutions of pH 3–9. The most intense signal was obtained in a medium of pH 6.0 as shown in Figure 5A. In an acidic electrolyte, the oxidation peak of methylene blue was decreased due to the high concentration of H+ ions. The reason could be the gain of protons from the solution by the electron-rich modifier (NH2-fMWCNTs) instead of MB. With the increase in pH of the medium, the availability of H+ competing with cationic MB should decrease in the solution and, as a result, modifier molecules are expected to interact with more MB molecules and thus preconcentrate them at the electrode surface. Hence, at the oxidation potential of MB, an intense anodic peak appears in the solution of pH 6. At a pH higher than 6, the availability of more OH− ions in the solution may hinder cationic MB molecules from accessing the electrode surface, and as a consequence, lower peak current MB is evidenced. Therefore, in a basic medium, the oxidation current of MB decreased significantly. The pH-dependent shift of the peak potential suggests the involvement of protons during electron transfer reactions. The ratio of the number of electrons and protons participating in the proton-coupled oxidation process was calculated from the plot of the peak potential as a function of pH using the equation ΔEp/ΔpH = 2.303 mRT/nF, where m/n is the ratio of protons and electrons. The Nernstian slope of 58 mV/pH as shown in Figure 5B was obtained by the linear fitting of the peak potential vs. the pH plot, which reveals an equal number of protons and electrons involved in the oxidation process of MB. The proposed oxidation mechanism of MB involving two electrons and two protons can be seen in Scheme 1.
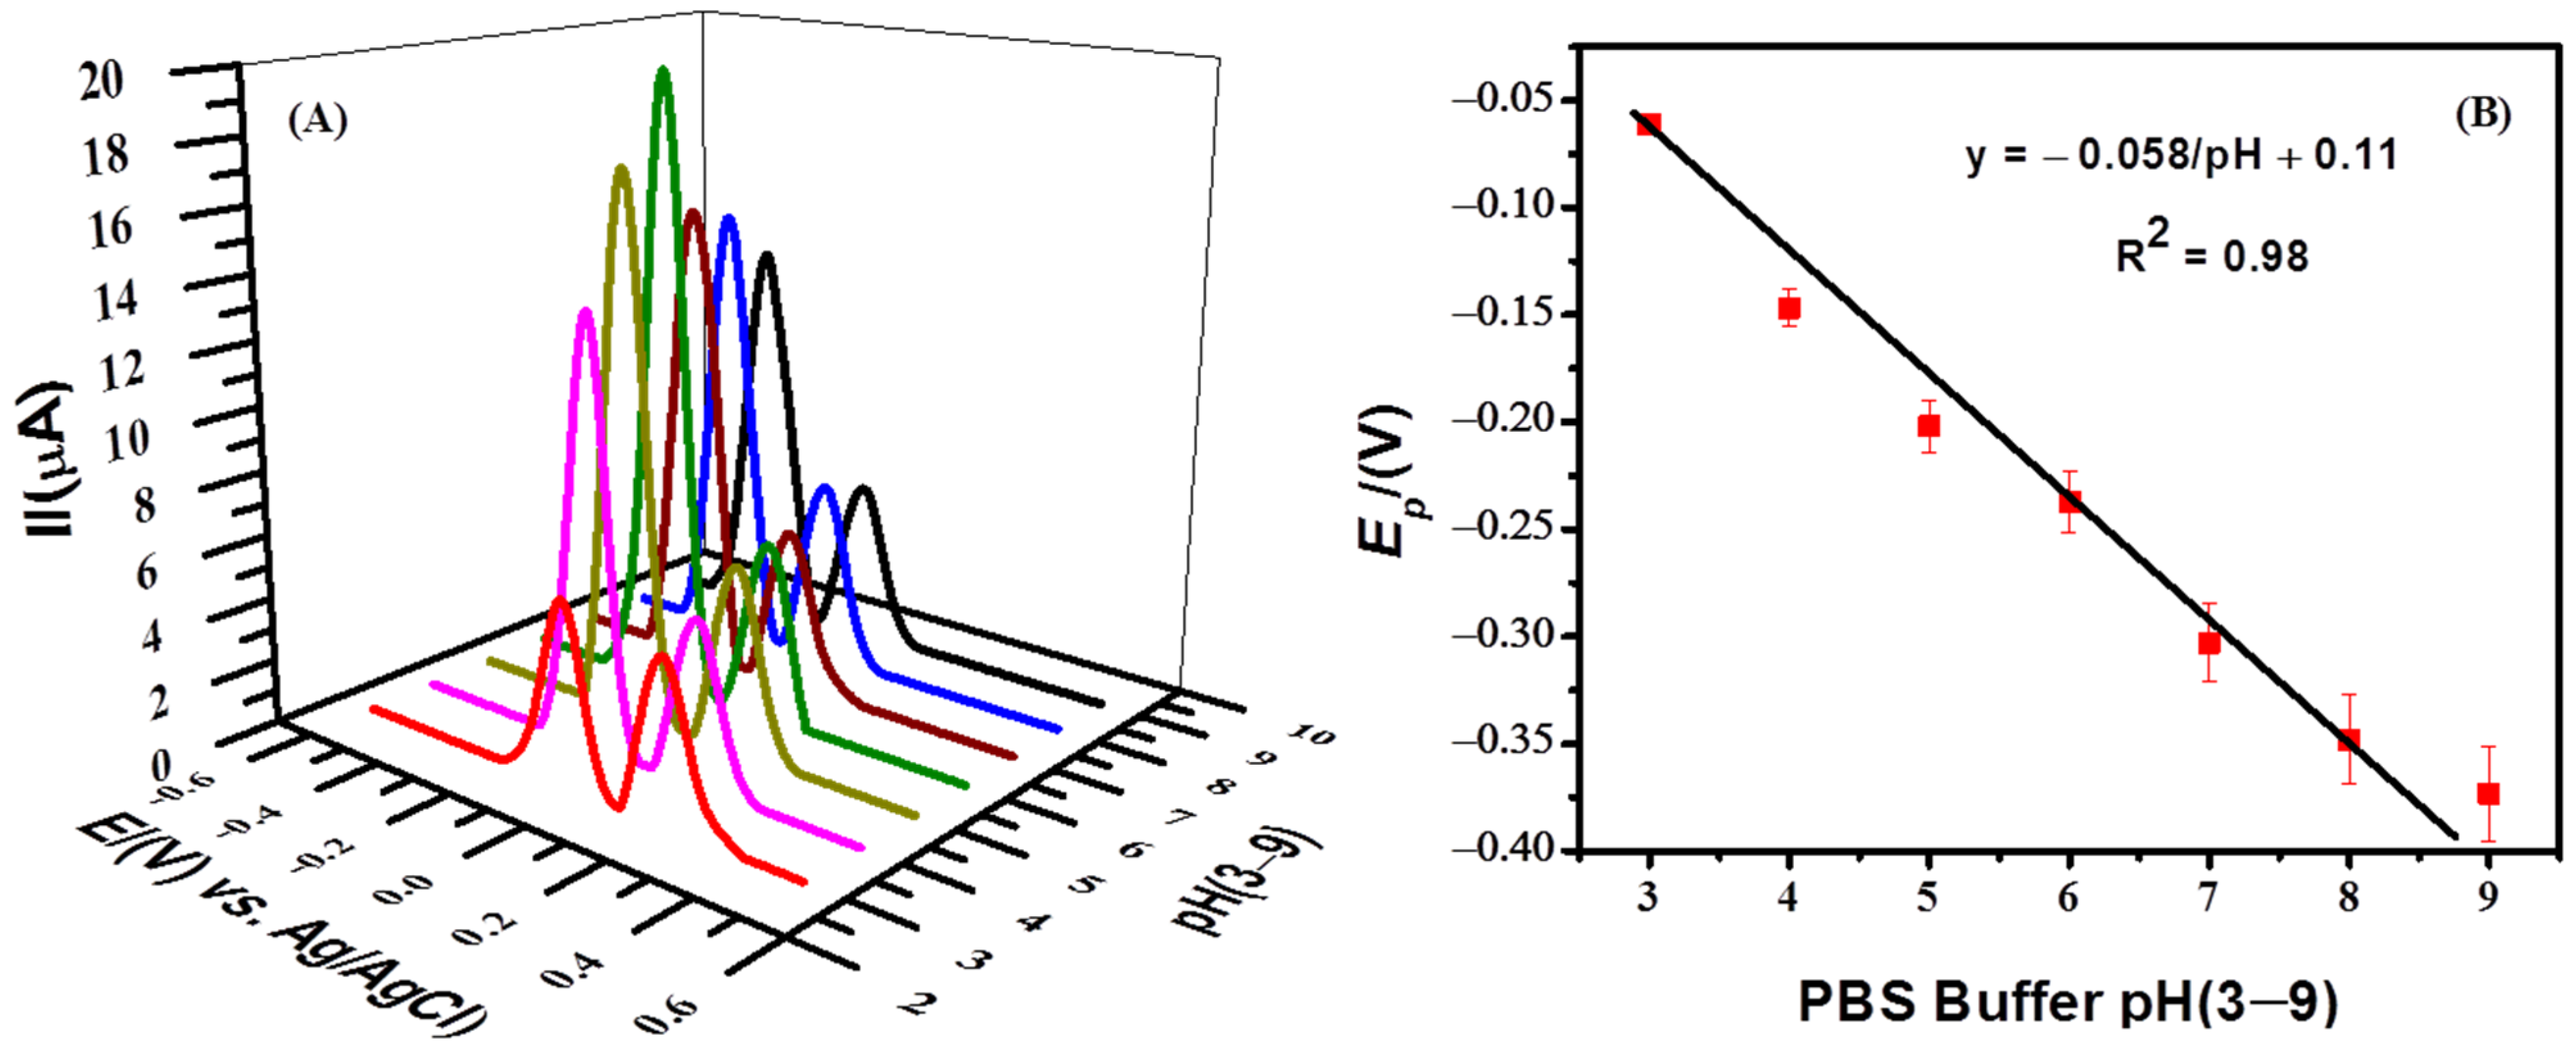
Figure 5. (A) SWV of 10 μM MB in PBS solutions of pH (3.0–9.0) obtained by using NH2-fMWCNTs/GCE as a working electrode with deposition time of 5 s and accumulation potential of −0.5 V. (B) Ep–pH plot of MB using data of Figure 5A at scan rate of 125 mV/s.
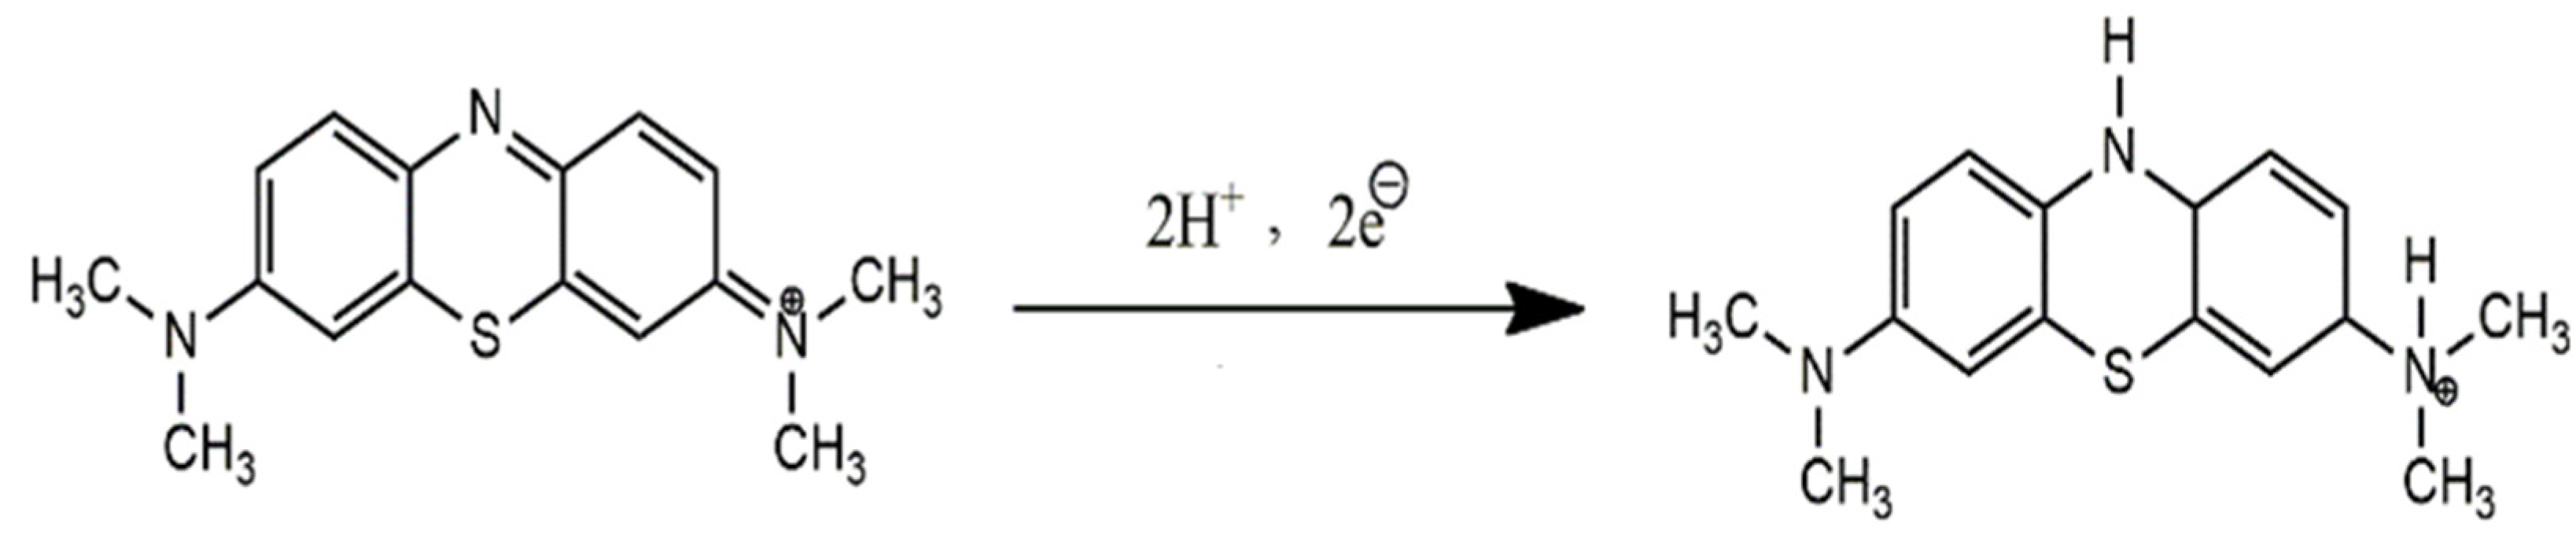
Scheme 1.
Proposed oxidation mechanism of MB at the NH
2
-
f
MWCNTs/GCE.
SWV was used to investigate the effect of the deposition potential and time on the peak current of 10 μM MB. The signal intensity was found to increase by increasing the negative potential up to −0.3 V. With the increase in negative potential, cationic dye molecules are expected to bind strongly to the anionic modifier NH2-fMWCNTs. The effect of deposition time on the response of MB was also investigated. At an accumulation time of 60 s, the maximum current response, can be related to the effective orientation of preconcentrated molecules at the modified GCE. Therefore, in the subsequent experiments, a 60 s accumulation time was chosen for the analytical detection of the targeted analyte.
5. Analytical Characterization
The designed sensor was applied for the determination of MB up to its lowest limit of detection by using square wave voltammetry. The concentration-based voltammograms of MB are shown in Figure 6A. A linear calibration curve plotted between the peak current and concentration (0.01 μM to 0.5 μM) can be seen in Figure 6B. The limit of detection (LOD = 3 σ/m) and limit of quantification (LOQ = 10 σ/m) of the targeted analyte were evaluated from the calibration plot by applying IUPAC guidelines [47][7]. The standard deviation represented by σ was calculated by the current values (n = 11) of the blank solution at the peak position of the analyte [48][8]. The calculated limit of detection and limit of quantification of MB are 0.21 nM and 0.70 nM, respectively. Table 1 shows the comparison of MB sensors and reveals figures of merit of our designed sensing platform.
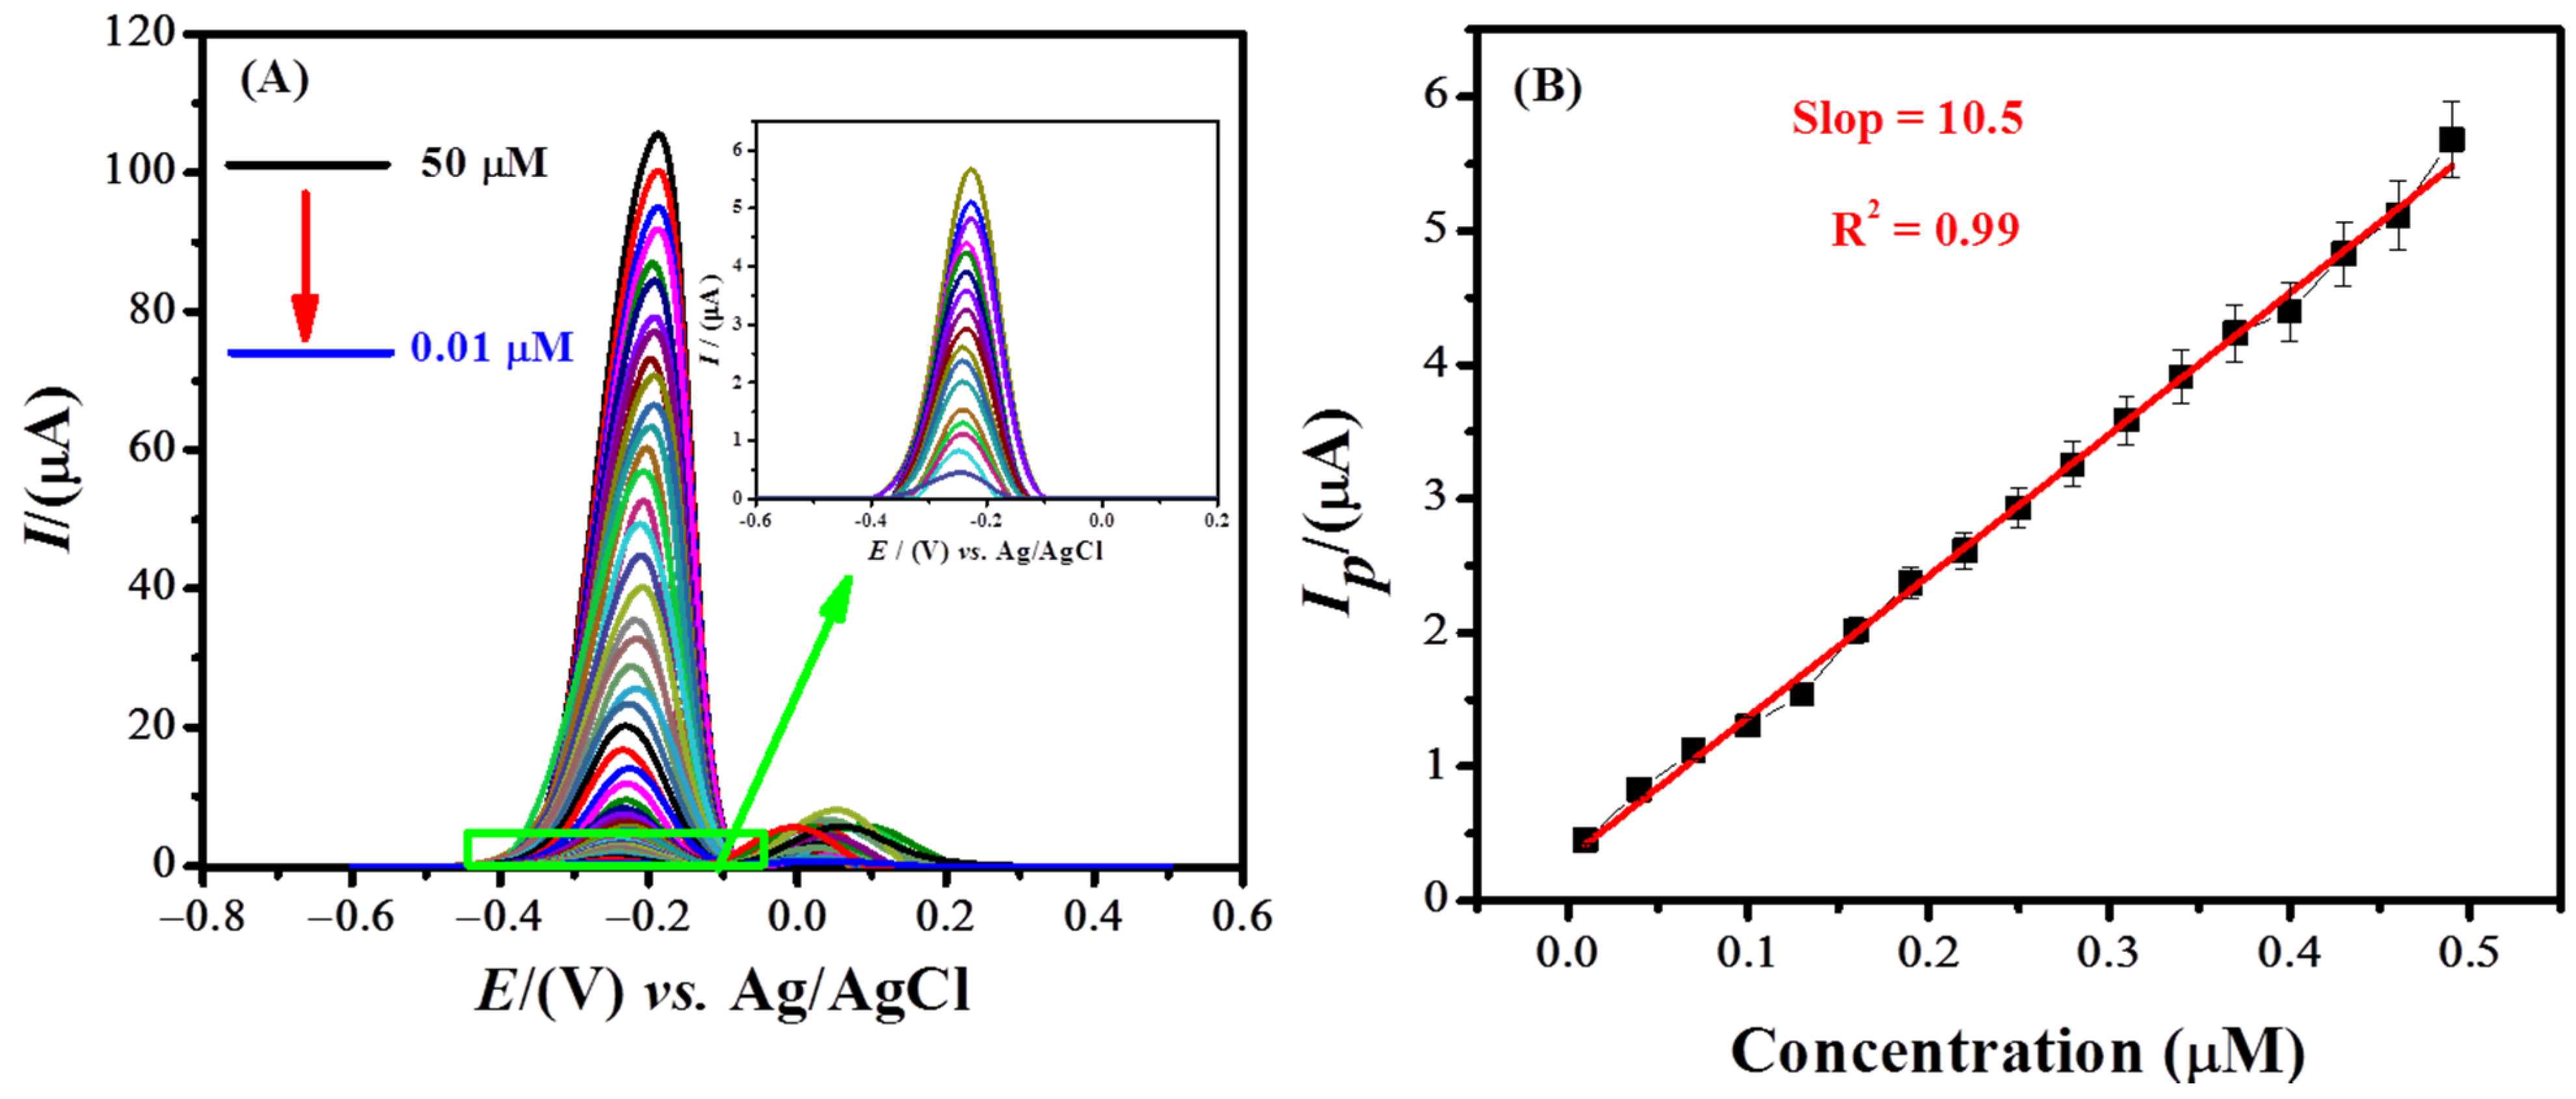
Figure 6. (A) Square wave voltammograms of the MB solution of different concentrations using NH2-fMWCNTs/GCE under optimized conditions (0.1 M PBS (pH = 6.0), deposition potential = −0.3 V, deposition time = 60 s). (B) Calibration plot in a concentration range of 0.5 μM to 0.01 μM.
Table 1.
Methylene blue sensors and their performance parameters.
6. Validity of the Designed Sensor
Reproducibility and repeatability are the key factors for assessing the validity of a sensor. For the reproducibility test, we prepared four modified GCEs under the same conditions and applied these for recording SW voltammograms of MB under optimized conditions. On all four electrodes, the oxidation peak current of MB was almost the same, with an RSD value of 1.27%, as shown in Figure 7A. The repeatability of the designed sensor was also examined under optimized conditions. For this purpose, one electrode was prepared with NH2-fMWCNTs as a sensing platform and the same electrode was repeated several times for sensing experiments of MB. The peak current remained almost the same in all six experiments as shown in Figure 7B. Thus, the designed sensor showed inter-day repeatability and stability up to 20 h with an RSD value of 2.3%.
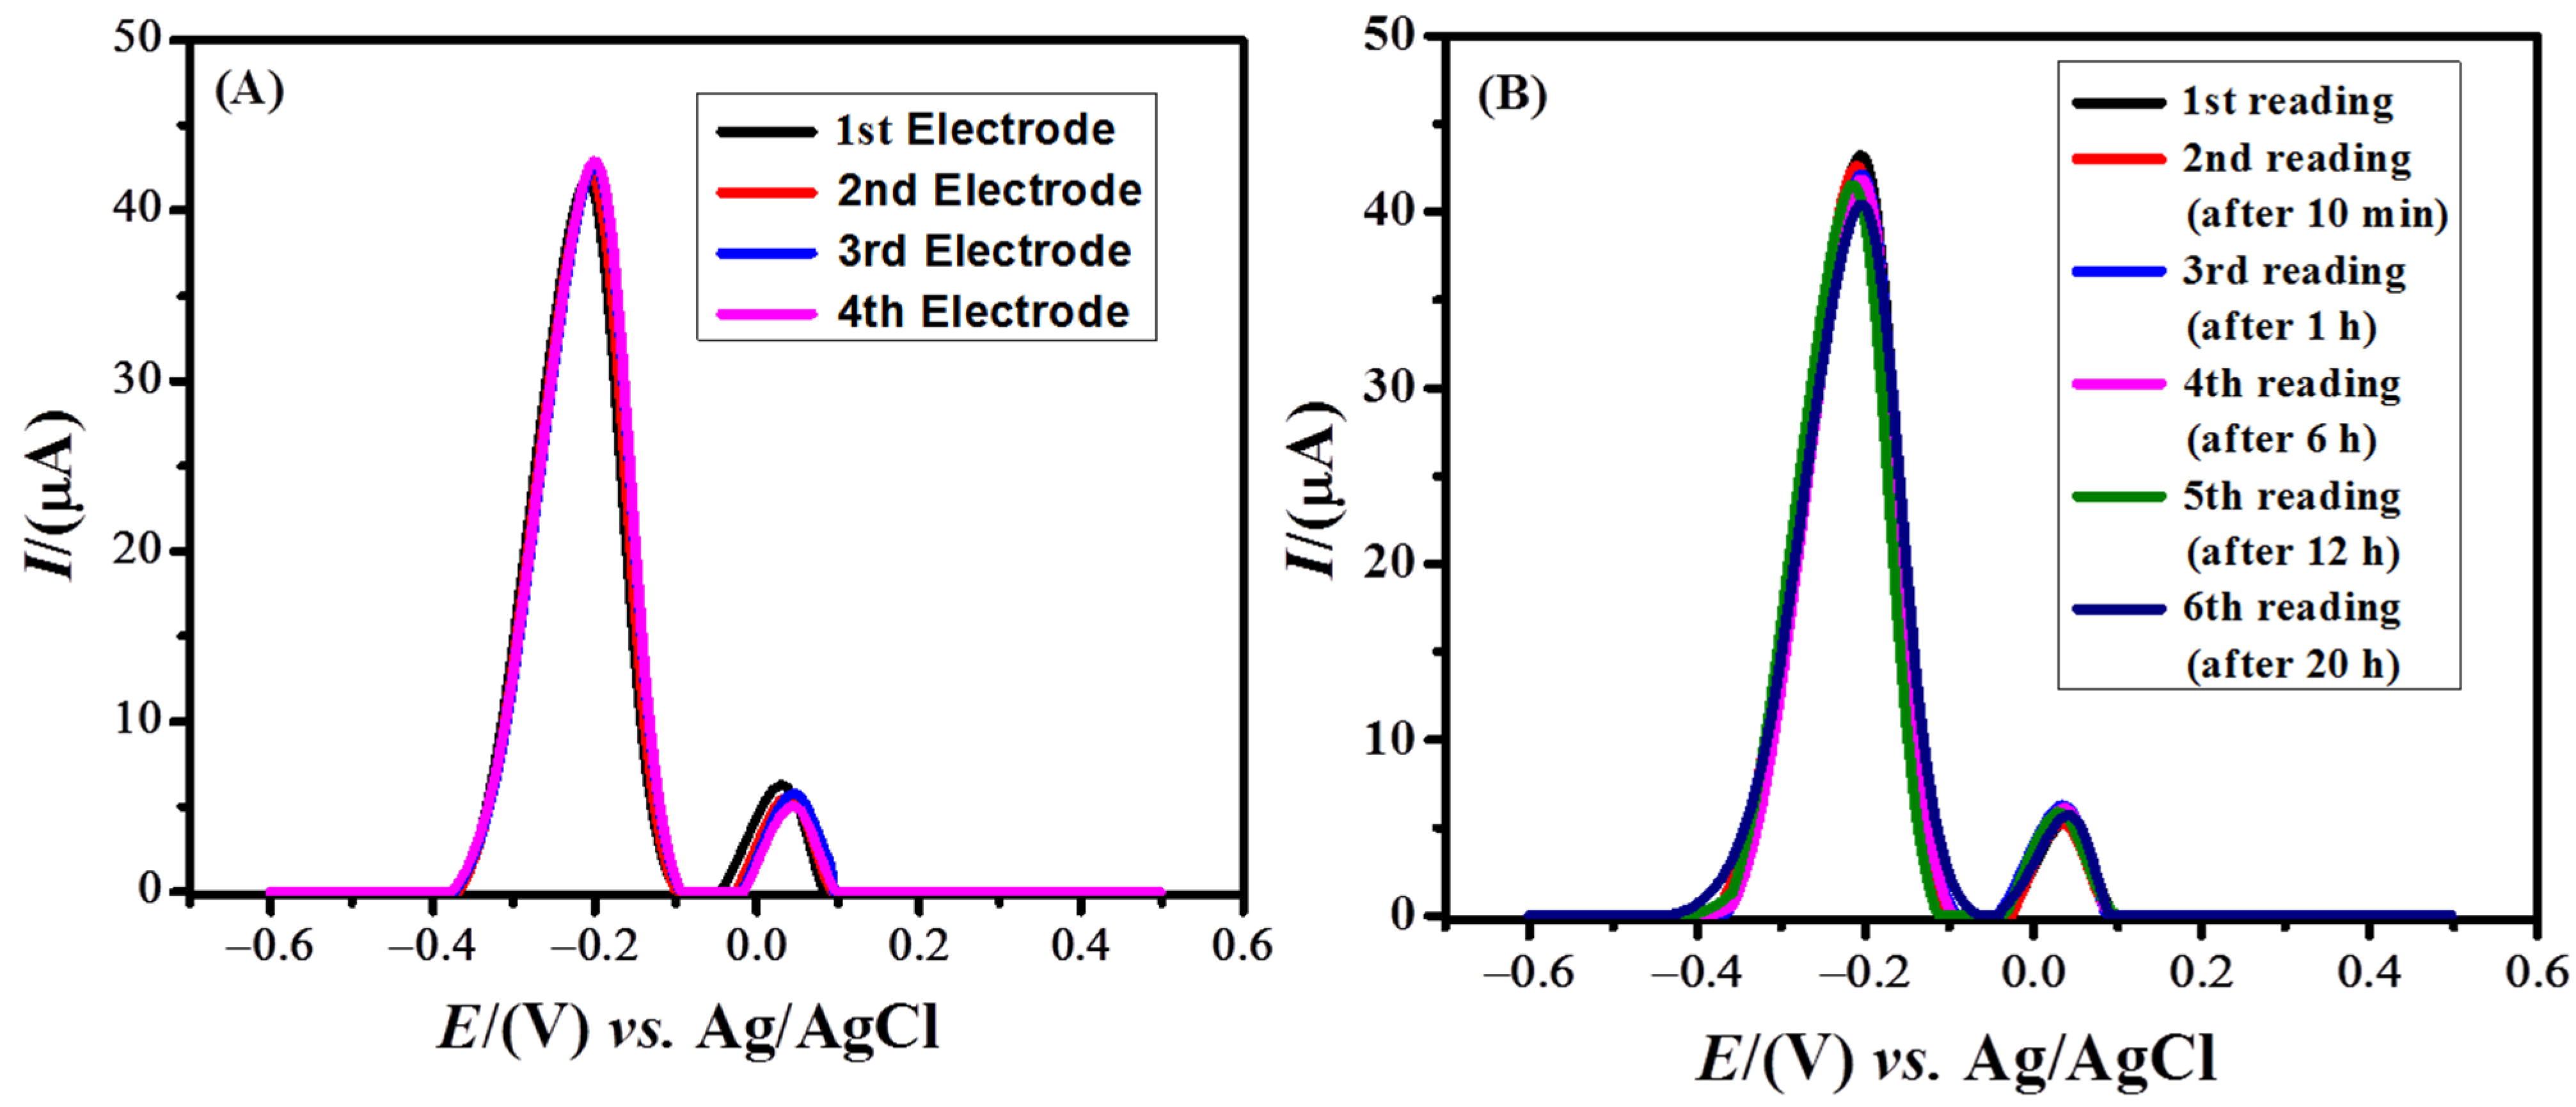
Figure 7.
(
A
) Square wave voltammograms of MB showing the reproducibility and (
B
) SWV of MB showing repeatability of the developed sensor in PBS of pH of 6.
7. Degradation Study of MB on the Designed Electrochemical Sensor
The photocatalytic degradation of MB by TiO2 nanoparticles was investigated in an electrochemical cell. A stock solution of 0.1 mM MB (pH = 13.0) was prepared. Fifty milliliters of the stock solution were added to a beaker, to which 10 mg of TiO2 nanoparticles were added. This was then stirred for 10 min in the dark. Ten microliters of the as-prepared solution were drop-casted onto the modified GCE (NH2-fMWCNTs/GCE) and subsequently dried. The influence of pH on the photodegradation of MB was studied. The breakdown of dye was found to occur faster in basic conditions. [52][12] Therefore, photodegradation experiments were conducted in an alkaline medium using 0.3 M NaOH solution as the supporting electrolyte. The voltammogram of the MB was recorded under optimized conditions by employing a modified electrode under direct sunlight. At intervals of every 3 min, the same procedure was followed as described above. The corresponding voltammograms for the photodegradation of MB are shown in Figure 8A. The concentration of the dye in the solution decreased over time due to degradation, and as a result, a decrease in the peak current was observed. Initially, the peak current decreased more rapidly, indicating faster loss of electrophores (moiety of the MB molecule undergoing oxidation) present in the dye structure. The overall degradation percentage of MB was calculated using Equation (1).
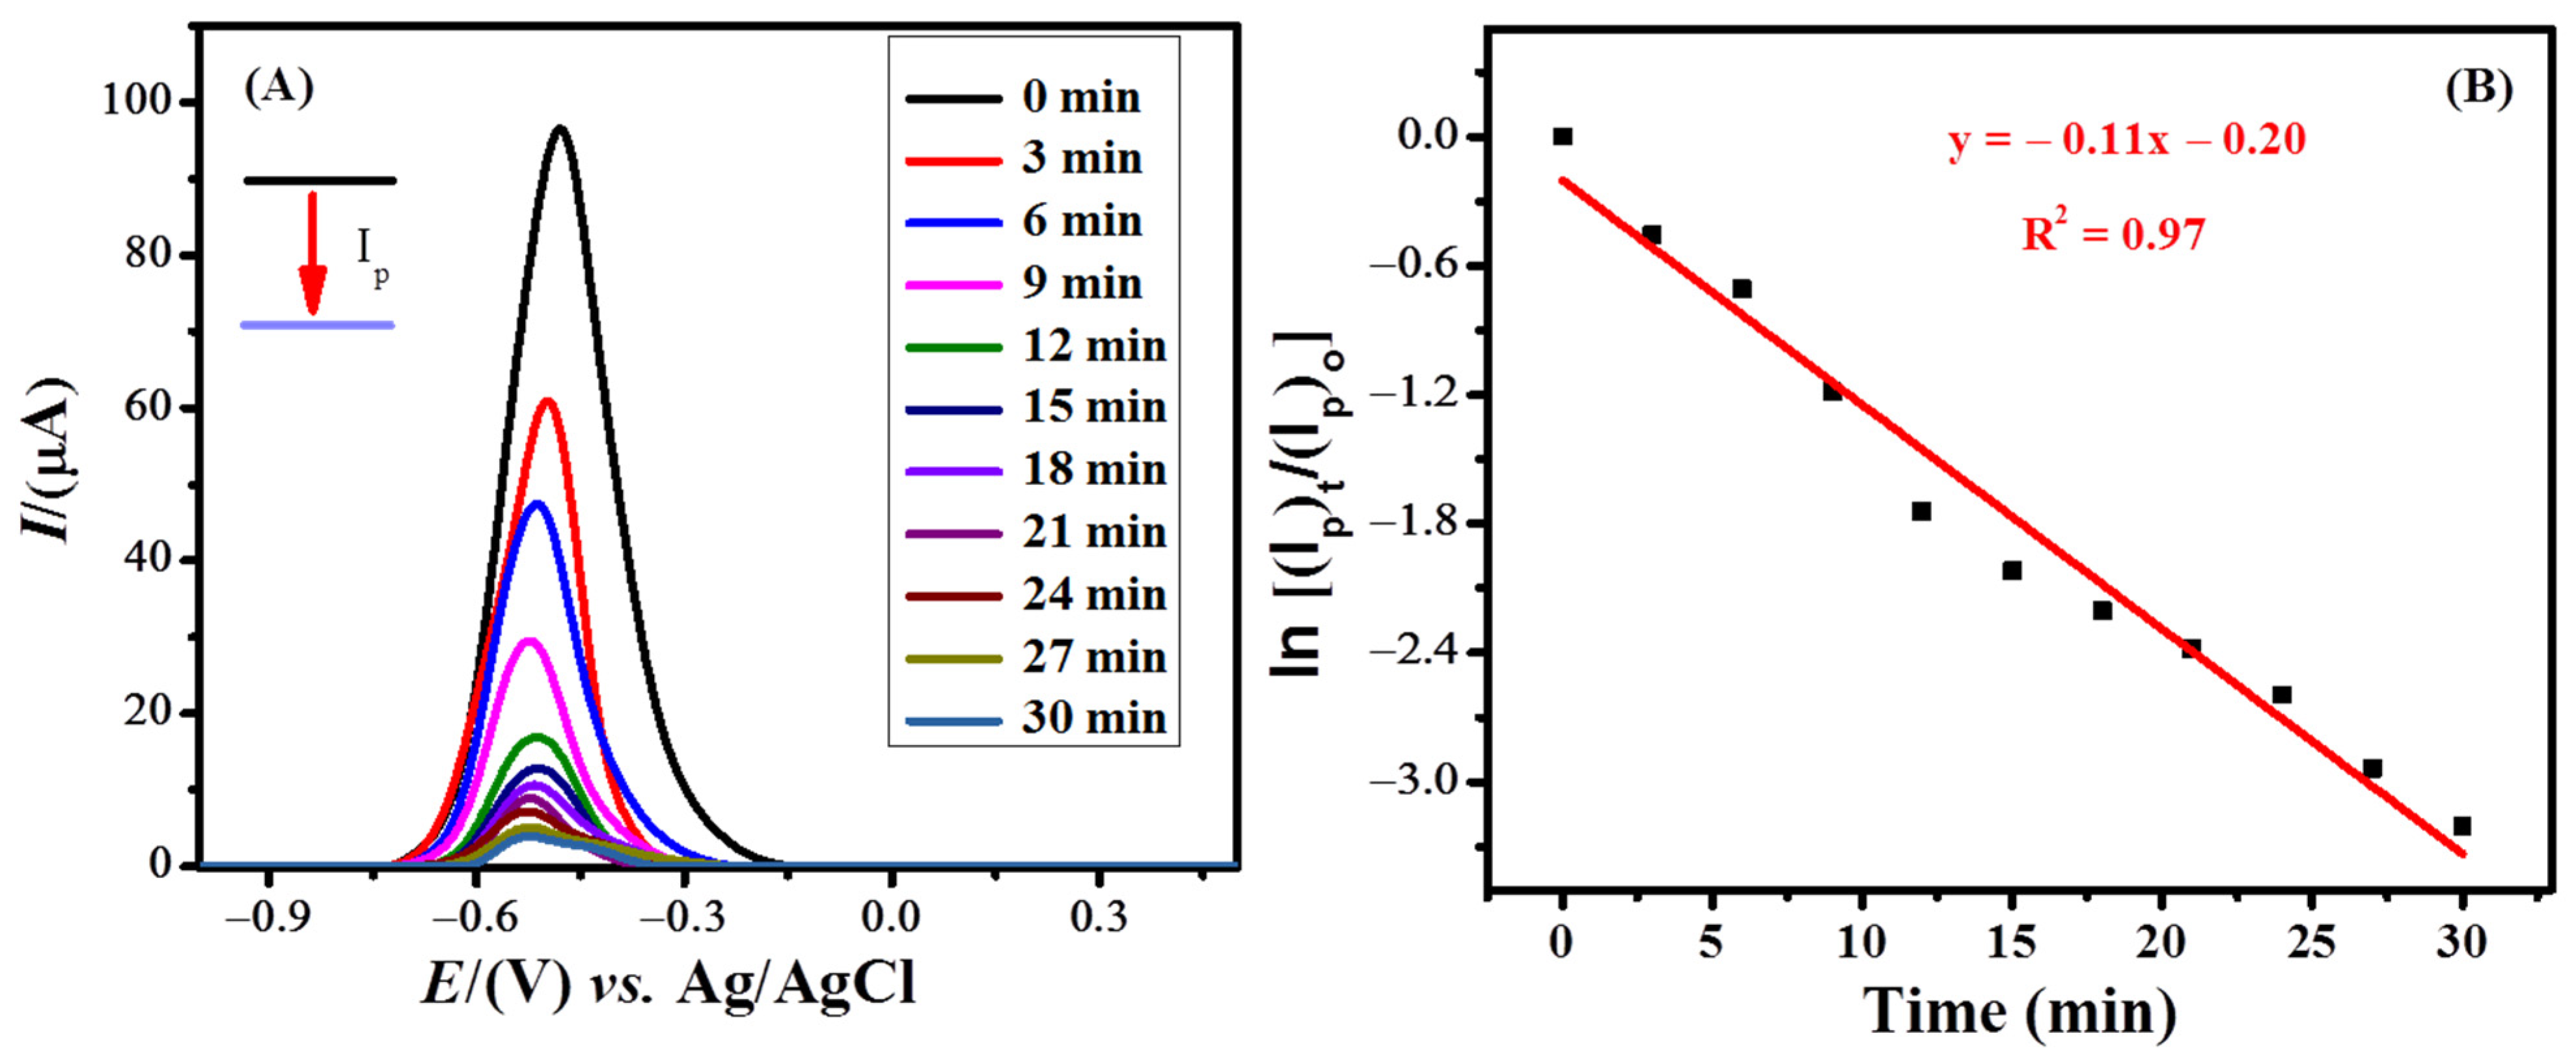
Figure 8. (A) SW voltammograms of the photocatalytic degradation of MB on NH2-fMWCNTs/GCE using TiO2 nanoparticles under deposition potential of −0.3 V and deposition time of 60 s. (B) A linear plot showed first-order kinetics of the photocatalytic degradation of methylene blue.
The % degradation was calculated to be 95.9%. The kinetics of MB degradation was also investigated. The rate constant (k) with a value of 0.11 min−1 was calculated from the plot between ln[(Ip)t/(Ip)o] and time using the equation of first-order kinetics (Figure 8B).
8. Spectrophotometric Study of the Degradation of MB
Time-based UV-visible spectra of the irradiated MB solution containing titania nanoparticles were recorded. Figure 9A shows a decrease in the absorption spectra of MB over time. The diminution in the absorption spectra corresponds to the degradation of MB by TiO2 nanoparticles under sunlight. The study was conducted in basic conditions to determine the influence of irradiation time on the photocatalytic degradation of MB. The increase in radiation time of sunlight caused an increase in the photodegradation of dye molecules. Over a time span of 30 min, the maximum degradation (98.1%) was observed. The order of the reaction was ensured from the linearity of the plot between ln (Ct/C0) and the irradiation time (Figure 9B) using a first-order equation (ln(Ct/Co) = −kt), where Co represents the absorbance at time 0 and Ct is the absorbance at time t. The rate constant with a value of 0.12 min−1 was calculated from the slope of the first-order kinetic plot.
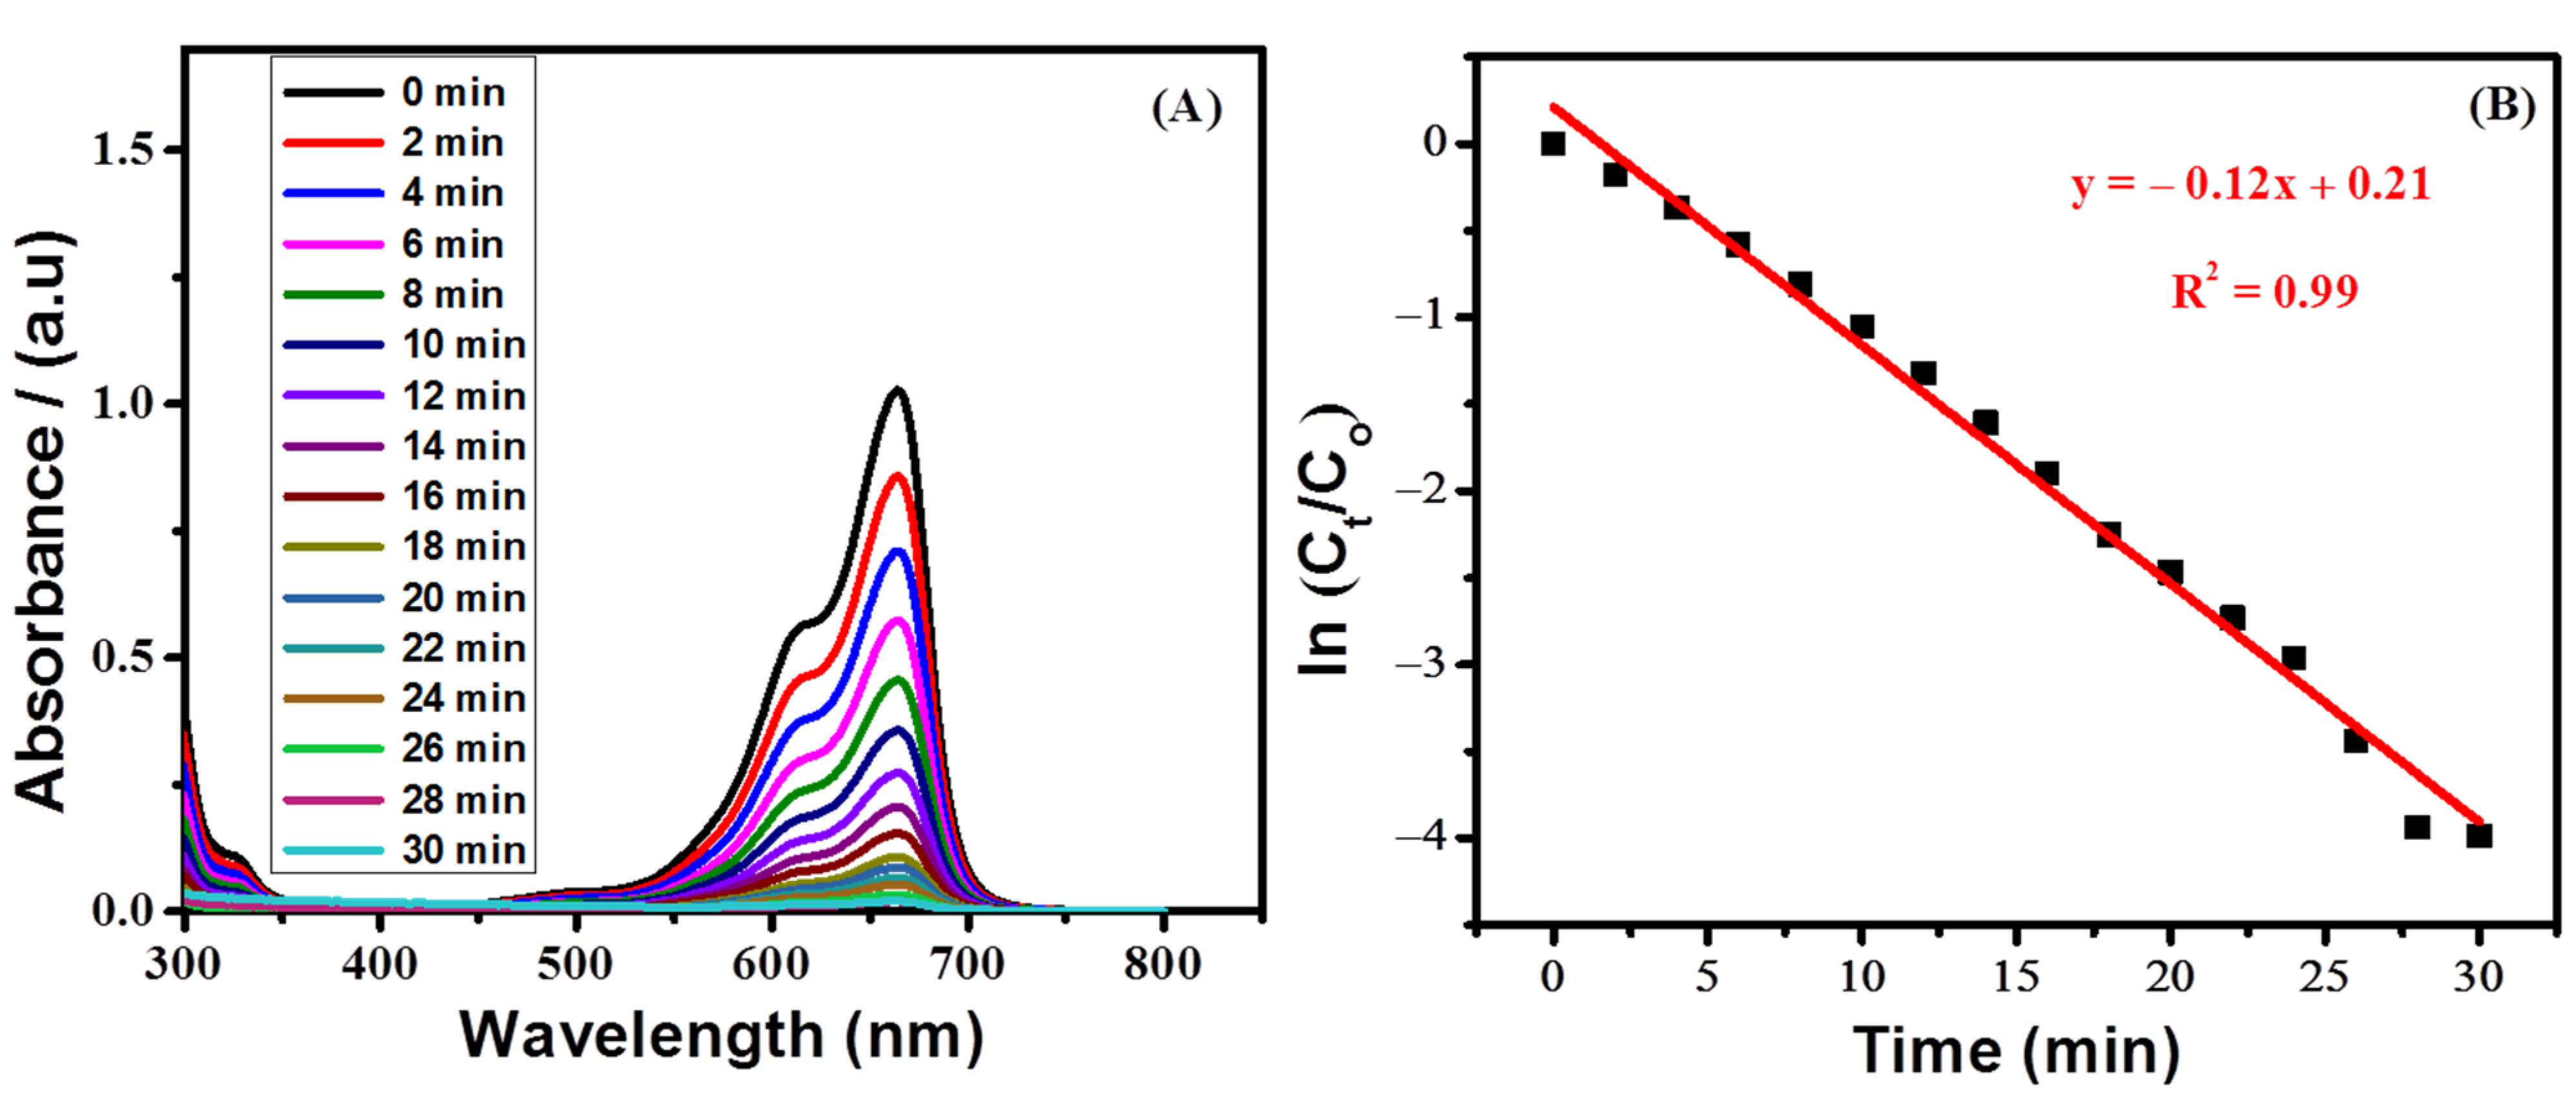
Figure 9. (A) UV-visible spectra showing photodegradation of 0.1 mM methylene blue in the presence of TiO2 nanoparticles (B) Plot showing first-order kinetics of the photocatalytic degradation of methylene blue under basic conditions.
References
- Sacco, A. Electrochemical impedance spectroscopy: Fundamentals and application in dye-sensitized solar cells. Renew. Sustain. Energy Rev. 2017, 79, 814–829.
- Macdonald, J.R.; Johnson, W.B. Chapter 1: Theory, experiment, and applications, Fundamentals of Impedance Spectroscopy. In Impedance Spectroscopy, 3rd ed.; Barsoukov, E., Macdonald, J.R., Eds.; John Wiley & Sons Inc.: Hoboken, NJ, USA, 2018.
- Amin, M.A.; Abd El-Rehim, S.S.; El-Sherbini, E.; Bayoumi, R.S. The inhibition of low carbon steel corrosion in hydrochloric acid solutions by succinic acid: Part I. Weight loss, polarization, EIS, PZC, EDX and SEM studies. Electrochim. Acta 2007, 52, 3588–3600.
- Randviir, E.P.; Banks, C.E. Electrochemical impedance spectroscopy: An overview of bioanalytical applications. Anal. Methods 2013, 5, 1098–1115.
- Mohajeri, S.; Dolati, A.; Rezaie, S.S. Electrochemical sensors based on functionalized carbon nanotubes modified with platinum nanoparticles for the detection of sulfide ions in aqueous media. J. Chem. Sci. 2019, 131, 1–18.
- Zahid, A.; Lashin, A.; Rana, U.A.; Al-Arifi, N.; Ullah, I.; Dionysiou, D.D.; Qureshi, R.; Waseem, A.; Kraatz, H.-B.; Shah, A.J.E.A. Development of surfactant based electrochemical sensor for the trace level detection of mercury. Electrochim. Acta 2016, 190, 1007–1014.
- Belter, M.; Sajnóg, A.; Barałkiewicz, D. Over a century of detection and quantification capabilities in analytical chemistry—Historical overview and trends. Talanta 2014, 129, 606–616.
- Kokab, T.; Shah, A.; Nisar, J.; Khan, A.M.; Khan, S.B.; Shah, A.H. Tripeptide Derivative-Modified Glassy Carbon Electrode: A Novel Electrochemical Sensor for Sensitive and Selective Detection of Cd2+ Ions. ACS Omega 2020, 5, 10123–10132.
- Soto, P.; Salamanca Neto, C.; Moraes, J.; Sartori, E.; Bessegato, G.G.; Lopes, F.; Almeida, L. A novel sensing platform based on self-doped TiO2 nanotubes for methylene blue dye electrochemical monitoring during its electro-Fenton degradation. J. Solid State Electrochem. 2020, 24, 1951–1959.
- Tonlé, I.K.; Ngameni, E.; Tcheumi, H.L.; Tchiéda, V.; Carteret, C.; Walcarius, A. Sorption of methylene blue on an organoclay bearing thiol groups and application to electrochemical sensing of the dye. Talanta 2008, 74, 489–497.
- Hassan, S.S.; Nafady, A.; Solangi, A.R.; Kalhoro, M.S.; Abro, M.I.; Sherazi, S.T.H. Ultra-trace level electrochemical sensor for methylene blue dye based on nafion stabilized ibuprofen derived gold nanoparticles. Sens. Actuators B Chem. 2015, 208, 320–326.
- Zhang, W.; Huo, C.; Hou, B.; Lin, C.; Yan, X.; Feng, J.; Yana, W. Secondary particle size determining sedimentation and adsorption kinetics of titanate-based materials for ammonia nitrogen and methylene blue removal. J. Mol. Liq. 2021, 343, 117026.
More