Your browser does not fully support modern features. Please upgrade for a smoother experience.
Please note this is a comparison between Version 1 by Ben Qi and Version 4 by Jason Zhu.
Fault diagnosis plays an important role in complex and safety-critical systems such as nuclear power plants (NPPs). With the development of artificial intelligence (AI), extensive research has been carried out for fast and efficient fault diagnosis based on data-driven algorithms. We discuss single-algorithm-based techniques such as ANN, SVM, PCA, DT, and clustering, as well as hybrid techniques that combine algorithms together.
- fault diagnosis
- artificial intelligence
- data-driven
1. Introduction
The data-driven fault diagnosis method for nuclear power plants can be regarded as a combination of a “data base” and an “inference machine”. The “data base” is defined as the massive data resources required by the method, which should be distinguished from the concept of the database in the computer field. Additionally, the “inference machine” refers to a trained model based on large amounts of data, which is different from knowledge-driven “inference machines”. The application of data-driven fault diagnosis methods in the nuclear field can be divided into two types: single algorithms and hybrid algorithms. Most hybrid algorithms are improved based on single algorithms and have stronger diagnostic performance.
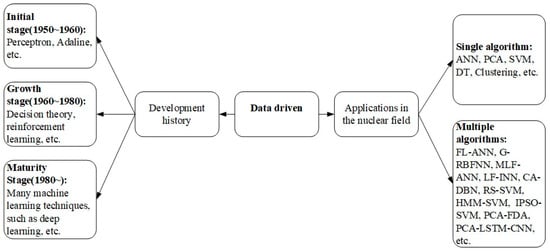
Figure 1. History of data-driven development and its application in the nuclear field.
2. Fault Diagnosis Methods Based on Single Algorithms
2.1. Artificial Neural Network
Artificial neural networks (ANNs) are mathematical models that mimic the structure and function of biological neural networks. They are used to approximate or evaluate functions [1][127]. An ANN is a system that can learn and summarize existing data to produce a system that can be automatically identified. The most common artificial neural network is a back propagation neural network (BPNN), which consists of an input layer, one or more hidden layers, and an output layer in which neurons are connected by weights. Each neuron contains two transformation steps internally [2][3][4][128,129,130]. First, the weighted sum of all input values connected to that neuron is calculated. Second, the weighted sum is nonlinearly transformed using an activation function.
The training process of a BPNN is as follows: when a BPNN obtains a learning sample, the sample is transmitted from the input layer through the hidden layer to the output layer, which is the input response of the network. If the network fails to obtain the expected target output in the output layer, the error signal will enter the back-propagation phase and return to the input layer along the original connection path. The error signal can be reduced by modifying the weights of each layer. When errors are propagated repeatedly, the correct prediction of the output layer increases. The back-propagation process is stopped until the error is sufficiently small, and then a mapping is created between the input and output to obtain a model with predictive or diagnostic capabilities. With the development of technology, artificial neural networks have developed in various forms. The network architecture can be divided into three types: feed-forward neural networks [5][131], recurrent neural networks [6][132], and reinforcement networks [7][133].
Since artificial neural networks can handle complex multimodal, associative, inferential, and memory functions, this matches the fault diagnosis of complex nuclear power systems. The fault diagnosis method based on a neural network is to establish a mapping of the fault diagnosis based on the training data. The trained network is then used for new observations to judge anomalies. Zwingelstein et al. first applied the BPNN to the fault diagnosis of NPPs and preliminarily verified the feasibility [8][9][10][60,134,135]. In addition to BPNNs, such as recurrent neural networks (RNNs) [11][136], improved BPNNs [12][137], self-organizing neural networks [13][138], and Hopfield neural networks [14][139] have all been studied in applications. In general, research based on neural networks is mostly in the preliminary validation phase. The combination of neural networks with other algorithms for diagnosis is the mainstream trend. The related content will be presented in Section 2Section 4.2.2.
2.2. Support Vector Machine
The basic idea of support vector machines (SVMs) is to divide data into different categories using a hyperplane formed by formulas. Taking the simplest two classifications as an example, the formula represents different hyperplanes. For a linearly separable dataset, w⋅x+b=1and w⋅x+b=−1denote the two boundaries of the hyperplane. All hyperplanes that can divide the dataset into two classes are within these two boundaries. Among all hyperplanes, the goal of SVM is to find an optimal decision boundary that is farthest from the nearest samples of different classes, that is, to obtain the most robust classification hyperplane. Since the nuclear power plant operation data are nonlinear, it is not possible to establish the hyperplane by the same method. The solution is to map the data from the low-dimensional space to the high-dimensional space and find the optimal hyperplane in the high-dimensional space, and the kernel function is the core of the method. More detailed principles about SVM can be found in [7][9][10][133,134,135].
Gottlieb et al. first used support vector machines for the diagnosis of NPP accidents and verified the feasibility of SVM for data classification [10][135]. Zio et al. used support vector machines in the diagnosis of subsystems such as feed water system [11][136], first-loop system [12][137], and other components of abnormal monitoring [13][14][138,139]. Kim et al. used support vector machines to predict the times of serious accidents to help operators better manage accidents [15][140]. Abiodun et al. established diagnostic models for different components of NPPs in the form of a support vector set for early fault diagnosis [16][141]. As with neural network methods, NPP fault diagnosis relying on SVM alone has been less studied. As a fundamental method, the current research involving SVMs is more in the area of hybrid algorithms, which will be presented in subsequent sections.
2.3. Decision Tree
The decision tree is a tree structure learned from data. The decision tree is based on a tree structure to make decisions. It selects one of several attributes of the training samples for determination each time and assigns the samples to different sets according to their values on that attribute, after which the next round of decisions is made until all the samples in the same set belong to the same class. Decision trees usually have three steps: feature selection, generation of decision trees, and pruning of decision trees. when using a decision tree for fault diagnosis, the fault feature parameters are tested starting from the root node, and the fault samples are assigned to their internal nodes based on the test results. Each internal node corresponds to a value of that feature, so the samples are tested and assigned recursively until they reach the leaf node, which is the type of fault. In fact, for complex industrial systems such as nuclear power plants, overly complex decision trees will lead to poor generalization performance. Readers can find more detailed information in [15][16][17][18][140,141,142,143].
In the field of NPP fault diagnosis, decision trees are more intuitive and explanatory than other algorithms, but pure decision-tree-based fault diagnosis is less applied. Yu et al. first used a decision tree in the fault diagnosis of NPP and compared and combined it with other algorithms [19][20][21][63,144,145]. Sharanya et al. used decision trees for the diagnosis of cooling tower faults in NPPs. Based on the comparison of several algorithms, they concluded that decision trees have the potential to be combined with other algorithms to construct hybrid models [22][146].
2.4. Principal Component Analysis
Principal component analysis (PCA) is a statistical method that converts a set of potentially correlated variables into a set of linearly uncorrelated variables called principal components through an orthogonal transformation. PCA is often used for data dimensionality reduction. The first step is to move the center of the axes to the center of the data and then rotate the axes to maximize the variance of the data on the C1 axis to retain more information, where C1 is the first principal component. The second step is to find the second principal component C2 so that it has a covariance of 0 with C1 to avoid overlapping with C1 information and maximize the variance of the data in that direction. The third step is to use the same steps as the second step to continue to find the next principal component. Data containing m variables can have up to m principal components. More detailed principles of principal component analysis can be found in [23][24][25][147,148,149].
In the field of NPP fault diagnosis, PCA is generally used for fault monitoring. Lu et al. used PCA in the fault diagnosis of steam generators to extract the main features of faults and quantify the accuracy of fault identification by projecting normalized vectors into the fault space [23][24][147,148]. Zhao et al. used PCA for steam generators and considered the uncertainty of the simulation model, which improved the robustness of the PCA model diagnosis [25][149]. Wei et al. used the PCA method for status monitoring of the sensor in NPPs and calculated the non-detection area of the sensor in the model, which expanded the fault diagnosis scope of the PCA model [26][27][28][29][30][150,151,152,153,154]. Yu et al. proposed an improved PCA model to improve the diagnostic accuracy and the diagnostic capability of multi-sensors [31][32][155,156]. Zhang et al. systematically studied the fault detection performance of various PCA methods [33][157]. In addition, most of the fault diagnosis methods use PCA as a pre-technology to reduce the data dimension to improve the diagnostic performance of hybrid methods, which will be described in subsequent sections.
2.5. Clustering
Clustering is an emerging method, and the understanding of clustering is not systematic enough compared with the aforementioned algorithms. There is not even a chapter on clustering in the well-known textbook [34][158]. Clustering is an unsupervised learning method, that is, the labeling information of the training samples is unknown. The goal is to divide the samples in a dataset into several usually disjoint subsets, each called clusters. Note that clustering is significantly different from classification. The former algorithms essentially solve the classification problem, that is, the labels of each sample are known and the data are classified into known categories. Clustering divides the data into different subsets according to its inherent nature and rules. Clustering can be divided into partition-based methods, hierarchy-based methods, density-based methods, network-based methods, and model-based methods. More detailed principles of clustering can be found in [35][36][37][159,160,161].
In the field of NPP fault diagnosis, clustering is mainly used for fault monitoring. This method can be used to distinguish abnormal conditions from normal conditions even if they have not been trained. Talonen first developed a diagnostic model for early fault identification in NPPs based on a partition method [38][162]. Podofillini et al. established a dynamic process fault identification model based on model clustering [39][163]. Mercurio et al. simulated 60 accident samples and classified them into four categories using a clustering method, one of which was a new type of fault that was not trained beforehand [40][164]. Sameer et al. clustered turbine fault information from different NPPs and developed a generic fault diagnosis framework [41][165]. Baraldi et al. successively used clustering for fault diagnosis of different components of NPPs [42][43][44][45][46][47][61,166,167,168,169,170].
3. Fault Diagnosis Methods Based on Hybrid Algorithms
In the field of NPP fault diagnosis, hybrid algorithms combine the advantages of different single algorithms to obtain better diagnosis results. With the development of AI technology, almost all of the current methods are based on hybrid algorithms. In the first five topics, X stands for other auxiliary algorithms, such as ANN+X, which represents a hybrid diagnostic algorithm with ANN as the main algorithm. The sixth topic is the research literature involving the comparison of each algorithm.
In general, the current research of ANN+X algorithm occupies the mainstream direction, which is consistent with the development trend of AI, followed by SVM+X and comparison. In terms of diagnosis objects, system-level faults in NPPs, such as LOCA, SGTR, MSLB, and other initial events, are the vast majority of the diagnosis objects. However, component-level faults such as valves, feed pumps, inverters, etc. are less studied. One of the reasons is that most of the studies are conducted based on simulators due to the lack of real fault data, while simulation data for system-level faults are more readily available.
ANN+X. This topic is closely related to the development of neural network technology. For example, RNN is a very popular technique in recent years, which is good at processing time series data and has wide applications in natural language processing and artificial intelligence translation. Ye et al. introduced RNN with other algorithms into NPP fault diagnosis [48][49][50][171,172,173], making full use of the time series nature of the data. Some scholars considered the NPP data too complex, so they used other algorithms as front-end techniques to reduce the dimensionality and finally obtained better diagnostic performances [51][52][53][69,174,175]. Since there are various types of ANNs, each with unique advantages, integrated learning techniques combining multiple networks have been widely studied [34][35][36][37][38][158,159,160,161,162]. Ming et al. introduced multilayer flow models to improve the accuracy and interpretability of the neural network [54][67]. Qian et al. proposed a method to expand the fault diagnosis dataset based on generative adversarial networks (GANs) and demonstrated that the enhanced dataset can improve the performance of various models [39][163]. In addition, several scholars have studied the optimization of the hyperparameters of ANNs to obtain the parameter settings with the best diagnosis performance [49][172].
Comparison. In a comparative study, Yao et al. compared the performance of ANN with PCA, DT, and SVM methods in a more systematic way. He also transformed the state information of NPPs into image form and then used the advantages of convolutional neural networks in image recognition for the fault diagnosis [40][164]. In addition, Liu et al. built a hybrid model of SVM and SDG (the knowledge-driven method) and adopted different diagnostic methods for different objects [41][165]. To sum up, the relative research is relatively basic, and systematic comparative research is not yet available.
Other topics. The research directions of SVM+X include two main aspects. One is a combination of algorithms to reduce the data complexity with SVM. Another is to introduce algorithms related to the SVM parameter optimization [43][44][55][73,166,167]. The other three topics (PCA+X, DT+X, and Clustering +X) are less studied, and these three topics can be further studied in terms of integrated learning, interpretability, and hyperparameter optimization.
4. Summary of Data-Driven Fault Diagnosis Techniques
This section provides a detailed survey of the data-driven NPP fault diagnosis methods based on a single and hybrid algorithm perspective. To help readers understand the basic principles of these methods more quickly, this part dilutes the relevant formulas and elaborates the core ideas in layman’s terms, and it includes an index of the relevant literature for readers who need to do further study. The study shows that the current research favors the application of hybrid algorithms. This is because a single algorithm often does not fully satisfy the needs of the fault diagnosis. ANN+X is a popular research direction, which is also driven by the current popular deep learning technology. However, for nuclear power plants with high safety and reliability requirements, the inherent uninterpretability of neural networks and the dependence on massive data will hinder their practical application.