Your browser does not fully support modern features. Please upgrade for a smoother experience.
Please note this is a comparison between Version 2 by Jason Zhu and Version 1 by Gabriel Mazzucchelli.
Proteomic profiling of sweat to be a promising bio-fluid analysis for individualized, non-invasive monitoring and personalized medicine.
- human eccrine sweat
- shotgun proteomics
- inter-individual variability
1. Introduction
Sweat is secreted by millions of eccrine glands ubiquitously distributed over the human skin surface and involved in body thermoregulation by evaporation and skin homeostasis (hydration and immunity) [1,2]. Eccrine glands secrete a hypotonic solution of water-soluble electrolytes, e.g., sodium, chloride, potassium, urea or lactate and non-electrolytes, i.e., proteins, anti-microbial peptides and metabolites [3,4,5,6][1][2][3][4]. In clinical routine, investigations of sweat composition are limited to the determination of drug intake and the diagnosis of cystic fibrosis based on the measurement of sweat chloride concentration (Gibson and Cooke sweat test) [7,8][5][6].
Eccrine sweat is a promising bio-fluid of interest in the field of personalized medicine thanks to its less invasive collection relative to its complex composition, representing a valuable source of information [9][7] when compared to other routine bio-fluids such as bronchoalveolar, synovial or cerebrospinal fluids. In addition, the recent developments of high-resolution and high-sensitivity analytical techniques now allow working with small sweat volumes (10–20 µL) collected from standardized methods. Up to now, few proteomic studies have been conducted on eccrine sweat [10,11,12,13][8][9][10][11]. Despite the lower protein concentration (0.1–1 mg/mL), reports highlighted sweat as a likely informative source of biomarkers for monitoring both physiological and pathophysiological conditions; for example, disease-specific profiles of sweat proteins were described in patients with schizophrenia or tuberculosis [14,15][12][13]. However, all previous works were carried out on pooled sweat samples, thereby missing the inter-individual spectrum of sweat proteome variability.
In order to use sweat as a bio-fluid of interest, one must be able to characterize reference physiological profiles and inter-individual variations under steady-state conditions with standardized reproducible methods to discriminate between physiological responses to stimuli or disease-induced alterations. Eccrine sweat composition was described as complex and highly variable under normal physiological conditions, depending on multiple levels of stimulation and regulation, mechanisms of secretion and tissue contributions [16,17][14][15]. This complexity reflects the diversity of sweat’s biological functions, but it is also a major source of intra- and inter-individual variability.
In the context of personalized medicine, in light of the potential of eccrine sweat as a relevant source of protein biomarkers for prognosis or diagnosis of disease conditions and clinical follow-up, the current work was designed to carry out an in-depth characterization of the eccrine sweat proteome of healthy subjects. To this end, wresearchers applied standardized reproducible sweat collection, sample preparation, LC–MS/MS (liquid chromatography-tandem mass spectrometry) analysis and MS (mass spectrometry) data processing to the proteomic profiling of eccrine sweat. Nine hundred and eighty-three proteins were identified and quantified by a label-free approach across 28 individual samples, a significant improvement when compared to previous similar studies. Proteome annotation tackled newly described biological functions of sweat proteins and elaborated on the composition of sweat in terms of tissue contributions. In addition, the present studentry concluded on the effect of sweat rate on the inter-individual variability of sweat protein profiles and on the limited but significant influence of gender.
2. Results
2.1. The Proteome of Human Eccrine Sweat
2. The Proteome of Human Eccrine Sweat
Individual eccrine sweat samples were analyzed separately to gain insight into their individual proteome. To allow optimal protein identification, missing identifications (IDs) from individual analysis were completed with IDs transferred from the analysis of both other samples in the cohort and pooled aliquots thanks to the match between runs option of the MaxQuant software (version 1.6.6.0) (Figure 1).
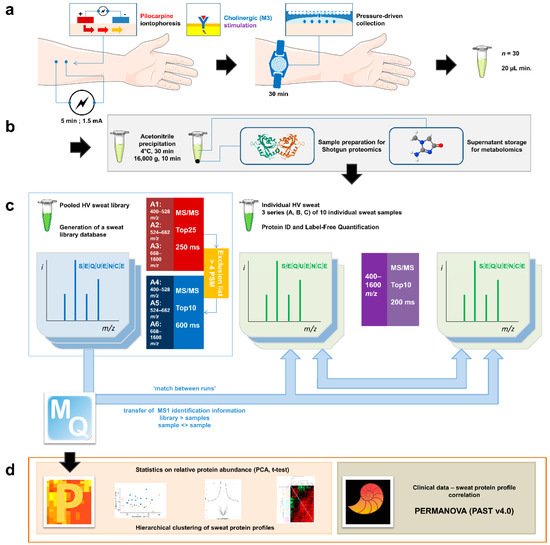
Figure 1. General experimental workflow. (a) Standardized sweat collection method. (b) Single sample preparation method for subsequent sweat proteomics and metabolomics studies. (c) Analytical and bioinformatic strategy using the “match between runs” option (MaxQuant). 1. Generation of a sweat reference proteome database from pooled samples. A two-round analysis of three limited m/z range acquisitions was performed. A precursor exclusion list was applied for the second round experiment. 2. Individual sweat sample analyses. (d) Statistical data processing tools.
2.2. Protein Identification: Comparison to Previous Studies
3. Protein Identification: Comparison to Previous Studies
Sweat samples from 30 healthy subjects—see Supplementary Table S1 for a complete clinical data summary—were analyzed by nanoLC–MS/MS. Based on chromatogram discrepancy, poor correlation with the other sample data and a low number of identified proteins, two samples were discarded (Supplementary Figure S1)—clinical data related to the 28 remaining samples are summed up in Table 1. Eventually, considering a minimum of two peptides—including one unique peptide—and a False Discovery Rate (FDR) below 0.01 for protein identification, a total of 986 proteins were identified, accounting for data filtering (Supplementary Table S2) and the standard protein mixture (MPDS Mix 1, Waters) for quality control. A total of 535 ± 22 proteins were peptide-spectrum matching hits, while 273 ± 9 proteins required matching between runs for identification for an average total of 808 ± 16 proteins identified for each sample (Figure 2a). A total of 347 proteins were consistently identified across all samples.
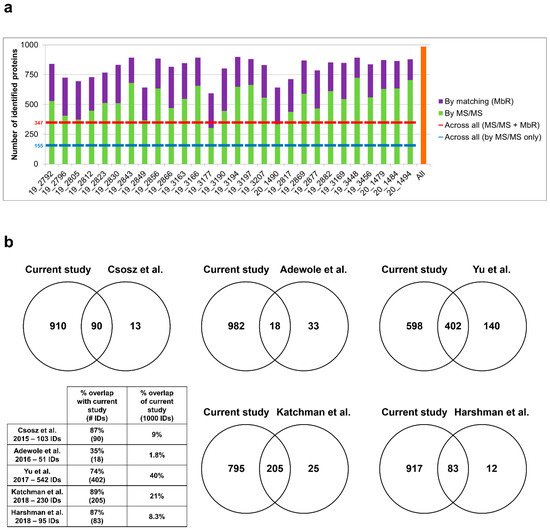
Figure 2. Performance of sweat shotgun proteomics. (a) Number of proteins identified (min. 2 peptides, 1 unique peptide) in each sample, by MS/MS (in light green) and by MbR (in purple), with total number of identified proteins (in orange). Standard proteins (n = 3, MPDS Mix 1) were kept as quality control. (b) Protein identification overlap with previous sweat proteomics studies (min. 2 unique peptides). Contaminant proteins were kept for proteome comparison. Here, the reference proteome included 975 proteins of interest plus 3 standard proteins (MPDS Mix 1) and 22 contaminants, identified with a minimum of 2 unique peptides.
Table 1.
Clinical data summary.
| Sample IDs | Age (years) | Sex | BMI (kg/m²) | Collected Volume (µL) (Right Arm) | Collected Volume (µL) (Left Arm) | [Na+] (mM) | [Cl−] (mM) | [K+] (mM) | [Protein] (µg/µL) | Na+ (µmol) | Cl− (µmol) | K+ (µmol) | Protein (µg) | |
|---|---|---|---|---|---|---|---|---|---|---|---|---|---|---|
| 19_2792 | 36 | M | 22.7 | 62.1 | 87.8 | 56 | 26 | 8 | 0.488 | 3.48 | 1.61 | 0.50 | 42.85 | HV (n = 28) |
| 19_2796 | 29 | M | 31.6 | 48.1 | 42.4 | 23 | 4 | 10 | 0.557 | 1.11 | 0.19 | 0.48 | 23.62 | |
| 19_2805 | 28 | M | 30.0 | 98.9 | 97.5 | 59 | 24 | 7 | 0.340 | 5.84 | 2.37 | 0.69 | 33.15 | |
| 19_2812 | 40 | M | 25.5 | 89.6 | 96.5 | 39 | 18 | 8 | 0.432 | 3.49 | 1.61 | 0.72 | 41.69 | |
| 19_2866 | 74 | M | 21.3 | 56.9 | 64.2 | 37 | 12 | 12 | 0.551 | 2.11 | 0.68 | 0.68 | 35.37 | |
| 19_2823 | 31 | F | 19.8 | 71.8 | 89.8 | 32 | 10 | 10 | 0.262 | 2.30 | 0.72 | 0.72 | 23.53 | |
| 19_2830 | 30 | F | 23.1 | 94.0 | 77.9 | 32 | 11 | 8 | 0.462 | 3.01 | 1.03 | 0.75 | 35.99 | |
| 19_2843 | 24 | F | 18.2 | 63.5 | 64.1 | 65 | 36 | 10 | 0.472 | 4.13 | 2.29 | 0.64 | 30.26 | |
| 19_2849 | 27 | F | 20.5 | 97.7 | 84.6 | 22 | 10 | 8 | 0.432 | 2.15 | 0.98 | 0.78 | 36.55 | |
| 19_2856 | 29 | F | 18.7 | 79.7 | 70.4 | 28 | 6 | 8 | 0.422 | 2.23 | 0.48 | 0.64 | 29.71 | |
| 19_3163 | 32 | F | 19.4 | 44.8 | 30.1 | 30 | 12 | 9 | 0.785 | 1.34 | 0.54 | 0.40 | 23.63 | |
| 19_3166 | 26 | F | 18.9 | 57.2 | 64.0 | 44 | 22 | 10 | 0.494 | 2.52 | 1.26 | 0.57 | 31.62 | |
| 20_1490 | 39 | F | 21.3 | 40.1 | 43.5 | 26 | 12 | 8 | 0.371 | 1.04 | 0.48 | 0.32 | 16.14 | |
| 19_3177 | 28 | M | 23.1 | 35.9 | 27.0 | 51 | 30 | 8 | 0.475 | 1.83 | 1.08 | 0.29 | 12.83 | |
| 19_3190 | 29 | M | 24.5 | 98.6 | 80.7 | 55 | 28 | 6 | 0.406 | 5.42 | 2.76 | 0.59 | 32.76 | |
| 19_3194 | 41 | M | 24.1 | 34.4 | 42.7 | 36 | 8 | 9 | 0.736 | 1.24 | 0.28 | 0.31 | 31.43 | |
| 19_3197 | 36 | M | 22.5 | 27.5 | 82.7 | 91 | 44 | 8 | 0.504 | 2.50 | 1.21 | 0.22 | 41.68 | |
| 19_3207 | 28 | M | 23.8 | 84.9 | 93.2 | 45 | 22 | 7 | 0.364 | 3.82 | 1.87 | 0.59 | 33.92 | |
| 20_1494 | 29 | F | 20.9 | 61.3 | 64.4 | 54 | 30 | 12 | 0.441 | 3.31 | 1.84 | 0.74 | 28.40 | |
| 19_2869 | 28 | F | 17.7 | 57.1 | 45.9 | 67 | 10 | 24 | 0.646 | 3.83 | 0.57 | 1.37 | 29.65 | |
| 19_2877 | 33 | F | 22.3 | 102.7 | 83.7 | 35 | 12 | 7 | 0.350 | 3.59 | 1.23 | 0.72 | 29.30 | |
| 19_2882 | 24 | F | 20.6 | 57.2 | 53.6 | 29 | 10 | 6 | 0.377 | 1.66 | 0.57 | 0.34 | 20.21 | |
| 19_3169 | 57 | F | 19.2 | 35.6 | 29.9 | 58 | 24 | 8 | 0.661 | 2.06 | 0.85 | 0.28 | 19.76 | |
| 20_1479 | 25 | M | 24.5 | 56.4 | 72.6 | 69 | 38 | 7 | 0.336 | 3.89 | 2.14 | 0.39 | 24.39 | |
| 20_1484 | 24 | M | 23.6 | 99.0 | 93.4 | 49 | 20 | 8 | 0.622 | 4.85 | 1.98 | 0.79 | 58.09 | |
| 19_2817 | 26 | M | 20.8 | 47.4 | 40.4 | 73 | 44 | 9 | 0.314 | 3.46 | 2.09 | 0.43 | 12.69 | |
| 19_3448 | 30 | M | 20.6 | 91.2 | 74.0 | 50 | 22 | 10 | 0.448 | 4.56 | 2.01 | 0.91 | 33.15 | |
| 19_3456 | 31 | M | 22.6 | 101.5 | 99.5 | 69 | 40 | 5 | 0.198 | 7.00 | 4.06 | 0.51 | 19.70 | |
| Mean | 33 | 13 F 15 M |
22.2 | 67.7 | 67.7 | 47 | 21 | 9 | 0.462 | 3.13 | 1.39 | 0.58 | 29.72 | |
| Median | 29 | 21.8 | 61.7 | 71.5 | 47 | 21 | 8 | 0.445 | 3.16 | 1.22 | 0.59 | 29.98 | ||
| SD | 11 | 3.2 | 24.2 | 22.7 | 18 | 12 | 3 | 0.137 | 1.49 | 0.89 | 0.24 | 9.87 | ||
| SEM | 2 | 0.6 | 4.6 | 4.3 | 3 | 2 | 1 | 0.026 | 0.28 | 0.17 | 0.05 | 1.87 |
The optimization of sweat sample preparation and MS acquisition together with the strategy for thorough protein identification significantly improved the analysis depth, as shown by the comparison with earlier sweat proteomics reports (Figure 2b). In terms of proteome coverage, the overall number of identified proteins was significantly higher when compared to previous studies with similar workflows. In addition, the increase in protein identification was characterized by an extended overlap with previously reported proteomes. It is noteworthy that while those studies relied on the use of pooled sweat samples to account for the limited volume available, the current work focused on the analysis of individual samples, with similar or better performance in protein identification.
2.3. Protein Classification and Over-Representation
4. Protein Classification and Over-Representation
Identified sweat proteins were classified and tested for over-representation by the PANTHER Classification system and Gene Ontology Enrichment analysis, mapping protein IDs against PANTHER GO Slim annotation datasets (Supplementary Tables S3–S6). The sweat proteome was significantly enriched in: (i) proteins related to proteolytic activity, proteases and peptidases [11][9] as well as their respective inhibitors, and (ii) protein effectors and regulators of the innate and adaptive immune systems [10,13][8][11]. Moreover, (i) cytoskeletal proteins, i.e., protein components (actin and ABP) of the actin cytoskeleton and regulators of actin organization and dynamics, (ii) proteins of reactive oxygen species metabolism and oxidative stress, (iii) markers of UPR and ER stress, (iv) components and regulators of the proteasome or (v) proteins of all major metabolic pathways, were among the over-represented proteins mapped to annotation clusters. A rapid annotation of the interaction network of sweat core proteins highlighted interaction clusters related to the biological functions mentioned above (Figure 3).
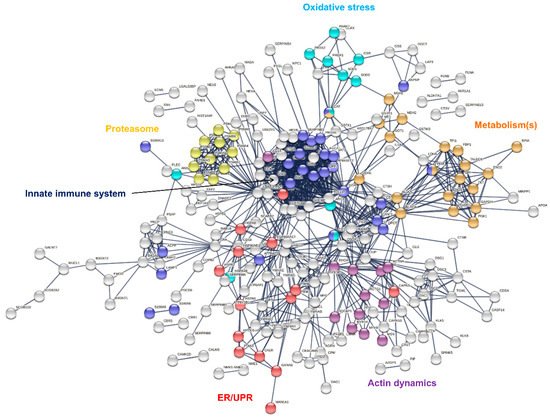
Figure 3. Interaction network mapping of sweat core proteins (347 proteins in 28/28 samples). The 347 query proteins resulted in 337 mapped proteins. Network settings included: Homo sapiens database, highest confidence minimum required interaction score, hidden disconnected nodes and confidence-based networking.
2.4. Relative Contributions of Plasma and the Eccrine Gland to Sweat Protein Composition
5. Relative Contributions of Plasma and the Eccrine Gland to Sweat Protein Composition
When comparing the 20 most abundant proteins of sweat (from the current study, 2.8% of total sweat proteins) to the plasma proteome [19][16] (Figure 4a), only 13 sweat proteins were retrieved in plasma and 7 were exclusive to sweat. Conversely, when comparing the 20 most abundant proteins of plasma to the sweat proteome, only 11 plasma proteins were retrieved in sweat, 9 being exclusive to plasma. Proteins exclusive to sweat, together with the absence of proteins shared between the top 20 proteins of plasma and sweat, highlighted the specificity of the sweat proteome. This observation excluded the filtration of plasma as the sole contributor to sweat protein composition. On a side note, the covered dynamic range of sweat was quite similar to that of plasma, spanning five orders of magnitude (Figure 4b).
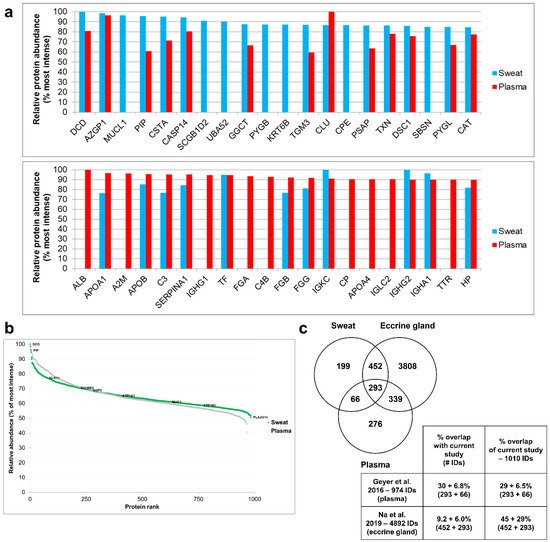
Figure 4. Tissue contributions to sweat composition. (a) Most abundant proteins (top 20) of sweat, as found in the plasma proteome (upper panel); most abundant proteins of plasma, as found in the sweat proteome (lower panel). Relative protein abundance = % Log10 LFQ intensity of top 10. (b) Dynamic range of sweat compared to plasma. Most and least intense proteins as well as eccrine gland markers in sweat were annotated. (c) Protein identification overlap with plasma and eccrine cell lysate (all identified proteins). Contaminant proteins were kept for proteome comparison. Here, the reference proteome included 983 proteins of interest plus 3 standard proteins (MPDS Mix 1) and 24 contaminants, identified with a minimum of 2 peptides, including a minimum of 1 unique peptide. Plasma proteomic data were retrieved from Geyer et al. 2016. Eccrine gland cell proteomic data were retrieved from Na et al. 2019.
The overlap of proteins between the current work and earlier plasma and eccrine gland proteomic reports was estimated so as to evaluate the different contributions to the sweat proteome at a larger scale (Figure 4c). Comparison to plasma and eccrine gland proteomes showed that 19.7% of sweat proteins were specific to sweat while 6.5% were shared between sweat and plasma, 44.8% were shared between sweat and the eccrine gland and 29% were shared between the three proteomes of interest.
Mapping proteins of different tissue origins to PANTHER-GO annotation clusters, the over-representation test determined that: (i) proteins exclusive to the current sweat proteome dataset were predominantly mapped to annotation clusters related to proteolytic activity and immune systems, (ii) proteins of plasma origin were mapped to annotation clusters related to proteolytic activity, immune systems, oxidative stress, proteasome and metabolic pathways, (iii) proteins originating from the eccrine gland were mapped to annotation clusters for proteolytic activity, actin organization and dynamics, proteasome and metabolic pathways and (iv) proteins of mixed origins were mapped to annotation clusters for proteolytic activity, actin dynamics, oxidative stress, UPR and ER stress, proteasome and metabolic pathways (Supplementary Tables S7–S22).
In conclusion, sweat is not a transudate of plasma, due in part to the active input of the eccrine gland in sweat protein composition.
2.5. Inter-Individual Variability of the Sweat Proteome
6. Inter-Individual Variability of the Sweat Proteome
A total of 986 identified proteins were suitable for protein label-free quantification. For further statistical analysis of protein abundances across samples, only those identified and quantified in at least 50% of the samples (14 out of 28) were used, for a total of 873 proteins.
First, the combined biological and technical variability was estimated by calculating the coefficients of variation (CV) of protein abundances measured across the 28 remaining samples. The distribution of combined biological and technical CV was density-plotted against the median log10-transformed protein abundance, as shown in Figure 5a. The variability across sweat samples was higher than the variability across plasma samples [19][16] and was on par with the variability across urine samples [20][17]. A total of 639 proteins had a CV below 100%, of which 105 proteins had a CV below 50%.
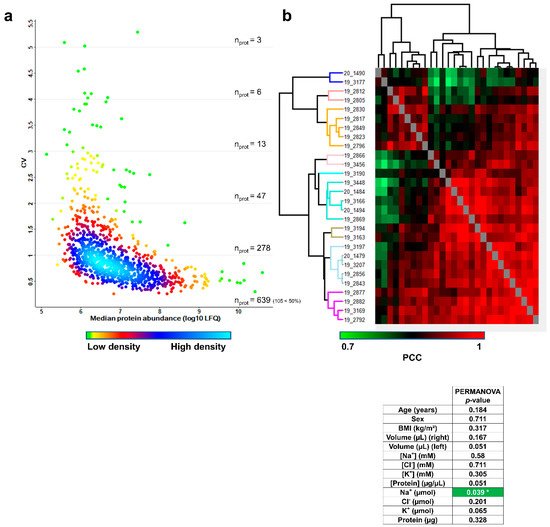
Figure 5. Inter-individual variability of the sweat proteome. (a) Coefficient of variation (CV) distribution (b). Heat-map representation of 28 sweat protein profiles. Hierarchical clustering of Pearson’s correlation coefficients generated using the average Euclidian distance matrix. PERMANOVA test for significance of correlation between clustering and clinical data distribution (number of permutations = 999, significant correlation highlighted in green, p < 0.05 *).
Computation of Pearson’s correlation coefficients (PCC) and average Euclidian distance hierarchical clustering were used to classify samples according to profiles of pairwise correlation with other samples in the cohort. Samples were sorted into nine distinctive clusters of significant sample correlation, i.e., sweat proteome profiles according to the joint observation of the clustering tree structure and the “heat” of PCC (Figure 5b). Available clinical data (including age, gender, BMI plus collected sweat volumes, ion concentrations, ion amounts, protein concentration and protein mass) were tested for their correlation with the biological inter-individual variability of the sweat proteome.
First, numeric clinical data were color coded based on their relative position in the quartile-delimitated distribution (Supplementary Table S23) to estimate if hierarchical clustering had grouped samples with matching clinical parameters. Anthropometric parameters such as age, gender and BMI did not appear as likely contributors to the inter-individual variability of the sweat proteome, as clusters did not group samples with matching age, gender or BMI. However, specific sweat-related parameters such as collected sweat volume (water loss), ion molarities and ion amounts (ion loss) as well as protein concentration and protein mass (protein loss) likely reflected the variability of sweat proteome profiles, since hierarchical clustering grouped samples with matching levels of water, ion or protein loss. In other words, variations in such sweat-related parameters might translate to variations in sweat proteome profiles.
Then, anthropometric and sweat-related parameters were tested for the significance of their correlation with the clusters of sample correlation by PERMANOVA (Figure 5b, lower panel), which compared clinical data distribution to hierarchical clustering in an objective way. As expected, no significant correlations between anthropometric parameters (age, sex and BMI) and sweat proteome profiles were observed. Neither were significant correlations between sweat-related parameters (right and left arm collected volumes, Na+, Cl− and K+ concentrations, Cl− and K+ amounts and protein mass) and sweat proteome profiles. Only secreted Na+ distribution stood out as significantly correlated with sweat proteome profiles and was emphasized as a core byproduct of the inter-individual variability of the sweat proteome.
To sum up, only the local sweat-related parameter, secreted Na+, but not anthropometric parameters, was a significant marker of the biological inter-individual variability of sweat protein composition, at steady-state conditions upon pilocarpine iontophoresis.
37. Conclusion
Researches demonstrate the proteomic profiling of sweat to be a promising lead in the search for non-invasive, individualized monitoring of protein biomarkers in relation to biometric tracking, clinical follow-up and personalized medicine. In this regard, investigators should pay particular attention to inter-individual variations in sweating rate.
References
- Mena-Bravo, A.; Luque de Castro, M.D. Sweat: A Sample with Limited Present Applications and Promising Future in Metabolomics. J. Pharm. Biomed. Anal. 2014, 90, 139–147.
- Calderón-Santiago, M.; Priego-Capote, F.; Jurado-Gámez, B.; Luque de Castro, M.D. Optimization Study for Metabolomics Analysis of Human Sweat by Liquid Chromatography–Tandem Mass Spectrometry in High Resolution Mode. J. Chromatogr. A 2014, 1333, 70–78.
- Delgado-Povedano, M.M.; Calderón-Santiago, M.; Priego-Capote, F.; Luque de Castro, M.D. Study of Sample Preparation for Quantitative Analysis of Amino Acids in Human Sweat by Liquid Chromatography–Tandem Mass Spectrometry. Talanta 2016, 146, 310–317.
- Delgado-Povedano, M.M.; Calderón-Santiago, M.; Priego-Capote, F.; Luque de Castro, M.D. Development of a Method for Enhancing Metabolomics Coverage of Human Sweat by Gas Chromatography–Mass Spectrometry in High Resolution Mode. Anal. Chim. Acta 2016, 905, 115–125.
- Luque de Castro, M.D. Sweat as a Clinical Sample: What Is Done and What Should Be Done. Bioanalysis 2016, 8, 85–88.
- Farrell, P.M.; White, T.B.; Ren, C.L.; Hempstead, S.E.; Accurso, F.; Derichs, N.; Howenstine, M.; McColley, S.A.; Rock, M.; Rosenfeld, M.; et al. Diagnosis of Cystic Fibrosis: Consensus Guidelines from the Cystic Fibrosis Foundation. J. Pediatrics 2017, 181, S4–S15.e1.
- Csősz, É.; Kalló, G.; Márkus, B.; Deák, E.; Csutak, A.; Tőzsér, J. Quantitative Body Fluid Proteomics in Medicine—A Focus on Minimal Invasiveness. J. Proteom. 2017, 153, 30–43.
- Csősz, É.; Emri, G.; Kalló, G.; Tsaprailis, G.; Tőzsér, J. Highly Abundant Defense Proteins in Human Sweat as Revealed by Targeted Proteomics and Label-Free Quantification Mass Spectrometry. J. Eur. Acad. Dermatol. Venereol. 2015, 29, 2024–2031.
- Yu, Y.; Prassas, I.; Muytjens, C.M.J.; Diamandis, E.P. Proteomic and Peptidomic Analysis of Human Sweat with Emphasis on Proteolysis. J. Proteom. 2017, 155, 40–48.
- Harshman, S.W.; Pitsch, R.L.; Smith, Z.K.; O’Connor, M.L.; Geier, B.A.; Qualley, A.V.; Schaeublin, N.M.; Fischer, M.V.; Eckerle, J.J.; Strang, A.J.; et al. The Proteomic and Metabolomic Characterization of Exercise-Induced Sweat for Human Performance Monitoring: A Pilot Investigation. PLoS ONE 2018, 13, e0203133.
- Katchman, B.A.; Zhu, M.; Blain Christen, J.; Anderson, K.S. Eccrine Sweat as a Biofluid for Profiling Immune Biomarkers. Proteom. Clin. Appl. 2018, 12, 1800010.
- Raiszadeh, M.M.; Ross, M.M.; Russo, P.S.; Schaepper, M.A.; Zhou, W.; Deng, J.; Ng, D.; Dickson, A.; Dickson, C.; Strom, M.; et al. Proteomic Analysis of Eccrine Sweat: Implications for the Discovery of Schizophrenia Biomarker Proteins. J. Proteome Res. 2012, 11, 2127–2139.
- Adewole, O.O.; Erhabor, G.E.; Adewole, T.O.; Ojo, A.O.; Oshokoya, H.; Wolfe, L.M.; Prenni, J.E. Proteomic Profiling of Eccrine Sweat Reveals Its Potential as a Diagnostic Biofluid for Active Tuberculosis. Prot. Clin. Appl. 2016, 10, 547–553.
- Baker, L.B. Physiology of Sweat Gland Function: The Roles of Sweating and Sweat Composition in Human Health. Temperature 2019, 6, 211–259.
- Baker, L.B.; Wolfe, A.S. Physiological Mechanisms Determining Eccrine Sweat Composition. Eur. J. Appl. Physiol. 2020, 120, 719–752.
- Geyer, P.E.; Kulak, N.A.; Pichler, G.; Holdt, L.M.; Teupser, D.; Mann, M. Plasma Proteome Profiling to Assess Human Health and Disease. Cell Syst. 2016, 2, 185–195.
- Shao, C.; Zhao, M.; Chen, X.; Sun, H.; Yang, Y.; Xiao, X.; Guo, Z.; Liu, X.; Lv, Y.; Chen, X.; et al. Comprehensive Analysis of Individual Variation in the Urinary Proteome Revealed Significant Gender Differences. Mol. Cell. Proteom. 2019, 18, 1110–1122.
More
