In the U.S., racial disparities are present among children, with Hispanic and Black children carrying the burden of infectious respiratory disease occurrence. Several factors are contributory to these outcomes among Hispanic and Black children, including higher rates of poverty; higher rates of chronic conditions, such as asthma and obesity; and seeking care outside of the home. However, vaccinations can be used to reduce the risk of infection among Black and Hispanic children. Whether a child is very young or a teen, racial disparities are present in occurrence rates of infectious respiratory diseases, with the burden resting among minorities. Therefore, it is important for parents to be aware of the risk of infectious diseases and to be aware of resources, such as vaccines.
- infectious diseases
- communicable diseases
- contagious diseases
1. Introduction
2. Systematic Review
Racial Disparities
Nineteen studies (95%) identified the presence of racial disparities in the occurrence rate of common infectious respiratory diseases, such as SARS-CoV-2 (COVID-19), SARS-CoV-2 (COVID-19)-related illnesses, influenza virus, respiratory syncytial virus (RSV), human metapneumovirus (HMPV), human parainfluenza viruses (HPIVs), streptococcus, staphylococcus aureus, and rhinovirus [11][12][13][14][15][16][17][18][19][20][21][22][23][24][25][26][27][28][29][13,14,15,16,17,18,19,20,21,22,23,24,26,27,28,29,30,31,32], among children in the United States. One study conducted by Perez et al. [11][13] identified the presence of racial disparities in the occurrence rate of infectious respiratory diseases, such as influenza, respiratory syncytial virus (RSV), human metapneumovirus (HMPV), human parainfluenza viruses (HPIVs), and SARS-CoV-2 (COVID-19), with Blacks or African Americans and Hispanics/Latinos carrying the majority (59%) of the burden of infection. Marks et al. [12][14] also identified the presence of racial disparities in infectious respiratory disease occurrence when observing SARS-CoV-2 (COVID-19) hospitalization rates among children aged 0–4, with Black and Hispanic children accounting for 55.5% of cases. Shi et al. [13][15] also identified the presence of disparity in the occurrence of respiratory infectious diseases, with Hispanic and Black children accounting for 57.6% of SARS-CoV-2 (COVID-19) hospitalizations in 14 states within the United States from July to December 2021. In a study conducted from July 2021 to January 2022, Anesi et al. [14][16] identified the presence of racial gaps in respiratory disease occurrence, with Black and Hispanic children constituting 52.3% of SARS-CoV-2 (COVID-19) hospitalizations in 17 states. In another study conducted by Shi et al. [15][17], racial gaps were observed in respiratory disease occurrence, with Black and Hispanic children accounting for 30.6% of hospitalization for SARS-CoV-2 (COVID-19) in 14 states from January 2021 to March 2021. A study by Levorson et al. [17][19] also established the presence of racial gaps in respiratory infectious disease occurrence, with Hispanic children having an especially high prevalence of SARS-CoV-2 (COVID-19) (26.8%). Lee et al. [17][19] also found a relationship between race and infectious respiratory disease occurrence, with 19.9% of Black children being hospitalized for SARS-CoV-2 (COVID-19) in New York City. This finding is extremely startling because Black children only constitute 22.2% of the New York City population. A study by Kurup et al. [18][20] also validated a relationship between racial disparities and disease occurrence in children, with Hispanic and Black children constituting 76.6% of positive SARS-CoV-2 (COVID-19) test results. Stierman et al. [19][21] also established that Black and Hispanic children constituted 53.4% of SARS-CoV-2 (COVID-19) diagnoses in 31 states. A study by Mody et al. [22][24] also established that Black children had a higher likelihood of testing positive for SARS-CoV-2 (COVID-19). Moreover, Graft et al. [23][26] established that Black and Hispanic children were more likely to test positive according to admission status (59.6%). Mannheim et al. [24][27] established that 78% of Black and Hispanic children tested positive for SAR-CoV-2 (COVID-19) and that Black and Hispanic children are more likely to test positive for SAR-CoV-2 (COVID-19) than non-minority racial groups. A study by Zambrano et al. [20][22] established that Black children have a higher likelihood of experiencing severe SARS-CoV-2 (COVID-19) outcomes. A study conducted in Mississippi by Hobbs et al. [21][23] revealed that Black children constituted 66% of sudden SARS-CoV-2 (COVID-19) hospitalizations from March 2020 to February 2021 at the University of Mississippi Medical Center. Studies by Brandt et al. [25][28] and Artiga and Hill [29][32] found that Black, Hispanic, American Indian or Alaska Native, and Asian or Pacific Islander children have higher rates of SARS-CoV-2 (COVID-19) infection than White children. Studies by O’Halloran [28][31] and Artiga and Hill [29][32] also validated a relationship between infectious disease occurrence and racial gaps, finding that Black (ICU: RR:2.74, 95% CI, 2.43–3.09) (Hospitalization: RR: 2.21. 95% CI, 2.10–2.33), American Indian or Alaska Native (ICU: RR: 3.51, 95% CI, 2.45–5.05) (Hospitalization: RR: 3.00, 95% CI, 2.55–3.53), Hispanic (ICU: RR: 1.96, 95% CI, 1.73–2.23) (Hospitalization: RR: 1.87, 95% CI, 1.77–1.97), and Asian or Pacific Islander children (ICU: RR: 1.26, 95% CI, 1.16–1.38) have higher rates of ICU admission and/or hospitalization due to SAR-CoV-2 (COVID-19) infection than White children. Finally, studies by Gualandi et al. [26][29] and Hansen et al. [27][30] further validated a relationship between racial discrimination and respiratory infectious diseases by identifying that Black children have higher rates of Methicillin-resistant Staphylococcus aureus infections [26][29] and cases of rhinovirus than White children [27][30]. However, a study conducted by Hamdan et al. [30][25] reported mixed findings in terms of the presence of racial disparities in the rate of occurrence of streptococcus, with no disparity present in the rate of occurrence of early-onset Group B streptococcus and racial disparity associated with the occurrence rate of late-onset Group B streptococcus, with Blacks or African Americans carrying the burden for this infection (Blacks/African Americans vs. Whites: RR, 1.55; 95% CI, 1.24–1.93; p < 0.001).3. Meta-Analysis
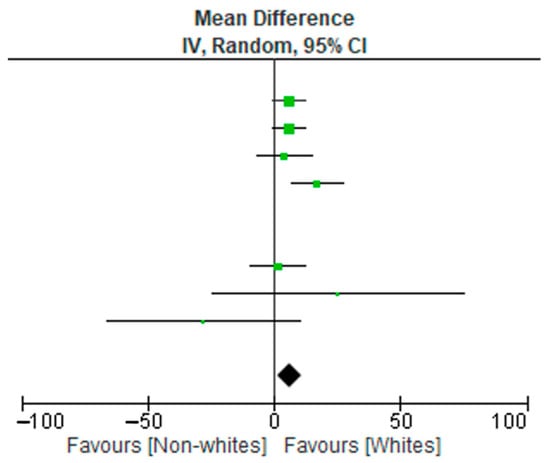
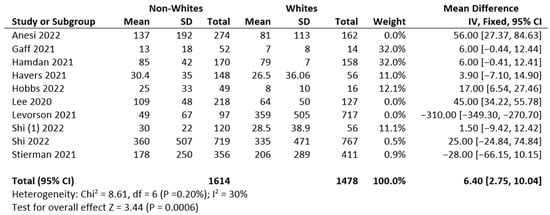
A meta-analysis of 10 studies (3090 subjects) was conducted. The data extraction included non-Hispanic Whites, non-Hispanic Blacks, and Hispanic subjects. The results relative to the included subjects were pooled and statistically analyzed to determine the effect of the relationship between race (non-Whites and Whites) and disease burden. There were significant differences in test allocation between the two groups, as noted in the forest plot in Figure 1. Although the test rates were higher in the Whites group, non-Whites had disproportionately high positive outcomes for infectious diseases compared to the non-White group. Possible limitations or moderators of this effect include study population demographics at the time of study, unknown vaccination statuses, and individual study designs.

4. Risk of Bias
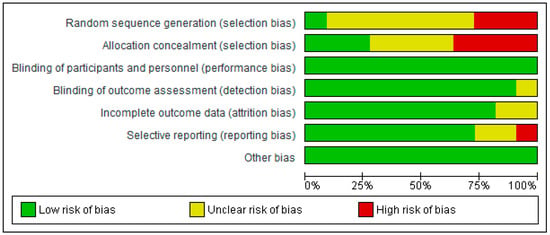
Figure 3 shows the authors’ judgements about each risk-of-bias item. Data are presented as percentages across all included reports or articles.
5. Risk of Bias Summary
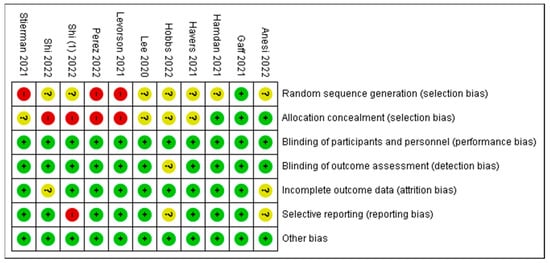
A study categorized as “unclear” risk of bias (yellow traffic light with question mark) has missing information, making it difficult to for researcheuthors to come to a consensus with respect to the assessment of limitations and potential problems. A study that is categorized as low risk of bias suggests consensus among the reviewers that the study results are valid. A study is categorized as high risk of bias when the attributes of the study design result in misleading or unclear results. Figure 4 presents a summary report of risk of bias based on the authors’ judgements about each risk-of-bias item for each included study. Similar to Figure 3, high risk is indicated in red, yellow indicates unclear, and green indicates low risk of bias. A few items in five studies were marked as high risk of bias, whereas the majority of items or criteria were found to have low risk of bias. The investigators of the current reviews used some of the limitations mentioned by the authors as potential risks of bias. They are noted in Table 1 as comments about the article for the readers’ judgement. A high risk of bias is indicated in studies listed in Table 1.
| Authors/Studies | Comments |
|---|---|
| Anesi et al. 2022 [14][16] | Self-reported data for a few participants were included in this analysis, a few infants may have been misclassified due to maternal vaccination status, or the mothers’ recollection of complete COVID-19 vaccination may be imperfect, as reported by the author as limitations. The small sample sizes mentioned by the authors resulted in wide confidence intervals. |
| Levorson et al. 2021 [16][18] | The regional population representativeness may have been affected by selection bias because the methodology focused on self-referral, and subjects in the study had blood labs completed for other clinical purposes. The authors made adjustments for these factors. |
| Shi et al. 2022 [13][15] | As mentioned by the authors, COVID-19 hospitalizations may have been overlooked because of testing practices and availability. Detailed clinical data are limited for the period during which the omicron variant was predominant (19–31 December 2021). The data do not include the peak of hospitalizations during this period; the delta variant was prevalent in late December. |
| Perez et al. 2022 [11][13] | New Vaccine Surveillance Network data are limited to enrolled consenting participants, who may not be representative of all children receiving health care, as mentioned by the authors as limitations. |
| Stierman et al. 2021 [19][21] | The proportion of positive SARS-CoV-2 test results recorded in drive-through clinics increased during the COVID-19 pandemic, as reported in the paper. This study focused on counties with complete ethnicity and race data. The results may not be generalizable to larger populations, as suggested by the authors. |
