Your browser does not fully support modern features. Please upgrade for a smoother experience.
Please note this is a comparison between Version 1 by Dieter Haemmerich and Version 2 by Camila Xu.
Thermosensitive liposomes (TSL) belong to the category of triggered nanoparticle drug delivery systems (DDS) where a drug associated with the DDS is released in response to an external trigger. TSL are triggered by heat and release the encapsulated drug when exposed to mild hyperthermia (HT), typically ~40–43 °C. TSL were first described more than four decades ago.
- thermosensitive liposomes
- hyperthermia
- cancer
- nanoparticles
- drug delivery systems
1. Introduction
Thermosensitive liposomes (TSL) belong to the category of triggered nanoparticle drug delivery systems (DDS) where a drug associated with the DDS is released in response to an external trigger [1][2][3][4][1,2,3,4]. TSL are triggered by heat and release the encapsulated drug when exposed to mild hyperthermia (HT), typically ~40–43 °C. TSL were first described more than four decades ago [5][6][7][8][5,6,7,8]. Since then, numerous TSL formulations combined with various drugs have been described, as summarized in prior reviews [9][10][11][12][13][14][15][9,10,11,12,13,14,15]. TSL are most often administered systemically, e.g., by intravenous infusion, and then circulate in the blood stream for an extended duration. Combined with localized hyperthermia, TSL enable loco-regional drug delivery (Figure 1). This enables the delivery of a large drug dose to a targeted tissue region (e.g., tumor) while reducing systemic toxicities. Therefore, TSL are attractive as a therapeutic strategy in cancer patients where loco-regional drug delivery is beneficial, but less useful in metastatic cancer patients that require systemic therapy. While TSL have been most widely investigated for drug delivery in cancer therapy, additional potential clinical applications include the delivery of antibiotics [16][17][16,17], the treatment of inflammatory diseases [18], and the treatment of blood clots [19].
TSL enable two different delivery approaches: extravascular triggered release, and intravascular triggered release (Figure 2) [14][20][21][22][23][14,20,21,22,23]. Extravascular triggered release requires the extravasation of the TSL, followed by HT-triggered release of the encapsulated agent [14][24][14,24]. This extravasation is based on TSL accumulation within the tumor interstitium facilitated by enhanced permeability and retention (EPR) [14][25][26][27][28][14,25,26,27,28]. Several recent papers described the limitations of the EPR effect, such as high intra- and inter-tumor variability, and an apparent upper delivery limit [14][27][29][14,27,29]. SomRecent reviews highlight the need for delivery strategies that do not rely on EPR [14][27][29][14,27,29].

Figure 1. Localized drug delivery with thermosensitive liposomes (TSL). Following the administration of TSL-encapsulated doxorubicin (Dox), a subcutaneous mouse tumor was heated by a surface heating probe to 43 °C. Fluorescence imaging during hyperthermia visualizes the localized delivery of the fluorescent drug (Dox). Drug delivery takes place as long as hyperthermia is applied, here visualized by a fluorescence increase over the 60 min heating duration. Figure reproduced from [30] (published under Creative Commons CC BY license).
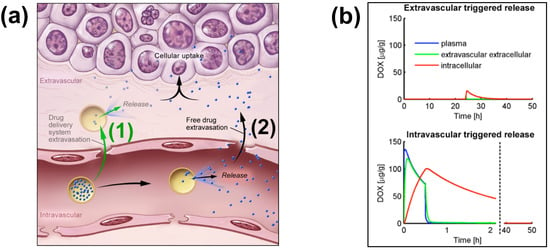
Figure 2. Extra- and Intra-vascular triggered release. (a) (1) Traditionally, nanoparticle DDS have been based on passive tumor targeting due to enhanced permeability and retention (EPR), where drug is released following extravasation of the DDS. (2) For TSL with intravascular triggered release, EPR is not relevant: TSL enter the tumor microvasculature of the target region where the release trigger (i.e., hyperthermia) is present, and release the contained drug within the vasculature. The released drug extravasates rapidly into tissue and is then taken up by cancer cells. (b) Top graph: Concentration dynamics in plasma, interstitial, and intracellular compartments during extravascular triggered release. TSL were allowed to accumulate for 24 h in the tumor based on EPR, followed by hyperthermia triggered release. Bottom graph: Concentration dynamics during intravascular triggered release. Hyperthermia (30 min) was applied immediately after TSL administration. Concentration increases in plasma due to drug release. Released drug then extravasates into interstitium (extravascular extracellular space), where it is taken up by cells. Figure 3a reproduced from [20] (published under CC BY 4.0 license). Figure 3b reproduced from [22] (published under CC0 license).
Intravascular triggered release is a strategy where drug release occurs in the microvasculature while the TSL pass through the heated tumor, and does not require the EPR effect (Figure 2a) [6][20][21][22][23][6,20,21,22,23]. Many of the more recent TSL formulations are based on intravascular triggered release, and such TSL have demonstrated superior delivery efficacy, with up to 25× higher drug delivery compared to unencapsulated drugs [31]. Compared to non-triggered nanoparticle drug delivery systems, TSL based on intravascular triggered delivery demonstrate superior tumor drug uptake (Figure 3). In addition, the direct comparison of TSL with extra- versus intra-vascular triggered delivery strongly suggests that the latter is superior [22][24][32][33][22,24,32,33] (Figure 2b).
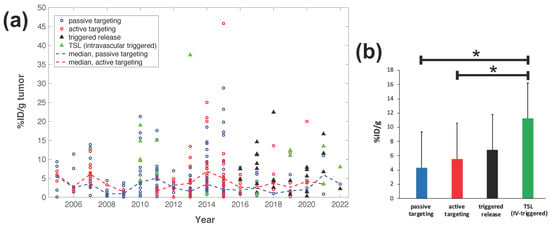
Figure 3. Delivery efficacy of intravascular triggered TSL compared to other nanoparticle DDS. A prior review compared the efficacy of 117 nanoparticle DDS studies published between 2005–2015 [27], and rwesearchers combined data from this prior researchview to include studies published between 2016–2022 based on the same search algorithm [30][31][32][34][35][36][37][38][39][40][41][42][43][44][45][46][47][48][49][50][51][52][53][54][55][56][57][58][59][60][61][62][63][64][65][66][67][68][69][70][71][72][73][74][75][76][77][78][79][80][81][82][83][84][85][86][87][88][89][90][91][92][93][94][95][96][97][98][99][100][101][102][103][104][105][106][107][108][109][110][111][112][113][114][30,31,32,34,35,36,37,38,39,40,41,42,43,44,45,46,47,48,49,50,51,52,53,54,55,56,57,58,59,60,61,62,63,64,65,66,67,68,69,70,71,72,73,74,75,76,77,78,79,80,81,82,83,84,85,86,87,88,89,90,91,92,93,94,95,96,97,98,99,100,101,102,103,104,105,106,107,108,109,110,111,112,113,114]. (a) Plot showing the delivery efficacy (%injected dose per gram tumor (%ID/g tumor)) based on the combined data [27][30][31][32][34][35][36][37][38][39][40][41][42][43][44][45][46][47][48][49][50][51][52][53][54][55][56][57][58][59][60][61][62][63][64][65][66][67][68][69][70][71][72][73][74][75][76][77][78][79][80][81][82][83][84][85][86][87][88][89][90][91][92][93][94][95][96][97][98][99][100][101][102][103][104][105][106][107][108][109][110][111][112][113][114][27,30,31,32,34,35,36,37,38,39,40,41,42,43,44,45,46,47,48,49,50,51,52,53,54,55,56,57,58,59,60,61,62,63,64,65,66,67,68,69,70,71,72,73,74,75,76,77,78,79,80,81,82,83,84,85,86,87,88,89,90,91,92,93,94,95,96,97,98,99,100,101,102,103,104,105,106,107,108,109,110,111,112,113,114]. Each marker represents a published study, and dashed lines indicate the annual median for DDS with passive and active targeting. (b) The means of all prior studies in each category between 2005–2022 are compared, suggesting superior delivery efficacy of intravascular triggered TSL (* indicates statistical significance (p < 0.05)).
Tissue Transit Time
For TSL based on intravascular triggered release, the dynamics of blood flow through the tumor vasculature is of primary relevance. Blood/plasma with TSL enter a tumor segment through a supplying artery, pass through tumor capillaries, and exit the tumor segment through a draining vein. The average time that plasma spends within a tumor segment is termed the ‘tissue transit time’ (TT) (compared to plasma, red blood cells move significantly slower through capillaries, and thus remain for longer within the tumor segment [115]). The drug release from TSL, and drug extraction by tumor tissue, can only occur during this tissue transit time. Figure 4 visualizes the transit time between supplying artery and draining vein of a small mouse tumor segment. In human tumors, the mean transit time through a tumor has been measured for various tumor types. This mean tumor transit time varies widely, and is ~2 s for primary hepatocellular carcinoma [116], ~3 s for head and neck and prostate tumors [117][118][117,118], ~11 s for renal cell carcinoma [119], ~25 s for metastases to the liver [116], and ~30 s for breast cancer [120]. Furthermore, transit time and perfusion vary spatially within tumors such that transit time can be locally within a tumor considerably higher or lower than these mean values that were averaged over the whole tumor.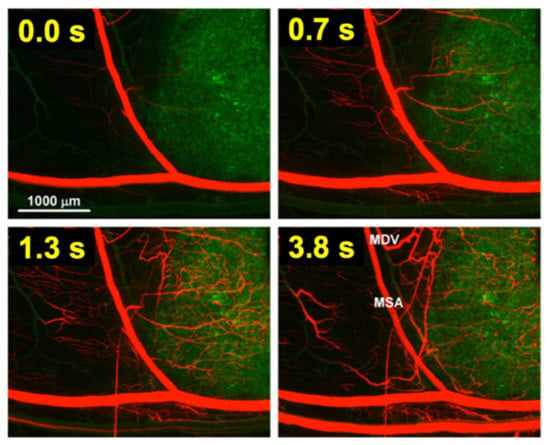
Figure 4. Tumor plasma transit time. Tumor (green fluorescent labeled cancer cells) was imaged by intravital fluorescence microscopy. A red fluorescent contrast agent was injected as bolus. The time at left upper corner of each image indicates timing relative to plasma first entering the tumor segment; plasma exits the tumor segment again within ~4 s (note: red blood cells move slower than plasma and remain longer in the tumor segment). In the final image (right lower corner), the main supplying artery (MSA), and main draining vein (MDV) of the imaged tumor segment are labeled. Figure reproduced with permission from [115].

Figure 5. Microvascular concentration gradient. Plasma flows within a representative capillary between the supplying artery and draining vein of a tumor segment. Plasma concentration of unencapsulated/released drug (blue bar), and TSL-encapsulated drug (black bar) are shown, with red arrows indicating tumor drug uptake (i.e., drug extraction). Three cases are presented: (a) Unencapsulated drug infusion into supplying artery, (b) TSL with complete release during transit, and c) TSL with incomplete release during transit. In (b,c), drug is first released from TSL, followed by tissue uptake. Note that all figures show first pass where no drug is yet present in the tissue interstitium. Figure reproduced from [20] (published under CC BY 4.0 license).
2. Impact of TSL Properties on Drug Delivery
The methods for preparation and loading of various TSL formulations with different agents has been reviewed extensively in prior reviews [9][10][11][12][13][14][15][9,10,11,12,13,14,15]. Additionally, the factors and mechanisms that affect drug release from TSL have been summarized in detail in earlier publications [9][11][12][9,11,12]. Here, we focus on reviewing how TSL properties such as release kinetics and plasma stability affect drug delivery is focused on. These properties depend both on the TSL formulation and the drug. For example, the same formulation will have varying release kinetics depending on which drug is encapsulated [121]. In addition, the buffer used to measure release affects release kinetics [121], highlighting the importance of selecting an appropriate buffer (e.g., plasma) (Figure 6d).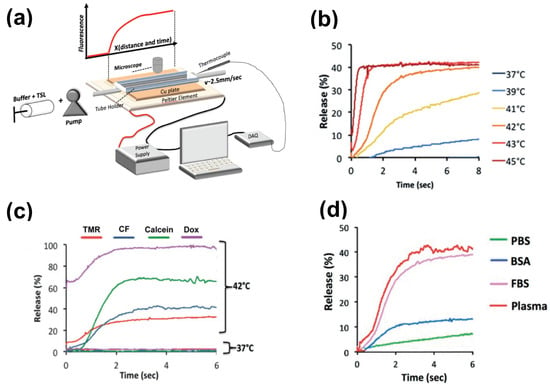
Figure 6. Measuring release kinetics of fast-release TSL formulations. (a) Millifluidic release assay schematics. A TSL solution (TSL + buffer) is pumped through a capillary tube that has been heated to the desired temperature by a Peltier element. Once the TSL solution enters the heated region, TSL begin to release the fluorescent drug/dye, resulting in a fluorescence gradient along the tube (upper graph). The Peltier temperature is measured by a thermocouple, and a control algorithm regulates the power applied to the Peltier element to control temperature. (b) Release of carboxyfluorescein (CF) from fast-releasing TSL (DPPC:MSPC:DSPE-PEG2000 = 85:10:5) between 37 and 45 °C during the first 8 s. Release within seconds is required to take advantage of the intra-vascular triggered release paradigm. (c) Release depends on the encapsulated compound, shown for four compounds for the same TSL formulation. Release in (a–c) was measured using fetal bovine serum (FBS) as buffer. (d) Release kinetics vary between buffers. CF release is shown for 4 buffers: phosphate buffered saline (PBS), 10% bovine serum albumin (BSA) solution, fetal bovine serum (FBS), and human plasma. TSL formulation used in (b–d) was identical. Figures reproduced with permission from [121].
2.1. TSL Release Kinetics
The early TSL formulations had comparably slow release (within minutes to hours) [122][123][122,123]. In addition, heating to >42 °C was required to achieve substantial release. This is disadvantageous since temperatures above 43 °C may result in reduced blood flow [124] that would also reduce the inflow of TSL-encapsulated drug. The first fast-release TSL formulations were published in the early 1990s, demonstrating substantial release within a few seconds after heating to >41 °C [125][126][125,126]. Such rapid release is required to take full advantage of the intravascular triggered release paradigm, as discussed above. The first fast-release formulation with substantial release at lower temperatures (40 °C) was presented around the year 2000 [31][127][128][31,127,128], and formed the basis for the first commercial TSL formulation (ThermoDox®) that has been employed in several human clinical trials [129][130][131][132][133][134][135][129,130,131,132,133,134,135]. Several additional fast-release TSL formulations encapsulating various agents have been presented within the last two decades [136][137][138][136,137,138]. Recent studies confirm that fast-release TSL that release within a few seconds can deliver substantially higher drug amounts compared to slower releasing formulations [20][21][22][20,21,22]. However, for most of these TSL formulations, release kinetics is not known within the time scale relevant for intravascular triggered release (e.g., within the first few seconds), owing to limitations of conventional methods used for measuring the release kinetics. The most widely used method for measuring TSL release kinetics employs a buffer pre-heated to the desired temperature, where a small volume of TSL is added, typically under stirring [113][123][137][139][140][141][142][143][113,123,137,139,140,141,142,143]. Release is quantified usually using spectrophotometry, since optical properties (e.g., fluorescence) change when the drug is released from TSL. Due to the time required for mixing of the TSL with the buffer, the first reported time points are typically between 8–20 s. This time is substantially longer than many typical tumor transit times, making these measurements of limited value. There have been two methods presented to measure TSL release kinetics at short (second) time scales. The first method employed a small-diameter tube within which TSL solution was passed through heated water for a specific time, and the released drug was quantified in the sample exiting the tube [125]. An advantage of this method is that various quantification methods can be employed on these samples. In a second method, a glass capillary tube was heated by a Peltier element, and release was quantified by measuring fluorescence along the tube by either microscopic or macroscopic fluorescence imaging (Figure 6a) [121][144][121,144]. This method provides data at high temporal resolution not possible with other methods (Figure 6b–d), but is limited to fluorescent agents. In both methods, it is important to select thin-walled tubes and to validate sufficiently rapid heating of the solution passing though the tube to target temperature [121]. To compare the release kinetics of TSL formulations, a recent study suggested using a characteristic release time based on a linear approximation of the TSL release kinetics [20]. As noted earlier, TSL only spend a few seconds within a tumor (=transit time), and for most TSL, the release kinetics within those first seconds can be adequately represented by a linear approximation (Figure 7). Ideally, this release time would be smaller than the transit time to maximize release and tissue drug uptake (Figure 5). The amount of drug released during tumor transit (Figure 5) can be estimated by the ratio of transit time to release time (can bsee found in original contextSupplementary Material File S1, Equation (S2)). A recent study demonstrated that TSL with rapid release (i.e., short release time) can deliver substantially more drug to tissue than TSL with slow release (Figure 8) [20]. Table 1 summarizes the release times of published fast-release TSL formulations. In most cases, the exact release times could not be determined owing to limitations of methods used to quantify the release kinetics, as described above.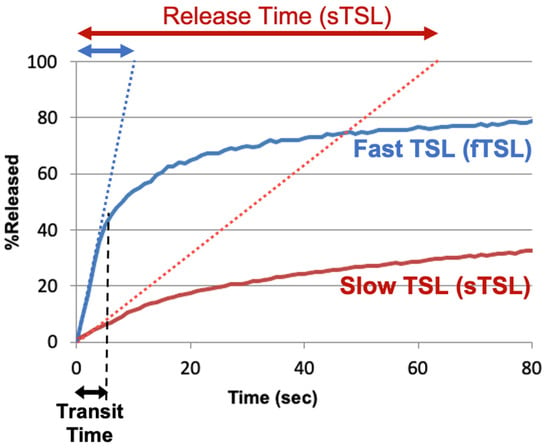
Figure 7. TSL release time. Release of two TSL formulations encapsulating a fluorescent drug analog (carboxyfluorescein) with slow (sTSL) and fast (fTSL) release is plotted, based on data from a prior study [20]. The dotted lines indicate a linear approximation of the release kinetics. TSL only spend a few seconds within the heated tumor (see black double arrow indicating ‘Transit Time’). Thus, in most cases, a linear approximation adequately represents release within those few seconds that TSL spend within the tumor vessels. Based on this linear approximation, a characteristic ‘release time’ is determined (indicated by red and blue double-arrows at the top) that enables the comparison of different TSL formulations. This release time was 8.2 s for fTSL, and 63.0 s for sTSL. The fraction of drug released during transit can be estimated by the ratio of transit time to release time (can bsee found in original contextSupplementary Material File S1, Equation (S2)).
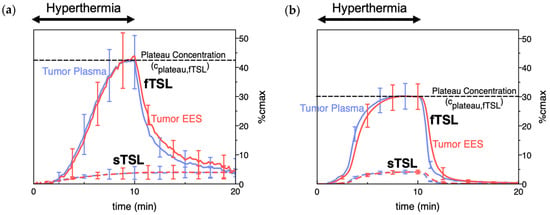
Figure 8. TSL delivery kinetics. (a) Drug concentration in plasma and interstitium (extracellular-extravascular space, EES) was determined from intravital microscopy data. Hyperthermia (42 °C) for 10 min was applied following the administration of either slow- (sTSL) or fast-release TSL (fTSL) encapsulating a fluorescent drug analog (carboxyfluorescein) (see Figure 7 for release kinetics of sTSL and fTSL). Plasma concentration increases during hyperthermia due to drug release. Released drug is then extracted by tissue, indicated by increasing interstitial (EES) concentration. A plateau (peak) concentration is approached towards the end of hyperthermia. This plateau concentration is substantially higher for fTSL compared to sTSL. Error bars indicate standard deviation (n = 3 animals/group). (b) Computer simulation of drug delivery kinetics based on in vivo measured tumor properties reproduces the delivery kinetics observed in (a). Error bars indicate computer model uncertainty due to uncertainty of model parameters. Figures reproduced from [20] (published under CC BY 4.0 license).
Table 1. Fast-release TSL formulations. Release times (see Figure 7) were estimated if possible, or an upper limit was provided (e.g., <20 s); in the latter cases, release at the first measured time point is shown in brackets. Buffer used for release measurement is indicated, since buffer affects release kinetics [121].
| TSL Composition (Molar Ratio) | Drug | Release Time [Temp.] | Buffer | In Vivo Plasma Half-Life | (Species) | Refs. | |||||||||||||||
|---|---|---|---|---|---|---|---|---|---|---|---|---|---|---|---|---|---|---|---|---|---|
| DPPC:MSPC:DSPE-PEG2000 (86:10:4) | Doxorubicin | 3 s [40 °C] | human plasma | 0.96 h | (human) | ; 1–2 h | (rabbit) | ; 4.8 h | (pig) | [127][128] | 128 | [129][140][145] | ,129 | [ | ,140 | 146 | ,145 | ][ | ,146 | 147] | [127,,147] |
| DPPC:MSPC:DSPE-PEG2000 (85.3:9.7:5) | Doxorubicin | 4 s [41 °C] | PBS | 0.93 h | (mouse) | ; 0.96 h | (rat) | ; 0.75 h | (dog) | [30][148][149] | [30,148,149] | ||||||||||
| DPPC:DSPC:DSPE-PEG2000 (70:25:5) | Doxorubicin | ~5–10 s [42 °C] | FBS | >1 h | (mouse) | [105] | |||||||||||||||
| DPPC:DSPE-PEG2000:Ch:mELP | Doxorubicin | <5 s [41–42 °C] | FBS + culture media | 2.0 h | (mouse) | [150] | |||||||||||||||
| DPPC:DSPC:DPPG1 (50:20:30) | Doxorubicin | <20 s [42 °C] (92.2% release @ 20 s) |
HEPES buffered saline | 1.4 h | (rat) | [151] | |||||||||||||||
| DPPC:DSPC:DPPG2 (50:20:30) | Doxorubicin | <20 s [42 °C] (~75% release @ 20 s) |
HEPES buffered saline | ~1 h | (pig) | ; 1.6–2.4 h | (rat) | ; 0.4–0.7 h | (cat) | [151][152][153][154][155] | [151,152,153,154,155] | ||||||||||
| EYPC:Chol:Peg-PE:poly(EOEOVE-OD4) (50:45:4:2) | Doxorubicin | ~1 min [43 °C] | HEPES buffered saline | - | [156] | ||||||||||||||||
| DPPC:Brij78 | Doxorubicin | ~1 min [42 °C] | FBS | 0.5 h | (mouse) | [157] | |||||||||||||||
| DOPE:EPC:chol-pHPMAlac (70:25:5) | Doxorubicin | ~2 min [42 °C] | HEPES buffered saline | - | [158] | ||||||||||||||||
| DPPC:DSPC:DSPE-PEG2000 (60:35:5) | Idarubicin | <1 s [42 °C] | FBS | >1 h | (mouse) | [105] | |||||||||||||||
| DPPC:DSPC:DSPE-PEG2000 (80:15:5) | Gemcitabine | <2 min [42 °C] (90% release @ 2 min) |
FBS | ~2 h | (mouse) | [143] | |||||||||||||||
| DPPC:MSPC:DSPE-PEG2000 (86:10:4) | Gemcitabine | ~30–60 s | FBS:saline (1:1) | - | [34] | ||||||||||||||||
| DPPC:Brij78 | Gemcitabine | ~30–60 s | FBS:saline (1:1) | ~2 h | (mouse) | [34] | |||||||||||||||
| DPPC:Brij78 | Oxiplatin | ~30–60 s | FBS:saline (1:1) | ~1 h | (mouse) | [34] | |||||||||||||||
| DPPC:DSPC (90:10) | Cisplatin | 3–5 s [43 °C] | rat plasma | ~1 h | (mouse) | [125][126][159] | [125,126,159] | ||||||||||||||
| DPPC:DPPG:MSPC:DSPE-PEG2000 (57.7:28.9:9.6:3.8) |
Cisplatin | <5 min [42 °C] (90% release @ 5 min) |
0.9% saline | ~1.5 h | (mouse) | [113] | |||||||||||||||
| DPPC:MSPC:DSPG:DSPE-PEG2000 (82:8:10:4) | Epirubicin | ~4 min [41–43 °C] | PBS | 0.2 h | (rat) | [160] | |||||||||||||||
| DPPC:MSPC:DSPE-PEG2000 (86:10:4) | Alvespimycin | <30 s [42 °C] (90% release @ 30 s) |
BSA in PBS | 0.2 h | (mouse) | [80] |
DPPC: 1,2-Dipalmitoyl-sn-glycero-3-phosphocholine; DSPC: 1,2-distearoyl-sn-glycero-3-phosphocholine; MSPC: 1-stearoyl-2-hydroxy-sn-glycero-3-phosphatidylcholine; DPPG: 1,2-dipalmitoyl- sn-glycero-3-phosphoglycerol; PE: poly ethylene; PEG: polyethylene glycol; Ch: Cholesterol; EYPC: egg yolk phosphatidylcholine; EOEOVE: 2-(2-ethoxy)ethoxyethyl vinyl ether; mELP: modified elastin-like polypeptide; Brij78: proprietary surfactant (main component: eicosaethylene glycol octadecyl ether); pHPMAlac: 2-Hydroxypropyl methacrylamide mono/dilactate polymers; PBS: phosphate buffered saline; FBS: fetal bovine serum; BSA: bovine serum albumin.
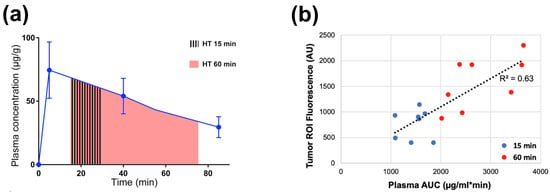 Note however that such comparisons based on AUC are only appropriate for different studies with the same TSL formulation, and the same or similar hyperthermia methods (i.e., with similar tumor temperature). The AUC indicates the total amount of TSL-encapsulated drug that passes through the heated tissue during hyperthermia. If two different heating devices with different temperature profiles and heating volumes are used, the amount of drug released from TSL will differ. Similarly, if two different TSL formulations are used, the amount of drug released will differ due to varying TSL release kinetics. Thus, even if the AUC is identical (=total amount of TSL-encapsulated drug passing through heated tissue), the amount released from these two TSL formulations will vary, resulting in different tumor drug uptake.
TSL plasma stability depends on several factors, and one major contributor is drug leakage from TSL at body temperature (37 °C)—i.e., drug slowly leaks from TSL while in systemic circulation [164]. Unfortunately, the release rate at body temperature is usually tied to the release rate at hyperthermic temperatures—i.e., slow release at 37 °C and rapid release at hyperthermia represent conflicting requirements for TSL formulations.
The peak plasma concentration after administration of TSL-encapsulated drug (Figure 9a) naturally correlates with the administered dose. Often, the administered dose is close to, or at the maximum tolerated dose (MTD) for that particular TSL–drug formulation in the studied species. In rodents, the MTD relative to body weight is often substantially higher compared to humans [165]. This higher administered dose in rodents results in higher plasma concentration (Figure 9a) and higher tumor drug uptake compared to large animals [147][149][155][147,149,155] and humans [129][133][129,133]. This issue may be relevant when extrapolating results on tumor drug uptake and therapeutic response from rodent studies to human patients.
2.2. Plasma Stability
Plasma stability describes how long TSL-encapsulated drug remains in the systemic circulation after administration and can be quantified by the initial plasma half-life of a TSL formulation. Similar to the TSL release kinetics, plasma stability depends both on TSL formulation and encapsulated drug, but also varies with species (Table 1). During hyperthermia, circulating TSL-encapsulated drug continuously enters the heated tissue volume, with subsequent intravascular drug release (Figure 2 and Figure 5). The plasma concentration of TSL-encapsulated drug represents the amount available for intravascular triggered release. Thus, the AUC (area under the concentration vs. time curve) of the plasma concentration calculated during hyperthermia correlates with the total amount of TSL-encapsulated drug subjected to hyperthermia [161][162][161,162]. As a result, this AUC directly correlates with the amount of drug released in the heated tumor (can bsee found in original contextSupplementary Material File S1, Equation (S5)). This AUC also correlates with tumor drug uptake, as initially demonstrated in a computer modeling study [161] and later confirmed by several experimental studies (Figure 9) [149][162][163][149,162,163]. A higher plasma stability would therefore increase this AUC, resulting in larger amount of drug being released—assuming that the kinetics of TSL release is not different (e.g., increased plasma stability of a TSL formulation may be disadvantageous if it is associated with slower release). Similarly, one approach to enhance drug delivery is to adjust the timing of hyperthermia as to maximize the plasma AUC during heating [161][163][161,163].
Figure 9. Plasma-AUC during hyperthermia correlates with tumor drug uptake. (a) AUC of plasma Dox concentration was calculated during heating, for either 15 or 60 min hyperthermia (HT) as indicated by shaded regions. (b) Plasma-AUC during HT correlated well with Dox fluorescence in the tumor region-of-interest measured following HT (R2 = 0.63). Tumors were exposed to hyperthermia (43 °C) for either 15 min (blue dots) or 60 min (red dots). Data reproduced from [162] (published under CC BY 4.0 license).
