Efficient business in the field of transport requires knowledge based on logistics, logistics personnel and information technology which form an integrated system, which is called the logistics information system. Today, information systems are the ones who make the company more competitive, modern and efficient, so without their wide application it is impossible to survive on the market, which is very demanding in terms of optimization of logistic activities and processes. This paper presents the implementation of logistics information systems on the example of urban public transport company GSP „Belgrade“, whose main activity is the transport of passengers in urban and suburban traffic.
- logistics information systems
- urban public transport
1. Introduction
- Introduction
Bearing in mind the significant improvement of logistics of the 50-ies of the last century, numerous studies have been focused on this area in its various applications. The logistics helps to optimize existing processes, or services that are through management techniques aimed at promoting the efficiency and competitiveness of companies in the market.
Logistics service is a result of a series of coordinated, synchronized and related logistics processes and you can not improve the quality of services without improvement of all processes and activities in the logistics chain.
None of the logistics process can not exist without adequate information. Based on the above it can be concluded that the information is an important factor in every logistics process, regardless of logistics type. In modern times of market economy, the information is considered as one of the most important factors that contribute to an adequate business enterprises. With the informations received from the environment company gains knowledge about the needs of the society. Thanks to the information company designs and plans specific actions or processes which enable successful business and achieving competitive advantage on the market.
Technological changes in the world require innovation and improvement of the business strategy of the company. Those companies whose business is based on quick informing have the advantage. The market, where there is strong competition, requires efficient and quality business as well as higher quality of services, where information plays a crucial role. The right information at the right time at the right place provides opportunities for timely and adequate response to the stringent requirements of the market.
Logistics information system presented the result of informational and functional integration within the company. Integrated logistics information system is a computer-supported system, focused on providing support to management of integrated logistics activities and management within the logistics system. Information logistics system gives managers the information they need to make typically structured decisions in relation to the operational activities of the company.
The logistics information system is defined as a set of methods, processes and operations for collecting, storing, processing, transmission and distribution of data within a particular organization, including equipment that must be used for these purposes, as well as professional staff who perform certain activities. In severe market competition and a large number of providers of logistics services, to achieve the desired competitive advantage, it is necessary to have information at the right time, in order to adequately respond to certain changes in requirements, and this is achieved by applying information technologies[1].
The importance of logistics information systems for efficient operation and management of the company is reflected in the information that flows through logistic subsystems and connecting activities in these subsystems. In addition to process management, organization and control of processes and activities logistics contains information that follow goods form the source to the place of final delivery. Designed information system is a key element of the logistics supply chain, regardless of whether it was a profit or non-profit organizations[2].In order to be effective, modern logistics require cooperation and communication of logistics processes. Information technologies are a vital bond of all processes of the logistics chain and provides continuous real-time communications, apropos information technology ensure an efficient flow of product, services and information through logistics chain[3]
Transport presents logistics subsystem which causes the highest costs, so rationalizing of processes and activities which take place in a given system, it is possible to make certain savings. In order that this can be achieved, on the one hand, and to conduct adequate transport services which would meet the requirements of users, both in terms of delivery time, and in terms of characteristics of the goods transported, on the other hand, it is necessary that the entire transport process be supported by information systems [1]..
In this paper the subject of research is the analysis of the logistics information system, apropos analysis of system for "monitoring" public passenger transport which is implemented in the urban public transport company GSP "Beograd".
The aim of the research is to present the potential of logistics information systems in the proces of planning and optimization of logistics activities and services.
2. Availability Analysis of Vehicle Fleet
2. AVAILABILITY ANALYSIS OF VEHICLE FLEET
Urban public transport company GSP "Belgrade" (hereinafter: Company) has a fleet of 1.315 vehicles (Table 1), which, daily, participate in traffic on the 136 lines of public passenger transport (Table 12).
Table 1. The average number of vehicles in inventory by years.
TABLE I The average number of vehicles in inventory by years
|
Vehicle type/Year. |
2011 |
2012 |
2013 |
2014 |
2015 |
|
Tram |
206 |
218 |
231 |
241 |
235 |
|
Trolleybus |
144 |
131 |
131 |
129 |
125 |
|
Bus |
824 |
819 |
863 |
968 |
955 |
|
TOTAL |
1.174 |
1.168 |
1.125 |
1.338 |
1.315 |
Lines are designed and engineered so as to cover all parts of the city (the city line network covers over 12 city municipalities) and are based so that users have an alternative in the use of transport modes and overlapping of lines. The Company has six traffic subdivisions (four bus divisions, tram division and trolleybus division). Each traffic subdivision has a number of lines covered by their vehicles.
Traffic subdivisions are divided into two sectors: transport and vehicle maintenance sector. In the transport sector number of drivers is dominant while other staff performs the tasks of management, organization, retraining, and control of drivers and vehicles. This sector jobs belongs to the Head of Transport, Technical Associate, Associate for Road Safety, Driving Instructor and Dispatcher [4]
TABLE II The total number of (Table 2).lines in the daily traffic per year
Table 2. The total number of lines in the daily traffic per year.
|
Vehicle type/Year. |
2011 |
2012 |
2013 |
2014 |
2015 |
|
Tram |
11 |
10 |
10 |
10 |
10 |
|
Trolleybus |
8 |
7 |
7 |
7 |
7 |
|
Bus |
120 |
120 |
118 |
125 |
119 |
|
TOTAL |
139 |
137 |
135 |
142 |
136 |
The average age of the bus fleet is 9,17 years, trolleybus 6,61 years and the average age of tram fleet is 42,03 years. The average age of the entire fleet is 19,27 years.
On average, annually, vehicles of the Company exceed 73.423,6 km. The bus fleet is the most exploited (most are represented in traffic), they exceed 59.154,5 km, then tram fleet covering approximately 8.979,4 kilometers and trolleybus fleet covering approximately 5.289,7 km.
3. Overview of Current Information System
3. OVERVIEW OF CURRENT INFORMATION SYSTEM
Department for Public Transport of the city of Belgrade in 2015. year established a new system of "monitoring" public passenger transport which is based on GPS and GPRS (General Packet Radio Service) system for wireless data transmission through the mobile telephony network, as well as on GIS technology which is used to display the collected data on the electronic map. This system has been established in each traffic subdivision of the Company and represents the most modern technical and technological system designed for effective control and management of traffic. The basic functions of the system are: positioning, management, control, data collection and creating reports on transport activities. System management is performed from the Operational-control center (hereinafter: OCC), which performs the functions of receiving, sending, processing and storage of data, which allows vehicle monitoring on the lines of public passenger transport, recording frequency of traffic and passengers as well as other different types of analysis.
The most important feature of this system is Automatic Vehicle Location (hereinafter: AVL). AVL is a modern method for determining the exact geographical location of the vehicle, status monitoring during the transport operation and transfer of the gathered information to the place where it will make the best use to monitor and control the vehicle. The subsystem for vehicle monitoring allows constant (24 hours) monitoring. The vehicle location is determined using a GPS receiver installed in every vehicle that sends OCC data every 30 seconds of the current position of the vehicle with a maximum deviation of 20 meters (Figure 1). Informations about the vehicle available through this system are following: garage number of vehicles, identification number of the driver who drives the vehicle, number of line on which the vehicle is operating, as well as the direction of movement. Informations about the vehicle is sent to OCC via GSM network (using GPRS protocol) and stored in the database. Operator in OCC can monitor vehicles, create and analyze the necessary reports.
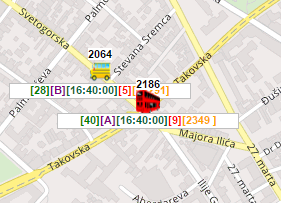
Figure 1Fig. 1 Overview of the vehicle location.
The flow of information goes both ways, which means that at any moment the operator in OCC and/or dispatcher of the traffic subdivision may provide information in the form of message to drivers on the lines of public passenger transport (Figure 2). This is highly important, because as a result of a certain event (traffic accident, passage of the delegation, malfunction on the tram and/or a trolleybus infrastructure, roadworks, events etc.) dispatcher can timely react and optimize the flow of traffic. Depending on the situation vehicle route can be modified or vehicles can be reassigned to other lines of public passenger transport. Information can be submitted to one or more vehicles simultaneously.
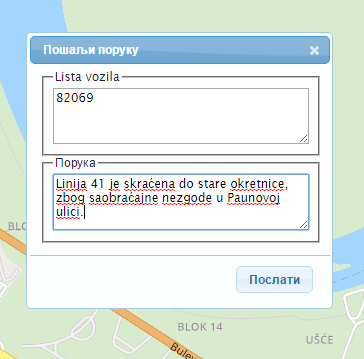
Figure 2Fig. 2 Overview of the information delivery (Figure translation: Пошаљи поруку – Send a message, Листа возила – List of vehicles, Порука – Message, Text of message: Line 41 is redirected to Banjica terminus due to traffic accident in Paunova street.)
In addition to vehicle monitoring in real time, the system enables vehicle monitoring in "past" time. This way the dispatchers of traffic subdivisions, Head of Transport and other users of the system have insight into the history of the vehicle. This feature of the system is important in terms of analysis: of the speed of the vehicle, time of departure and arrival at the terminus, and whether the vehicle stopped at each station (Figure 3). Vehicle monitoring in "past" time can be conducted for only one vehicle at a time.
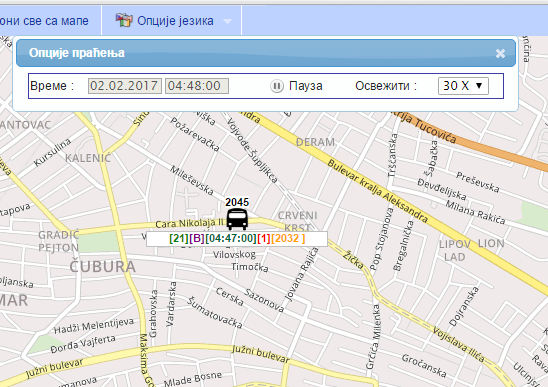
Figure 3Fig. 3 Overview of vehicle monitoring in "past" time.
The system also provides automatic alarming, or the ability to use the „panic button“ in the event of danger, which improves the level of safety for both employees and vehicles. Drivers panel is located in each vehicle and through that panel driver communicates with operator in OCC and/or dispatcher of the traffic subdivision. Drivers panel contains a set of „panic buttons“ (traffic accident, emergency services, vehicle malfunction, infrastructure malfunction, traffic blockade and drivers shift), which allows drivers to, depending on the situation, send a warning message, or notify dispatchers and/or operator in OCC, which among other things have a "task" to determine the position of the vehicle and inform the competent authorities. After the driver selects one of the „panic buttons“ at the same time, in OCC monitor appears information on: garage number of vehicle, type of "panic button", the number of line on which vehicle operates, location, direction of movement and the information about the driver. Also, dispatchers and operator in OCC can identify diversion of vehicles from a defined route, speeding, unauthorized activities, and take appropriate actions and measures. This way the response time in emergency situations is reduced (Figure 4).
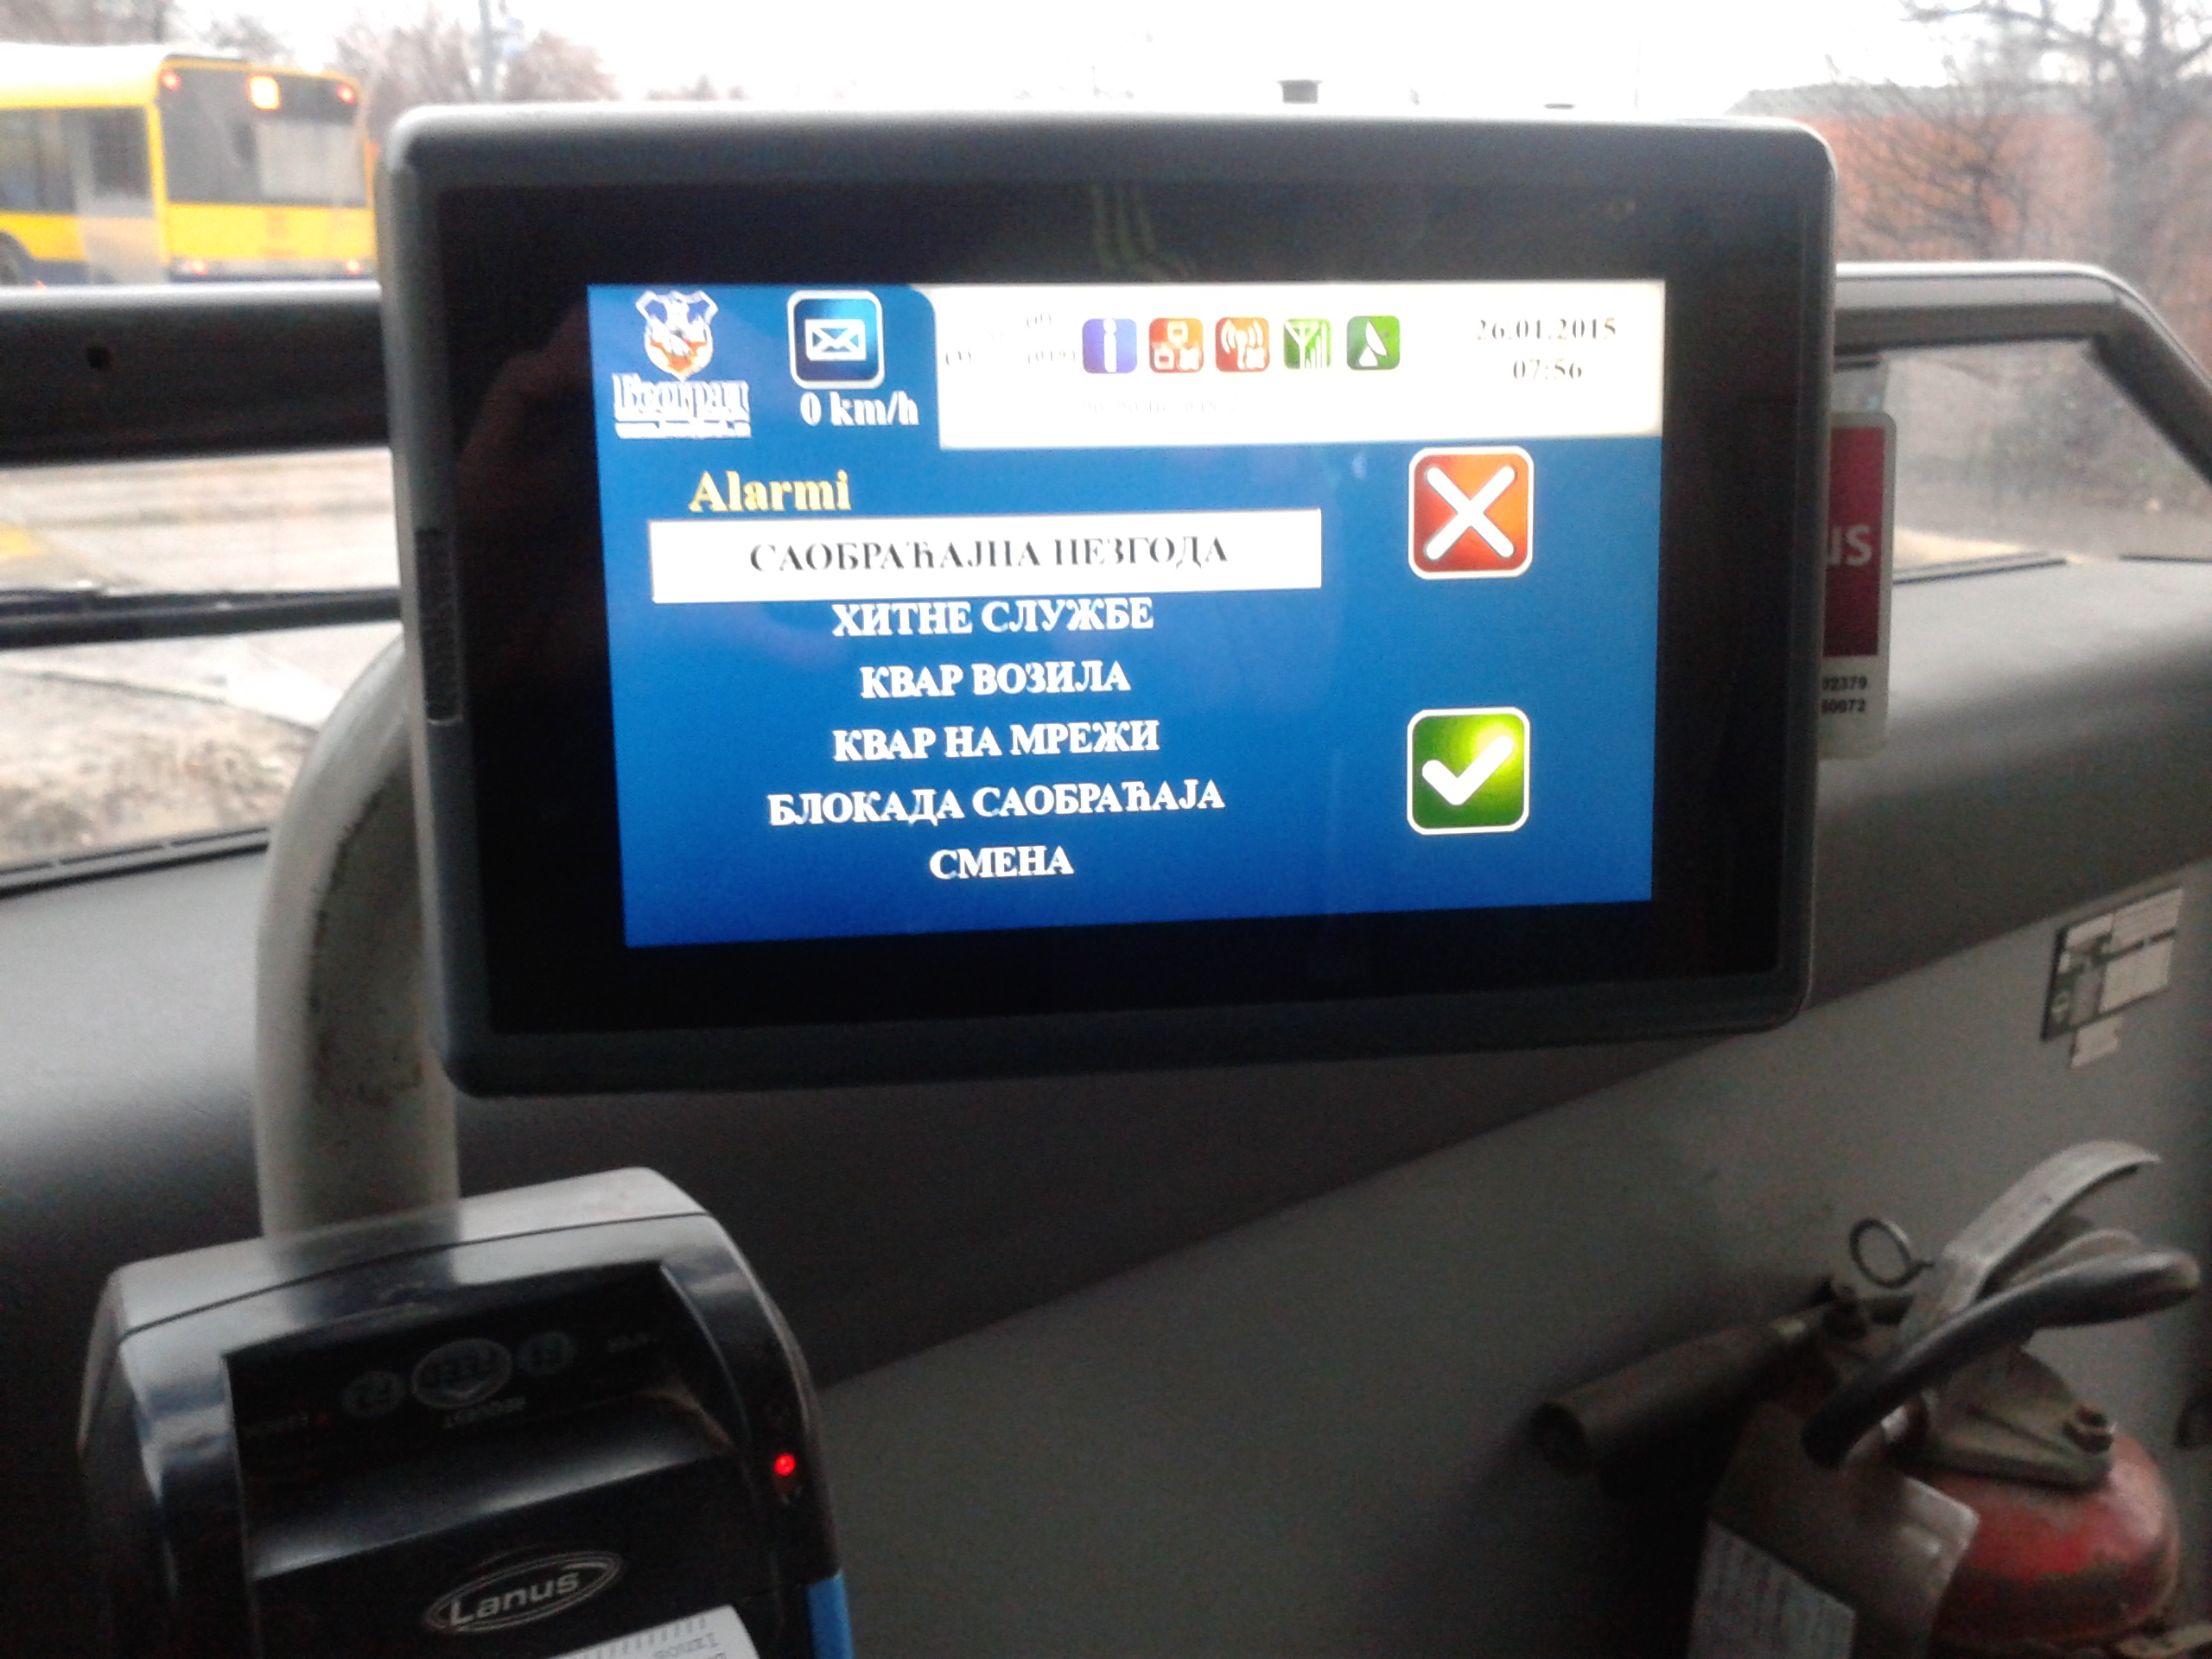 Figure 4Fig. 4 Overview of drivers panel.
In addition to the basic functions in the main menu, there is an option to generate all the necessary reports, aimed at more efficient fleet management as well as transport tasks. The data contained in the system are stored in the dispatch center and reports can be obtained for any earlier period. Reports are available in .xlsx, .xls, .pdf, .csv, .txt and .html format and are divided into three categories:
- Schedules - This group of reports provides an overview of work of drivers and vehicles on the lines of public passenger transport, the daily changes in the schedule of drivers (sick leave, days off, paid days off, etc.), the effective time of vehicle usage as well as an overview of the routes.
- Management Reports - This group of reports provides an overview of the "panic buttons" for the selected period, overview of the traffic flow and an overview of vehicle speed.
- Device management - This group of reports provides an overview of the state of equipment and devices for monitoring that are located in vehicles.
Report on the speed of vehicle (Figure 5) shows a diagram of speed of the selected vehicle at a given time interval. User defines period or a vehicle for which the report is generated. The report generates a two-dimensional diagram, where the X axis shows time (hours of work), and the Y axis shows speed from 0 km/h to 300 km/h. Based on the analysis of data from the chart, for example, it can be concluded that the driver of the vehicle exceeded the speed limit in the period from 6 PM to 7 PM (70 km/h).
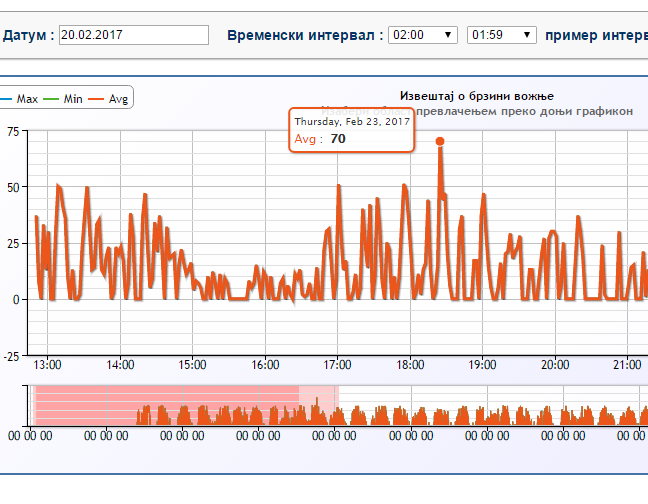
Figure 5Fig. 5 Diagram of speed.
The report presented in Figure 6 builds upon previous report and aims to show the user more detailed, in the form of tables, information on all exceeding’s of the speed limit on a particular line of public passenger transport in a selected period of time. The table contains the following information: garage number of vehicles, the number of line on which the vehicle is operating, information about the driver who drives the vehicle (name and identification number), start time of exceeding of speed limit, end time, total time, distance in km, average speed as well as the location where it was committed speeding. For example, based on an analysis of data from the table it can be concluded that on line 40, on 20.02.2017. year, where recorded three speedings in duration of 30 to 50 seconds. (Figure 6)
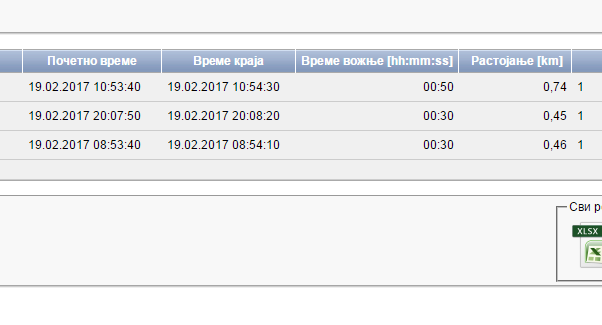
Figure 6Fig. 6 Overview of the report on exceeding the speed limit.
Report on the traffic flow is generated for each line separately and provides access to the data on hours of work of the vehicles, the number of laps as well as on the number of passengers transported. Data is shown for each vehicle separately and in total for the entire line. This report is very important in terms of the analysis of utilization capacity of vehicles on the observed line. Namely, if the utilization capacity of the vehicle is minimal the vehicle schedule can be altered by reducing the number of vehicles on the line and vice versa (Figure 7).
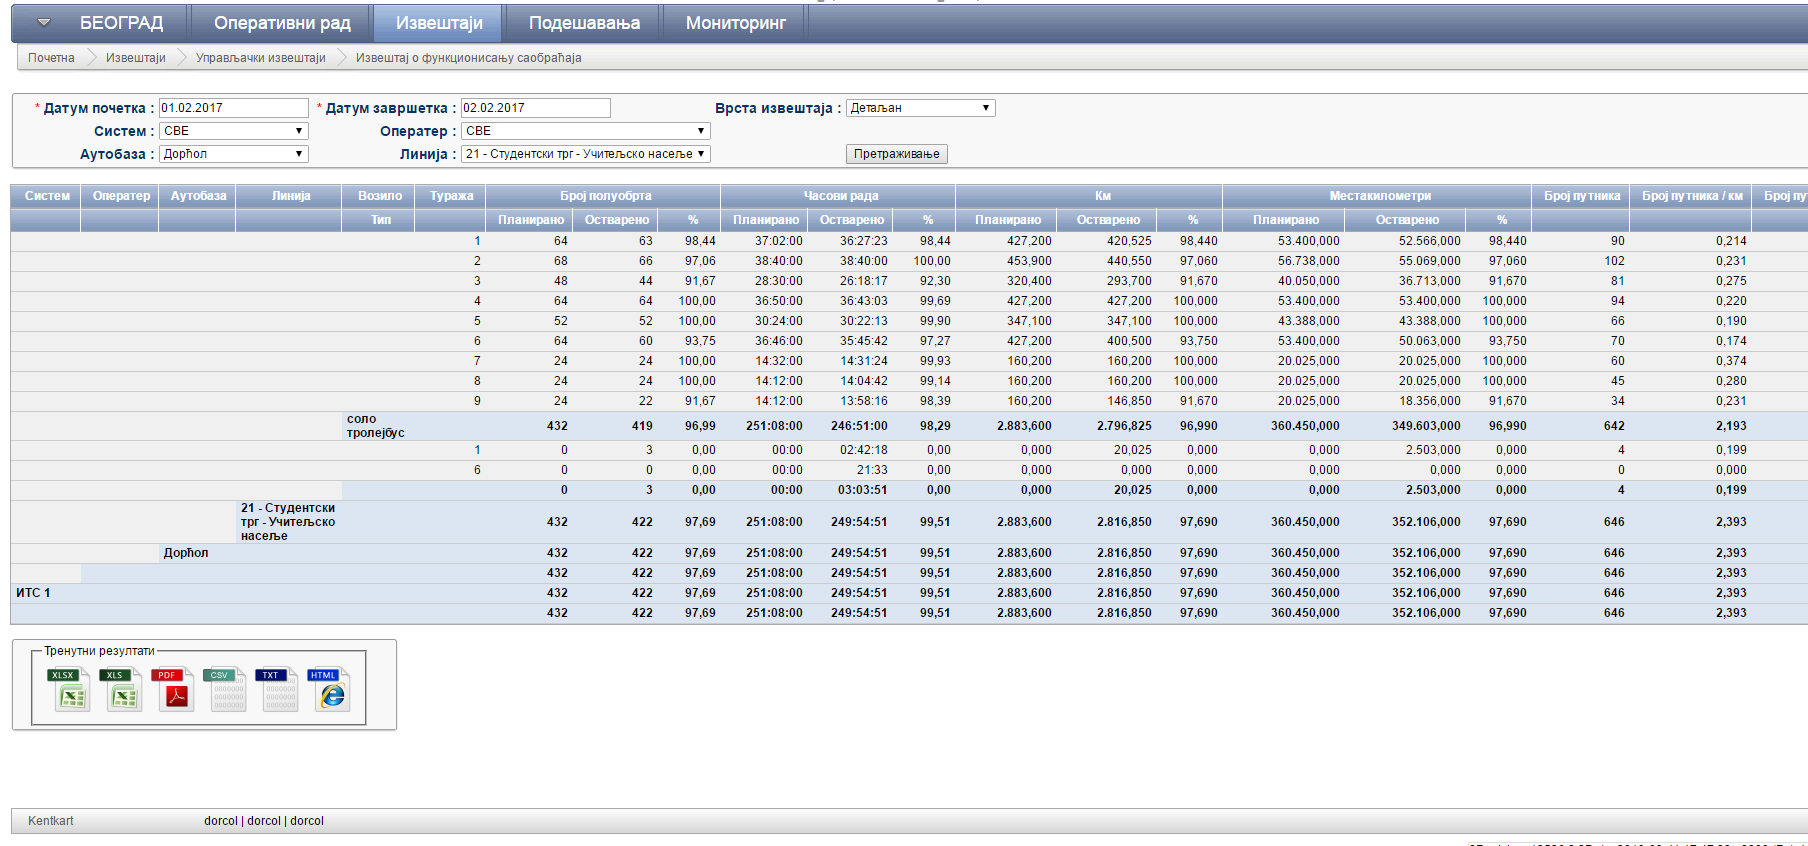
Figure 7Fig. 7 Overview of the report on traffic flow
4. Basic Elements of Information System4. BASIC ELEMENTS OF THE INFORMATION SYSTEM
The basic elements of the information system are: GPS/GPRS receivers that are installed in vehicles and Operational-control center (Figure 8).
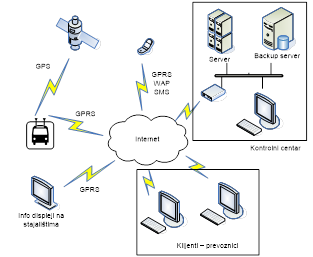
Figure 8Fig. 8 Information system components.
GPS / GPRS receivers are devices that are installed in vehicles and provide precise determination of vehicle position and data transfer to OCC. These devices, based on GPS signal continuously received from GPS satellites, accurately determine the position of the vehicle they are built in and via mobile network (using GPRS packet data) transmit position data (as well as other necessary data) to the main server in the OCC. It stores received data in the master and "backup" database and allows these data to be displayed to users of the system in real time, either via a client desktop GIS application or via a dedicated web page for displaying vehicle position on the map. Users can access data either from OCC or from any other device that has Internet access.
OCC is the most important part of the vehicle monitoring system and it consists of hardware and software components that enable real-time monitoring of vehicles. The basic hardware components are: computer - main server, computer - "backup" server, high resolution TFT monitors, UPS devices for continuous power, two modems for Internet access and additional equipment at the user's request (video, printer, etc.). The software configuration of the system includes several modules that allow the operation of the entire system, consisting of: Database, Module "Admin", GIS Client and Module "Reports".
Database is the basis for the operation of the system and it is located on two separate servers and contains data on: lines of public passenger transport, vehicles (type, basic characteristics of the vehicle etc.), drivers (ID number, first and last name, telephone etc.), graphical representation and analysis data (geo-coordinates), schedules and other data necessary for generating reports, as well as terrain data.
„Admin“ module is responsible for system settings as well as data security and privacy. This module provides mechanisms for configuring the entire GIS system. A set of functions provided by the „Admin“ module include: user administration, administration of GPS devices, administration of vehicle data, connection of devices and vehicles, "backup" of the database, system logging, synchronization and data exchange.
GIS Client provides a set of functions and tools for collecting, storing, searching, processing, and displaying geographically (spatially) vehicle data. The basic GIS functions that the GIS Client provides are: map view, continuous "movement" of the map and "viewing" of the map, zooming, distance measurement, positioning on the map, sending messages to drivers and the selection of layers.
5. Conclusion
High demand and large investments lead to the integration of individual solutions for the management of transport processes, thus achieving a significant effect. Due to the strict requirements of the market, today it is necessary to conduct monitoring of transport operations, in order to adequately respond to the requests that users set against the executors of daily transport activities. This in turn causes the possession of the appropriate information system which would allow a short time planning and optimization of transportation activities, assets, resources and execution of transportation plans. Increasing complexity and workload influenced that logistics information systems are vital to the development and operation of companies.
The application of logistics information systems in traffic, especially in transport, provides a wide range of benefits and options when it comes to effective management, monitoring and inspection in the fleet, as well as employees. With the help of logistics information systems, the companies may, among other things, determine the shortest route of vehicle movement and thus achieve a saving of resources, and reduce fuel consumption as well as mileage. Also, logistics information systems allow making of monthly and annual reports on fuel consumption, mileage, speed limits and reports on any other parameter. The application of logistics information system changes attitude of employees towards work, therefore they know that all activities they conduct will be recorded and analyzed.
Application of the logistics information system, described in the paper, leads to significant savings in the business, in such a way that through the increased efficiency and quality of services significantly reduce costs, which results in achieving a competitive advantage in the market.
The advantages of the system are reflected through:
- Access to the system from any computer with internet access;
- Using Google maps which are regularly updated;
- Monitoring in real time;
- Monitoring in "past" time;
- No need to install special software;
- Technical support during installation and expansion;
- Development of specific internet applications according to customer requirements;
- The ability to export data in an existing business system;
- The fastest delivery of complex and group reports etc.
The use of logistics information systems is recommended to: insurance companies, security services, transport companies, both domestic and international transportation, rental car agencies, taxi associations and courier agencies.
References
- Stević, Ž. (2015). Logistički informacioni sistem u transportnom preduzeću, Novi Horizonti 2015 – V međunarodni simpozijum, zbornik radova, str. 179-184, Doboj.
- Ivić, K. (2008). Utjecaj informacijskog sustava na management logistike, Poslovna logistika u suvremenom menadžmentu - VIII znanstveni skup s međunarodnim sudjelovanjem, zbornik radova, str. 141-151.
- Jujnović, I. (2011). The influence of information technology on the integration of logistics processes, Business logistics in modern management - XI scientific meeting with international participation, p. 293-307.
- Jovanović, M., Vukšić, V., Ivanišević, T. (2014). Analysis of the state of traffic safety in jkp gsp "Belgrade", Traffic safety in the local community 2014 - III international conference, proceedings, p. 263-272, Banja Luka.