The use of wearable body sensors for health monitoring is a quickly growing field with the potential of offering a reliable means for clinical and remote health management. This includes both real-time monitoring and health trend monitoring with the aim to detect/predict health deterioration and also to act as a prevention tool. The aim of this systematic review was to provide a qualitative synthesis of studies using wearable body sensors for health monitoring. The synthesis and analysis have pointed out a number of shortcomings in prior research. Major shortcomings are demonstrated by the majority of the studies adopting an observational research design, too small sample sizes, poorly presented, and/or non-representative participant demographics (i.e., age, gender, patient/healthy). These aspects need to be considered in future research work.
- health monitoring
- IoT
- physical activity monitoring
- qualitative synthesis
- remote health management
- research shortcomings
- sensor systems
- user demography
- wearable body sensors
1. Introduction
Introduction
The use of wearable body sensors for health monitoring as a means for supporting clinical and remote health monitoring in real-time and to provide health trend monitoring with the aim to predict/prevent health deterioration has the potential to lower the burden on the healthcare system and thereby reduce healthcare costs. The number of available wearable and wireless body sensors and systems are rapidly growing. Simultaneously, research on more energy-efficient and more accessible/smaller sensors for acquiring data as well as research on automatic data analysis of the Big Data, which the sensor-based systems are expected to generate, is being conducted. This advanced data analysis has the potential of generating personalized diagnoses and providing recommendations on treatments at a personalized level. While a promising area, we argue that the data collected for generating advanced data analysis algorithms need to come from participants representing the expected users of these systems.
The use of wearable body sensors for health monitoring as a means for supporting clinical and remote health monitoring in real-time and to provide health trend monitoring with the aim to predict/prevent health deterioration has the potential to lower the burden on the healthcare system and thereby reduce healthcare costs. The number of available wearable and wireless body sensors and systems are rapidly growing. Simultaneously, research on more energy-efficient and more accessible/smaller sensors for acquiring data as well as research on automatic data analysis of the Big Data, which the sensor-based systems are expected to generate, is being conducted. This advanced data analysis has the potential of generating personalized diagnoses and providing recommendations on treatments at a personalized level. While a promising area, we argue that the data collected for generating advanced data analysis algorithms need to come from participants representing the expected users of these systems.This systematic review provides a qualitative synthesis of the articles retrieved on using wearable body sensors for health monitoring. We analyze the articles from many perspectives including author affiliations in countries, publication years, context of use, sensor category, research methodology, sample sizes, and participant demographics (i.e., age, gender, patient/healthy). This analysis has identified a number of shortcomings in prior research with respect to both sample size, but also to participant demographics where the latter strongly affects the validity of the results. These shortcomings need to be considered in future research, not only for understanding the user experience, but also to ensure that the advanced data analysis algorithms can reason on data which are representative and valid for the expected users of the systems.
This systematic review provides a qualitative synthesis of the articles retrieved on using wearable body sensors for health monitoring. We analyze the articles from many perspectives including author affiliations in countries, publication years, context of use, sensor category, research methodology, sample sizes, and participant demographics (i.e., age, gender, patient/healthy). This analysis has identified a number of shortcomings in prior research with respect to both sample size, but also to participant demographics where the latter strongly affects the validity of the results. These shortcomings need to be considered in future research, not only for understanding the user experience, but also to ensure that the advanced data analysis algorithms can reason on data which are representative and valid for the expected users of the systems.2. Qualitative Synthesis
Inspired by Kekade et al.’s review from 2018 [2], we conducted a qualitative synthesis of the 73 included research articles. They were published between 2010 and 2019, i.e., spanning approx. 9.5 years, among which one article was published in 2010, two in 2011, seven in 2012, two in 2013, seven in 2014, twelve in 2015, nine in 2016, fourteen in 2017, fourteen in 2018 and five before April 24th 2019, see Figure 2. In average, 7.6 articles were published per year during the period 2010–2018. The authors of the 73 research articles were affiliated in 32 countries representing six continents (Africa, Asia, Australia, Europe, North America and South America). See Figure 3 and Figure 4 for further information on which countries authors are affiliated in and the number of publications per country with affiliated authors. The articles were sorted into the following article categories: Asthma/COPD, Cardiovascular diseases, Diabetes and nutrition, Gait and fall, Neurological diseases, Physical activity recognition, Rehabilitation, and Stress and sleep. All articles not directly related to any of the aforementioned article categories were sorted into an article category named Additional. Figure 5 depicts the category-wise distribution of the selected articles. Studying the distribution of articles related to health and physical activity monitoring respectively, it can be seen that 47 % of the articles were related to health (Asthma/COPD, Cardiovascular diseases, Diabetes and Nutrition, Neurological diseases, and Stress and sleep). As much as 39 % of the articles were related to physical activity monitoring (Gait and fall, Physical activity recognition, and Rehabilitation). It is unclear why such a large portion of the articles were related to physical activity monitoring. Possible reasons include that it is easier to monitor physical activity using sensors whereas measures relating to health, e.g., vital signs, need to be provided in a more timely manner.Inspired by Kekade et al.’s review from 2018 [[1]], we conducted a qualitative synthesis of the 73 included research articles. They were published between 2010 and 2019, i.e., spanning approx. 9.5 years, among which one article was published in 2010, two in 2011, seven in 2012, two in 2013, seven in 2014, twelve in 2015, nine in 2016, fourteen in 2017, fourteen in 2018 and five before April 24th 2019, see Figure 1. In average, 7.6 articles were published per year during the period 2010–2018. The authors of the 73 research articles were affiliated in 32 countries representing six continents (Africa, Asia, Australia, Europe, North America and South America). See Figure 2 and Figure 3 for further information on which countries authors are affiliated in and the number of publications per country with affiliated authors. The articles were sorted into the following article categories: Asthma/COPD, Cardiovascular diseases, Diabetes and nutrition, Gait and fall, Neurological diseases, Physical activity recognition, Rehabilitation, and Stress and sleep. All articles not directly related to any of the aforementioned article categories were sorted into an article category named Additional. Figure 4 depicts the category-wise distribution of the selected articles. Studying the distribution of articles related to health and physical activity monitoring respectively, it can be seen that 47 % of the articles were related to health (Asthma/COPD, Cardiovascular diseases, Diabetes and Nutrition, Neurological diseases, and Stress and sleep). As much as 39 % of the articles were related to physical activity monitoring (Gait and fall, Physical activity recognition, and Rehabilitation). It is unclear why such a large portion of the articles were related to physical activity monitoring. Possible reasons include that it is easier to monitor physical activity using sensors whereas measures relating to health, e.g., vital signs, need to be provided in a more timely manner.
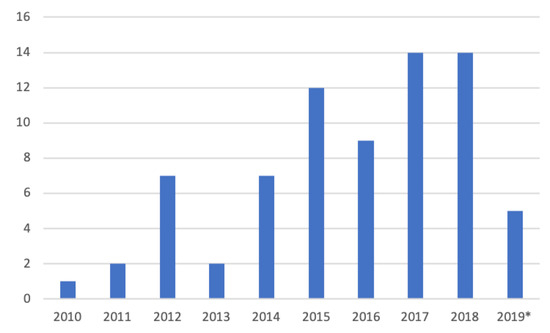
Figure 12. Number of articles per year. * only the articles published prior to 24 April 2019 are counted.
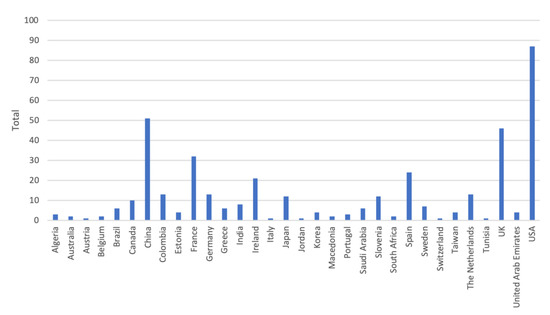
Figure 23. Number of authors affiliated in each country. Authors are calculated for each article, i.e., an author may be calculated more than once and in more than one country.
Number of authors affiliated in each country. Authors are calculated for each article, i.e., an author may be calculated more than once and in more than one country.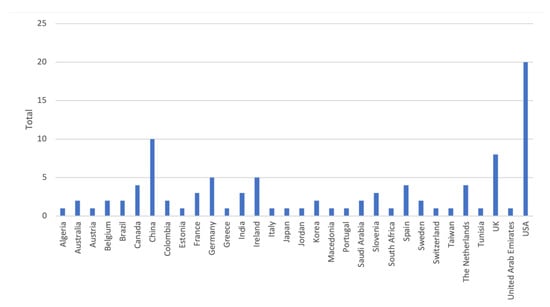
Figure 34. Number of articles per country. Papers with several authors may be counted for several countries.
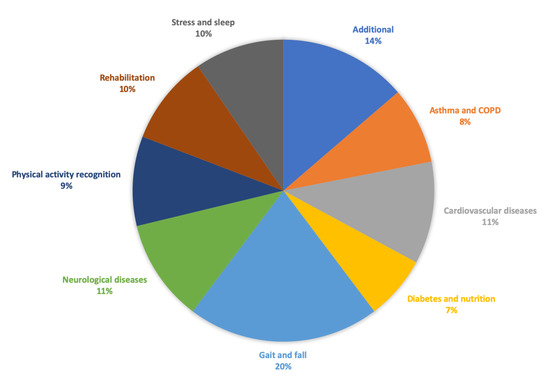
Figure 45. Category-wise distribution of the selected articles. Number of articles for Additional = 10, Asthma/COPD = 6, Cardiovascular diseases = 8, Diabetes and nutrition = 5, Gait and fall = 15, Neurological diseases = 8, Physical activity recognition = 7, Rehabilitation = 7, Stress and sleep = 7.
Category-wise distribution of the selected articles. Number of articles for Additional = 10, Asthma/COPD = 6, Cardiovascular diseases = 8, Diabetes and nutrition = 5, Gait and fall = 15, Neurological diseases = 8, Physical activity recognition = 7, Rehabilitation = 7, Stress and sleep = 7.Sixty research articles reported on studies conducted with people at some level, these are reported in Table 1. We categorized the sensors according to the sensor categories used in [1], namely, physical activity, vital signs, electrocardiography (ECG) and other. Studies reporting on devices measuring movement or activity were classified under the sensor category physical activity. Vital signs include the parameters: blood pressure (BP), body temperature (BT), respiratory rate (RR), heart rate (HR)/pulse, and peripheral oxygen saturation (SpO
Sixty research articles reported on studies conducted with people at some level, these are reported in Table 2. We categorized the sensors according to the sensor categories used in [2], namely, physical activity, vital signs, electrocardiography (ECG) and other. Studies reporting on devices measuring movement or activity were classified under the sensor category physical activity. Vital signs include the parameters: blood pressure (BP), body temperature (BT), respiratory rate (RR), heart rate (HR)/pulse, and peripheral oxygen saturation (SpO2). Studies measuring ECG were classified under ECG. Finally, studies using sensors for diabetes, swallowing, etc., or a combination of sensors from several sensor categories were classified under the sensor category other. The sensor categories physical activity and other include 23 studies each, vital signs includes three studies, and ECG includes ten studies reported upon in seven research articles.
). Studies measuring ECG were classified under ECG. Finally, studies using sensors for diabetes, swallowing, etc., or a combination of sensors from several sensor categories were classified under the sensor category other. The sensor categories physical activity and other include 23 studies each, vital signs includes three studies, and ECG includes ten studies reported upon in seven research articles.Table 12. List of articles reporting on conducted studies. —indicates that information is missing.
|
Author, Year |
Ref. |
Article Category |
Research Design |
No. of Participants |
Sensor Category |
4–8 | |||||
Vital signs | |||||
Wu et al. 2018 | |||||
[ | |||||
] | |||||
Additional | |||||
Observational | |||||
20 | |||||
ECG | |||||
Similarly to Kekade et al. 2018 [1], we also assessed the studies’ reporting of research design (Table 1), and the reported participant demography, i.e., number of participants, age, gender and the distribution of healthy participants and patients (Table 2). Many studies presented the participant demographics poorly, or not at all [10][27][38][39][40][42][43][55][59][60]. Rather than excluding these from the tables, we indicate missing information with a “-”. However, we question the fact that all these studies were accepted for publication without providing any information on the participants.

Table 23. Demographic information on conducted studies. - indicates that information is missing.
|
Ref. |
Article Category |
No. of Participants |
Age Group |
Age Statistics |
Male |
Female |
Patient |
Healthy |
||||||
|
Bonnevie et al. 2019 |
[[2]] |
|||||||||||||
|
[2] |
Asthma/COPD |
Observational |
104 |
Vital signs |
||||||||||
|
Asthma/COPD |
104 |
57–70 |
64 |
67 (64%) |
37 (36%) |
104 |
5 |
|||||||
|
Caulfield et al. 2014 |
[[3]] |
Asthma/COPD |
Observational |
10 |
Physical activity |
|||||||||
|
Estrada et al. 2016 |
[[4]] |
Asthma/COPD |
Observational |
1 |
Other |
|||||||||
|
Katsaras et al. 2011 |
[[5]] |
|||||||||||||
|
5 |
50–66 |
62 |
- |
- |
5 |
|||||||||
|
[62] |
Asthma/COPD |
10 |
61.5 ± 5.7 |
5 |
5 |
10 |
Asthma/COPD |
Randomized control |
48 |
Other |
||||
|
Naranjo-Hernández et al. 2018 |
[6] |
Asthma/COPD |
Observational |
2 |
Vital signs |
|||||||||
|
9 |
||||||||||||||
|
Huang et al. 2014a |
[7] |
Cardiovascular diseases |
- |
225 |
ECG |
|||||||||
|
Huang et al. 2014b |
[[8]] |
Cardiovascular diseases |
Case-control |
84 |
ECG |
|||||||||
|
Javaid et al. 2018 |
[9] |
Cardiovascular diseases |
Observational |
60 |
Other |
|||||||||
|
Li et al. 2019 |
[[10]] |
Cardiovascular diseases |
Observational |
16 |
Other |
|||||||||
|
Raad et al. 2015 |
[11] |
Cardiovascular diseases |
- |
30 |
ECG |
|||||||||
|
- |
2 |
|||||||||||||
- | - |
- |
- |
2 |
- |
Simjanoska et al. 2018 |
||||||||
|
[[12]] |
[[12]] |
Cardiovascular diseases |
Cardiovascular diseases |
16 |
Observational |
16–72 | 16 |
- |
ECG |
|||||
- |
- |
- |
3 |
|||||||||||
- | ||||||||||||||
|
3 |
25–27 |
- |
- |
- |
- |
- |
||||||||
|
25 |
20–73 |
25 |
||||||||||||
- |
- |
- |
14 |
11 |
||||||||||
|
7 |
7 |
20–74 |
Dataset ECG |
|||||||||||
- |
- |
- |
- |
7 |
Susič and Stanič 2016 |
|||||||||
|
[[13]] |
[13] |
Cardiovascular diseases |
Cardiovascular diseases |
13 |
- |
- |
13 |
ECG |
||||||
50.6±9 |
8 |
5 |
- |
13 |
Al-Taee et al. 2015 |
|||||||||
|
[[14] |
[[14]] |
] |
Diabetes and nutrition |
- |
Diabetes and nutrition |
22 | 22 |
- |
- |
Other |
||||
|
Alshurafa et al. 2014 and Alshurafa et al. 2015 |
Diabetes and nutrition |
Observational |
10 |
Other |
||||||||||
|
20 |
||||||||||||||
|
Dong and Biswas 2017 |
[17] |
Diabetes and nutrition |
Observational |
14 |
Other |
|||||||||
|
Onoue et al. 2017 |
[18] |
Diabetes and nutrition |
Randomized control |
101 |
Physical activity |
|||||||||
|
Atallah 2012 |
[19] |
Gait and fall |
Observational |
34 |
Physical activity |
|||||||||
- | - |
22 |
- |
|||||||||||
|
Diabetes and nutrition |
10 |
20–40 |
- |
8 |
2 |
- |
- |
|||||||
|
20 |
20–40 |
- |
12 |
8 |
- |
- |
||||||||
|
[[17]] |
Diabetes and nutrition |
14 |
- |
9 |
5 |
- |
14 |
|||||||
|
[[18]] |
Diabetes and nutrition |
101 |
57.1±12.5 |
56 |
45 |
101 |
- |
|||||||
|
[[19]] |
Gait and fall |
34 |
- |
28.22±12.77 |
21 |
13 |
- |
34 |
Godfrey et al. 2014 |
|||||
|
[[20]] |
[20] |
Gait and fall |
Gait and fall |
24 (12/12) |
Observational |
20–40 |
24 |
32.5±4.8 |
Physical activity |
|||||
7 | 5 |
- |
12 |
Lee et al. 2015 |
[[21]] |
Gait and fall | ||||||||
|
Gait and fall |
- |
Observational |
- | 11 |
65.0±8.8 |
Physical activity |
||||||||
5 |
7 |
- |
12 |
Liang et al. 2012 |
[ | |||||||||
|
[[21]] | 22] |
Gait and fall |
Gait and fall |
11 |
Observational |
- | 8 |
27.6±4.3 |
Physical activity |
|||||
11 |
- |
- |
11 |
Liang et al. 2018 |
[ | |||||||||
|
[[22]] | 23] |
Gait and fall |
Observational |
18 |
Physical activity |
|||||||||
|
Gait and fall |
8 |
- |
23±3.45 |
8 |
- |
- |
8 |
Paiman et al. 2016 |
[ | |||||
|
[[23]] | [24]] |
Gait and fall |
Gait and fall |
18 |
Observational |
- |
2 |
Other |
||||||
25±3.24 |
12 |
6 |
- |
18 |
Tino et al. 2011 |
[[25]] |
Gait and fall |
Observational |
||||||
|
[[ | 3 |
Other |
||||||||||||
24]] |
Gait and fall |
2 |
28 and 24 |
- |
1 |
1 |
- |
2 |
Williams et al. 2015 |
[26] |
Gait and fall |
Observational |
5–6 |
Physical activity |
|
Wu et al. 2013 |
[27] |
Gait and fall |
Observational |
7 |
Physical activity |
|||||||||
|
Wu et al. 2019 |
[[28 |
|||||||||||||
|
[[4]] |
Asthma/COPD |
1 |
- |
- |
1 |
65 |
Other |
|||||||
1 | ||||||||||||||
|
[5] |
Asthma/COPD |
48 |
- |
- |
48 |
48 |
||||||||
|
[[6]] |
Asthma/COPD |
2 |
36 and 42 |
2 |
2 |
|||||||||
|
9 |
55–76 |
64±6.6 |
6 |
3 |
9 |
2 |
||||||||
|
[[25]] |
Gait and fall |
3 |
40–70 |
]] |
||||||||||
|
[[7]] |
Cardiovascular diseases |
225 |
- |
- |
- |
- |
225 |
- |
||||||
|
[[8]] | - |
- |
- |
- |
- |
|||||||||
|
[[26]] |
Gait and fall |
5–6 (1/5) |
27 |
- |
1 |
- |
- |
- |
Gait and fall |
Observational |
15 |
Physical activity |
||
|
- |
21–36 |
27 |
4 |
1 |
- |
- |
Zhao et al. 2012 |
[29 | ||||||
|
[[27]] | ] |
Gait and fall |
Observational |
Gait and fall |
7 | 8 |
- |
- |
Physical activity |
|||||
- | - |
- |
- |
Zhong et al. 2019 |
[30] |
Gait and fall |
Observational |
|||||||
|
[[28]] | 56 |
Physical activity |
||||||||||||
|
Gait and fall |
15 |
20–27 |
- |
- |
- |
- |
15 |
Giuberti et al. 2015 |
[31 | |||||
|
[[29]] | ] |
Neurological diseases |
Observational |
Gait and fall |
8 | 24 |
- |
Physical activity |
||||||
28.5±4.3 |
- |
- |
- |
8 |
Gong et al. 2015, Gong et al. 2016 | |||||||||
|
[[30]] |
Gait and fall |
20 |
||||||||||||
|
Cardiovascular diseases |
Rednic et al. 2012 |
[41] |
Physical activity recognition |
Observational |
17 |
Physical activity |
||||||||
|
Xu et al. 2014 |
[42] |
Physical activity recognition |
Observational |
14 |
Other |
|||||||||
|
Xu et al. 2016 |
[43] |
Physical activity recognition |
Observational |
4 |
Other |
|||||||||
|
3 |
Physical activity |
|||||||||||||
|
5 |
||||||||||||||
|
6 |
||||||||||||||
84 |
- |
- |
- |
- |
1 group |
1 group |
||||||||
|
[[9]] |
Cardiovascular diseases |
60 |
- |
26.9±6.1 |
28 |
32 |
- |
60 |
||||||
|
[[10]] |
Cardiovascular diseases |
16 |
- |
- |
- |
- |
- |
- |
||||||
|
[[11]] |
Cardiovascular diseases |
30 |
20–23 |
- |
- |
- |
- |
- |
||||||
|
2 |
Neurological diseases |
56 (28/28) |
Case-control |
41 |
Physical activity |
|||||||||
- |
24.6±2.7 |
14 |
14 |
- |
28 |
Kuusik et al. 2018 |
[34] |
Neurological diseases |
Observational |
51 |
||||
|
- |
>55 |
66.1±5.0 |
Physical activity |
|||||||||||
18 | 10 |
- |
28 |
Sok et al. 2018 |
||||||||||
|
[[31]]] | ] |
Neurological diseases |
Observational |
Neurological diseases |
24 | 13 |
31–79 |
Physical activity |
||||||
65.9±12.3 |
17 |
7 |
24 |
- |
Stamate et al. 2017 and Stamate et al. 2018 |
|||||||||
|
Neurological diseases |
Neurological diseases |
41 (28/13) | Observational |
- |
12 |
40.5±9.4 |
Other |
|||||||
25% | 25% |
28 |
13 |
Castro et al. 2017 and Rodriguez et al. 2017 |
Physical activity recognition |
|||||||||
|
- |
Observational |
- | 3 |
39.3±10.3 |
Other |
|||||||||
47% |
53% |
- |
- |
Doron et al. 2013 |
||||||||||
|
[[34]] |
[40] |
Physical activity recognition |
Neurological diseases |
51 |
Observational |
- |
- |
- |
- |
51 |
- |
|||
|
[[35]] |
Neurological diseases |
13 |
22–50 |
- |
9 |
4 |
13 |
- |
||||||
|
Neurological diseases |
12 |
- |
- |
- |
- |
12 |
- |
|||||||
|
Physical activity recognition |
3 |
- |
- |
- |
- |
- |
- |
|||||||
|
[[40]] |
Physical activity recognition |
65 |
- |
- |
- |
- |
- |
- |
||||||
|
20 |
- |
- |
Argent et al. 2019 |
[[44]] |
Rehabilitation |
Observational |
15 |
Physical activity |
||||||
|
Banos et al. 2015 |
[[45]] |
Rehabilitation |
Observational |
10 |
Other |
|||||||||
- | - |
- |
- |
|||||||||||
|
[[41]] |
Physical activity recognition |
17 |
- |
- |
10 |
7 |
- |
- |
||||||
|
[[42]] |
Physical activity recognition |
14 |
- |
- |
- |
- |
- |
- |
||||||
|
[[43]] |
Physical activity recognition |
4 |
- |
- |
- |
- |
- |
- |
||||||
|
3 |
- |
- |
- |
- |
- |
3 |
Lee et al. 2018 |
[46] |
Rehabilitation |
Case-control |
30 |
|||
|
5 |
Physical activity |
|||||||||||||
- |
- |
- |
- |
5 |
- |
Timmermans et al. 2010 |
[47] |
Rehabilitation |
Observational |
9 |
||||
|
6 |
- |
- |
Physical activity |
|||||||||||
3 | 3 |
- |
- |
Whelan et al. 2017 |
[48] |
Rehabilitation |
Observational |
|||||||
|
[[44]] |
Rehabilitation | 55 |
15 |
- |
63±8.32 |
Physical activity |
||||||||
6 | 9 |
15 |
- |
Xu et al. 2017 |
[[49 | |||||||||
|
[[45]] | ]] |
Rehabilitation |
Rehabilitation |
10 |
Observational |
6 |
Other |
|||||||
21–37 |
- |
8 |
2 |
- |
- |
Lin et al. 2012 |
[[50]] |
Stress and sleep |
||||||
|
[[46 | Case-control |
] |
18 (6/12) |
Physical activity |
||||||||||
] |
Rehabilitation |
20 |
- |
54.4±10.1 |
- |
- |
20 |
- |
Nakamura et al. 2017 |
[[51]] |
Stress and sleep |
Observational |
4 |
Other |
|
Parnandi and Gutierrez-Osuna 2017 |
[52] |
Stress and sleep |
||||||||||||
|
10 |
- |
53.8±11.4 |
- |
- |
- |
10 |
Randomized control |
25 |
||||||
|
[[47]] |
Rehabilitation |
9 |
Other |
|||||||||||
- |
60.7 |
5 |
4 |
9 |
- |
Uday et al. 2018 |
[53] |
Stress and sleep |
Observational |
10 |
Other |
|||
|
[[48]] |
Rehabilitation |
55 |
- |
24.21±5.25 |
37 |
18 |
- |
55 |
Umemura et al. 2017 |
|||||
|
[[49]] |
[[54]] |
Stress and sleep |
Case-control |
54 |
Other |
|||||||||
|
Rehabilitation |
6 |
- |
72.5±6.0 |
3 |
3 |
- |
- |
Velicu et al. 2016 |
||||||
|
[[50]] |
[55] |
Stress and sleep |
Stress and sleep |
Observational |
18 (6/12) |
- |
19–22 overall |
- |
||||||
- |
5 |
1 |
Ayzenberg and Picard 2014 |
[56] |
Additional |
Crossover |
10 |
Other |
||||||
- | - | |||||||||||||
|
- |
- |
- |
11 |
1 |
- |
- |
Pagán et al. 2016 |
[[57]] |
Additional |
|||||
|
[[51 | Observational |
] |
2 |
Other |
||||||||||
] |
Stress and sleep |
4 |
25–36 |
- |
4 |
- |
- |
4 |
Rawasdeh et al. 2017 |
[58] |
Additional |
|||
|
[[52]] |
Stress and sleep | Observational |
25 |
19–33 |
55 |
ECG |
||||||||
- |
15 |
10 |
- |
- |
Seeger et al. 2012 |
|||||||||
|
[[53]] |
[59] |
Additional |
- |
Stress and sleep |
- |
10 |
- |
Other |
||||||
- |
- |
- |
- |
10 |
Wannenburg and Malekian 2015 |
|||||||||
|
[[54]] |
[60] |
Stress and sleep |
Additional |
Observational |
54 (26/28) |
- |
22 |
- |
- |
- |
54 |
|||
|
- |
- |
21 |
- |
- |
- |
- |
||||||||
|
[[55]] |
Stress and sleep |
- |
- |
- |
- |
- |
- |
- |
||||||
|
[[56]] |
Additional |
10 |
25–35 |
30.8±4.2 |
9 |
1 |
- |
10 |
||||||
|
[[57]] |
Additional |
2 |
- |
- |
- |
2 |
2 |
- |
||||||
|
[[58]] |
Additional |
55 |
18–22 |
- |
50% |
50% |
- |
- |
||||||
|
[[59]] |
Additional |
- |
- |
- |
- |
- |
- |
- |
||||||
|
[[60]] |
Additional |
4–8 (4/4) |
- |
- |
- |
- |
- |
- |
||||||
|
- |
- |
- |
- |
- |
- |
- |
||||||||
|
[[61]] |
Additional |
20 |
- |
- |
- |
- |
- |
- |
For completeness, the remaining 13 articles not listed in Table 1 and Table 2 were distributed over eight article categories: Asthma/COPD [[63]], Cardiovascular diseases [64], Gait and fall [[65][66][67]], Neurological diseases [[68]], Physical activity recognition [[69]], Rehabilitation [[70]], Stress and sleep [[71]], and Additional [[72][73][74][75]]. Six articles report on systems where studies are upcoming [63][64][72][73][74][75]]. One of them [64] is a continuation of the study reported in [[13]]. Three articles report on studies using datasets [[66][67][69]. Two articles report on qualitative studies of observational and/or interview nature [68][70]. The continuation of the qualitative study [[70]] is reported upon in [[44]]. The evaluation in [65] is not clearly presented and the system developed in [71] uses wearable body sensors only to collect ground truth data for a contactless sleep monitoring system. Therefore, [71] was excluded from further qualitative analysis.
Demographic information on conducted studies. - indicates that information is missing.3. Discussion and Conclusions
Discussion and Conclusions
In this systematic review, we provide a qualitative synthesis on retrieved articles on using wearable body sensors for health monitoring. The articles found were categorized as relating to: Asthma/COPD, Cardiovascular diseases, Diabetes and Nutrition, Gait and fall, Neurological diseases, Physical activity recognition, Rehabilitation, Stress and sleep, and Additional. Section 3 provided a qualitative synthesis of the studies with respect to research methodology and participant demography, i.e., number of participants, age, gender and the distribution of healthy participants and patients. Using this information, we have identified a number of shortcomings. Below follows a discussion on these shortcomings in relation to prior research. There are many age-related health issues such as changing biological factors, the onset of illnesses which are often chronic and the decline of cognitive abilities. For example, “fall prediction is a challenging problem due to the combination of intrinsic and extrinsic fall risk factors that contribute to a fall. Intrinsic factors include age, fall history, mobility impairments, sleep disturbances, and neurological disorders", pp. 1 [76]. It is reported in [77] that 35% of non-institutionalized adults had abnormal gait and that sleep disturbances are very common among older people. Further, chronic conditions affect physical activity levels, and activities such as rising from a chair is demanding for older people [77]. It is clear that the whole motion pattern changes with age and the onset of illnesses related to the human locomotor system. Yet, the majority of the studies focusing on gait and fall in this review were simulations that include none or few old participants. This shortcoming is also discussed in [76], “It is evident that existing systems have mainly been tested in laboratory environments with controlled conditions and do not include frequent fallers and aging adults as test subjects.[.] future work should focus on longitudinal studies of fall detection and prediction systems in real-life conditions on a diverse group that includes frequent fallers, aging adults, and persons with neurological disorders.” p.8 [76]. Not studying the sensor systems in real-life conditions affect the validity of the results since the performance is not studied in realistic conditions. The low number of studies with older people is also a shortcoming since age-related issues are not taken into consideration to a sufficient degree. There are many differences between the two genders. As a first example, we want to mention the American Heart Association’s (AHA) scientific statement from 2016 [78] on acute myocardial infarction (AMI) in women. “Sex differences occur in the pathophysiology and clinical presentation of MI and affect treatment delays.”, p. 932 [78]. Further, AHA reports that the same perfusion therapies are recommended despite the fact that the risk of bleeding or other complications is higher among women. Further, women are being under-treated with guideline recommendations. This results in increased readmission, re-infarction, and death rates during the first year after a myocardial infarction. Cardiac rehabilitation is also underused and under-prescribed among women [78]. On the same lines, the results of a cohort study [79] with almost 5000 patients μageThere are many age-related health issues such as changing biological factors, the onset of illnesses which are often chronic and the decline of cognitive abilities. For example, “fall prediction is a challenging problem due to the combination of intrinsic and extrinsic fall risk factors that contribute to a fall. Intrinsic factors include age, fall history, mobility impairments, sleep disturbances, and neurological disorders", pp. 1 [76]. It is reported in [77] that 35% of non-institutionalized adults had abnormal gait and that sleep disturbances are very common among older people. Further, chronic conditions affect physical activity levels, and activities such as rising from a chair is demanding for older people [77]. It is clear that the whole motion pattern changes with age and the onset of illnesses related to the human locomotor system. Yet, the majority of the studies focusing on gait and fall in this review were simulations that include none or few old participants. This shortcoming is also discussed in [76], “It is evident that existing systems have mainly been tested in laboratory environments with controlled conditions and do not include frequent fallers and aging adults as test subjects.[.] future work should focus on longitudinal studies of fall detection and prediction systems in real-life conditions on a diverse group that includes frequent fallers, aging adults, and persons with neurological disorders.” p.8 [76]. Not studying the sensor systems in real-life conditions affect the validity of the results since the performance is not studied in realistic conditions. The low number of studies with older people is also a shortcoming since age-related issues are not taken into consideration to a sufficient degree.
> 65 who were admitted to 366 US hospitals in the period 2003–2009, has found that women are less likely to receive optimal care at discharge. Yet, only two of the studies retrieved within the category Cardiovascular diseases provide information on the participants’ gender. This is not the only shortcoming for studies on Cardiovascular diseases however. Several studies, or sub-studies, were conducted with very large age spans without the provision of a mean age. Others were conducted with young people or lacks information on age. Further, several works report on studies with healthy participants. Hence, studies taking both genders into consideration, but also the age factor, are highly desired in the category Cardiovascular diseases. Not including information on gender and/or not considering gender/sex during data collection is a shortcoming regardless of the category to which a study belongs. It is argued in [80] that there are areas were specific data on women is lacking while specific data on men is missing in other areas. Regitz-Zagrosek [80] outlines a number of differences between men and women. These include: women more frequently having anemia, women suffering from coronary artery disease in average ten years later than men, a higher frequency of boys having asthma in young ages while the frequency changes to young adulthood, diabetes increasing the risk for coronary heart disease more among women, and osteoporosis being more frequent in women but under-diagnosed in men. Osteoporosis disease is characterized by a decreased bone mass density and a disrupted normal trabecular architecture reducing bone strength [81]. Therefore, Osteoporosis increases the risk of fractures after a fall but no symptoms of the disease are shown until a fracture occurs [80]. According to [81], there are several factors relating to Osteoporosis which increases the risk of falling. These include the fear of falling, which increases the risk of falling [82,83]. In addition, [81] reports on studies discussing women with osteoporosis or low bone mass where fear of falling is associated with more falls [84], and the confidence in balance is related to balance and mobility [85]. Further, [84] reports that an increased thoracic kyphosis is associated with recent falls among women with Osteopororosis. I.e., women with thoracic kyphosis were more likely to have had a recent fall. Thoracic kyphosis is an abnormal convex curvature of the spine at chest height which is much more common among older women than men due to estrogen losses [86]. All these works [81,82,83,84,85] date from 2004-2011, hence it is astonishing that some articles retrieved within the article category Gait and fall have not reported information on gender and that some other articles were conducted solely with men. Hence, we argue that future studies in the categories discussed in this article must take gender into consideration. This shortcoming was also highlighted in [2].There are many differences between the two genders. As a first example, we want to mention the American Heart Association’s (AHA) scientific statement from 2016 [[78]] on acute myocardial infarction (AMI) in women. “Sex differences occur in the pathophysiology and clinical presentation of MI and affect treatment delays.”, p. 932 [78]. Further, AHA reports that the same perfusion therapies are recommended despite the fact that the risk of bleeding or other complications is higher among women. Further, women are being under-treated with guideline recommendations. This results in increased readmission, re-infarction, and death rates during the first year after a myocardial infarction. Cardiac rehabilitation is also underused and under-prescribed among women [78]. On the same lines, the results of a cohort study [[79]] with almost 5000 patientsμagμage > 65 who were admitted to 366 US hospitals in the period 2003–2009, has found that women are less likely to receive optimal care at discharge. Yet, only two of the studies retrieved within the category Cardiovascular diseases provide information on the participants’ gender. This is not the only shortcoming for studies on Cardiovascular diseases however. Several studies, or sub-studies, were conducted with very large age spans without the provision of a mean age. Others were conducted with young people or lacks information on age. Further, several works report on studies with healthy participants.
Undoubtedly, healthy participants and patients differ in many aspects. Yet, only 65% of the studies overall reported this information. A positive example here is the fact that the studies reported upon in the category Asthma/COPD were conducted almost entirely with patients. This indicates that the results in this area are reliable. On the contrary, none of the studies within Gait and fall, or Stress and sleep have reported that the studies were conducted with patients. Also [76,77] have previously discussed the shortcoming of not conducting studies with patients in the category Gait and fall. Considering the research question for this review article, we question the fact that 35% of the retrieved articles lack information on whether the participants were healthy or patients. We argue that the use of healthy participants, or not providing this information, affect the validity of the study results. Future studies need to consider the inclusion of patients to a further extent.Hence, studies taking both genders into consideration, but also the age factor, are highly desired in the category Cardiovascular diseases. Not including information on gender and/or not considering gender/sex during data collection is a shortcoming regardless of the category to which a study belongs. It is argued in [[80]] that there are areas were specific data on women is lacking while specific data on men is missing in other areas.
Studying the sample size in the reported studies, 56% of the articles report on studies conducted with up to 20 participants, and only 20% of the articles report on studies conducted with 51 or more participants. The distribution of numbers vary between categories. The majority of the studies reported in the categories Asthma/COPD, Gait and fall, Physical activity recognition, Rehabilitation, and Stress and sleep were conducted with up to 20 participants. We find the overall low number of participants a shortcoming and recommend that future studies are conducted with larger study samples. However, taking demographic factors, i.e., age, gender and healthy/patient into consideration is highly needed prior to increasing the sample sizes in studies on health monitoring using wearable body sensors. FundingRegitz-Zagrosek [[80]] outlines a number of differences between men and women. These include: women more frequently having anemia, women suffering from coronary artery disease in average ten years later than men, a higher frequency of boys having asthma in young ages while the frequency changes to young adulthood, diabetes increasing the risk for coronary heart disease more among women, and osteoporosis being more frequent in women but under-diagnosed in men. Osteoporosis disease is characterized by a decreased bone mass density and a disrupted normal trabecular architecture reducing bone strength [81]. Therefore, Osteoporosis increases the risk of fractures after a fall but no symptoms of the disease are shown until a fracture occurs [[80]]. According to [81], there are several factors relating to Osteoporosis which increases the risk of falling. These include the fear of falling, which increases the risk of falling [[82][83]]. In addition, [[81]] reports on studies discussing women with osteoporosis or low bone mass where fear of falling is associated with more falls [84], and the confidence in balance is related to balance and mobility [85]. Further, [[84]] reports that an increased thoracic kyphosis is associated with recent falls among women with Osteopororosis. I.e., women with thoracic kyphosis were more likely to have had a recent fall. Thoracic kyphosis is an abnormal convex curvature of the spine at chest height which is much more common among older women than men due to estrogen losses [[86]]. All these works [[81][82][83][84][85]] date from 2004-2011, hence it is astonishing that some articles retrieved within the article category Gait and fall have not reported information on gender and that some other articles were conducted solely with men. Hence, we argue that future studies in the categories discussed in this article must take gender into consideration. This shortcoming was also highlighted in [1].
This research was conducted within the scope of the ESS-H+ (Embedded Sensor Systems for Health Plus). The project is funded by the Swedish Knowledge Foundation (project number: 20180158). CitingUndoubtedly, healthy participants and patients differ in many aspects. Yet, only 65% of the studies overall reported this information. A positive example here is the fact that the studies reported upon in the category Asthma/COPD were conducted almost entirely with patients. This indicates that the results in this area are reliable. On the contrary, none of the studies within Gait and fall, or Stress and sleep have reported that the studies were conducted with patients. Also [76][77]] have previously discussed the shortcoming of not conducting studies with patients in the category Gait and fall. Considering the research question for this review article, we question the fact that 35% of the retrieved articles lack information on whether the participants were healthy or patients. We argue that the use of healthy participants, or not providing this information, affect the validity of the study results. Future studies need to consider the inclusion of patients to a further extent.
Please refer to the original publication in Sensors if citing this work: Annica Kristoffersson & Maria Lindén. A Systematic Review on the Use of Wearable Body Sensors for Health Monitoring: A Qualitative synthesis. Sensors 2020, 20(5), 1502; https://doi.org/10.3390/s20051502Studying the sample size in the reported studies, 56% of the articles report on studies conducted with up to 20 participants, and only 20% of the articles report on studies conducted with 51 or more participants. The distribution of numbers vary between categories. The majority of the studies reported in the categories Asthma/COPD, Gait and fall, Physical activity recognition, Rehabilitation, and Stress and sleep were conducted with up to 20 participants. We find the overall low number of participants a shortcoming and recommend that future studies are conducted with larger study samples. However, taking demographic factors, i.e., age, gender and healthy/patient into consideration is highly needed prior to increasing the sample sizes in studies on health monitoring using wearable body sensors.