Natural products (NPs) have historically played a primary role in the discovery of small-molecule drugs. However, due to the advent of other methodologies and the drawbacks of NPs, the pharmaceutical industry has largely declined in interest regarding the screening of new drugs from NPs since 2000. There are many technical bottlenecks to quickly obtaining new bioactive NPs on a large scale, which has made NP-based drug discovery very time-consuming, and the first thorny problem faced by researchers is how to dereplicate NPs from crude extracts. Remarkably, with the rapid development of omics, analytical instrumentation, and artificial intelligence technology, in 2012, an efficient approach, known as tandem mass spectrometry (MS/MS)-based molecular networking (MN) analysis, was developed to avoid the rediscovery of known compounds from the complex natural mixtures.
- MS/MS-based molecular networking
- natural products dereplication
- classical MN (CLMN)
- feature-based molecular networking (FBMN)
- ion identity molecular networking (IIMN)
- building blocks-based molecular network (BBMN)
- substructure-based MN (MS2LDA)
- bioactivit
1. Introduction
2. Classical Molecular Networking (CLMN)
The theoretical rationale of CLMN is that molecules with similar structures will exhibit considerable similarities in their MS/MS spectra, and vice versa. Thus, similar molecules in complex mixtures can be clustered to form “molecular families” by the mass spectral similarities of molecules. The spectral similarities can be calculated with a vector-based modified “cosine score” (ranging from 0 to 1; the higher the score is, the more similar the result will be), which takes into account the number of matching fragment ions, the relative intensities of the peaks, and the parent mass accuracy [53][40]. As shown in Figure 1, the obtained tandem MS spectra (Figure 1a) are first processed to give a consensus spectrum (Figure 1c) by merging identical spectra (Figure 1b), using the MS-Cluster algorithm to avoid identical spectra appearing more than once [25,53][25][40]. Then, a modified algorithm is used to calculate the spectral similarity score (Figure 1d). Peaks from one consensus spectrum are compared with peaks from the other, either at identical m/z values or with their Δm/z, considering that a Δm/z change to the precursor ion may lead to shifting a subset of fragment peaks by Δm/z [36,53][36][40]. Finally, a molecular network is constructed on the basis of the calculated spectral similarity score (Figure 1e). In the network, the “molecular families” and the “molecular only similar with itself” variables are represented by “cluster” and “self-loop node”, respectively. In the cluster, similar molecules (“node”) are connected by lines (”edge”), and the thickness of the edges showcases the level of their similarity [53][40].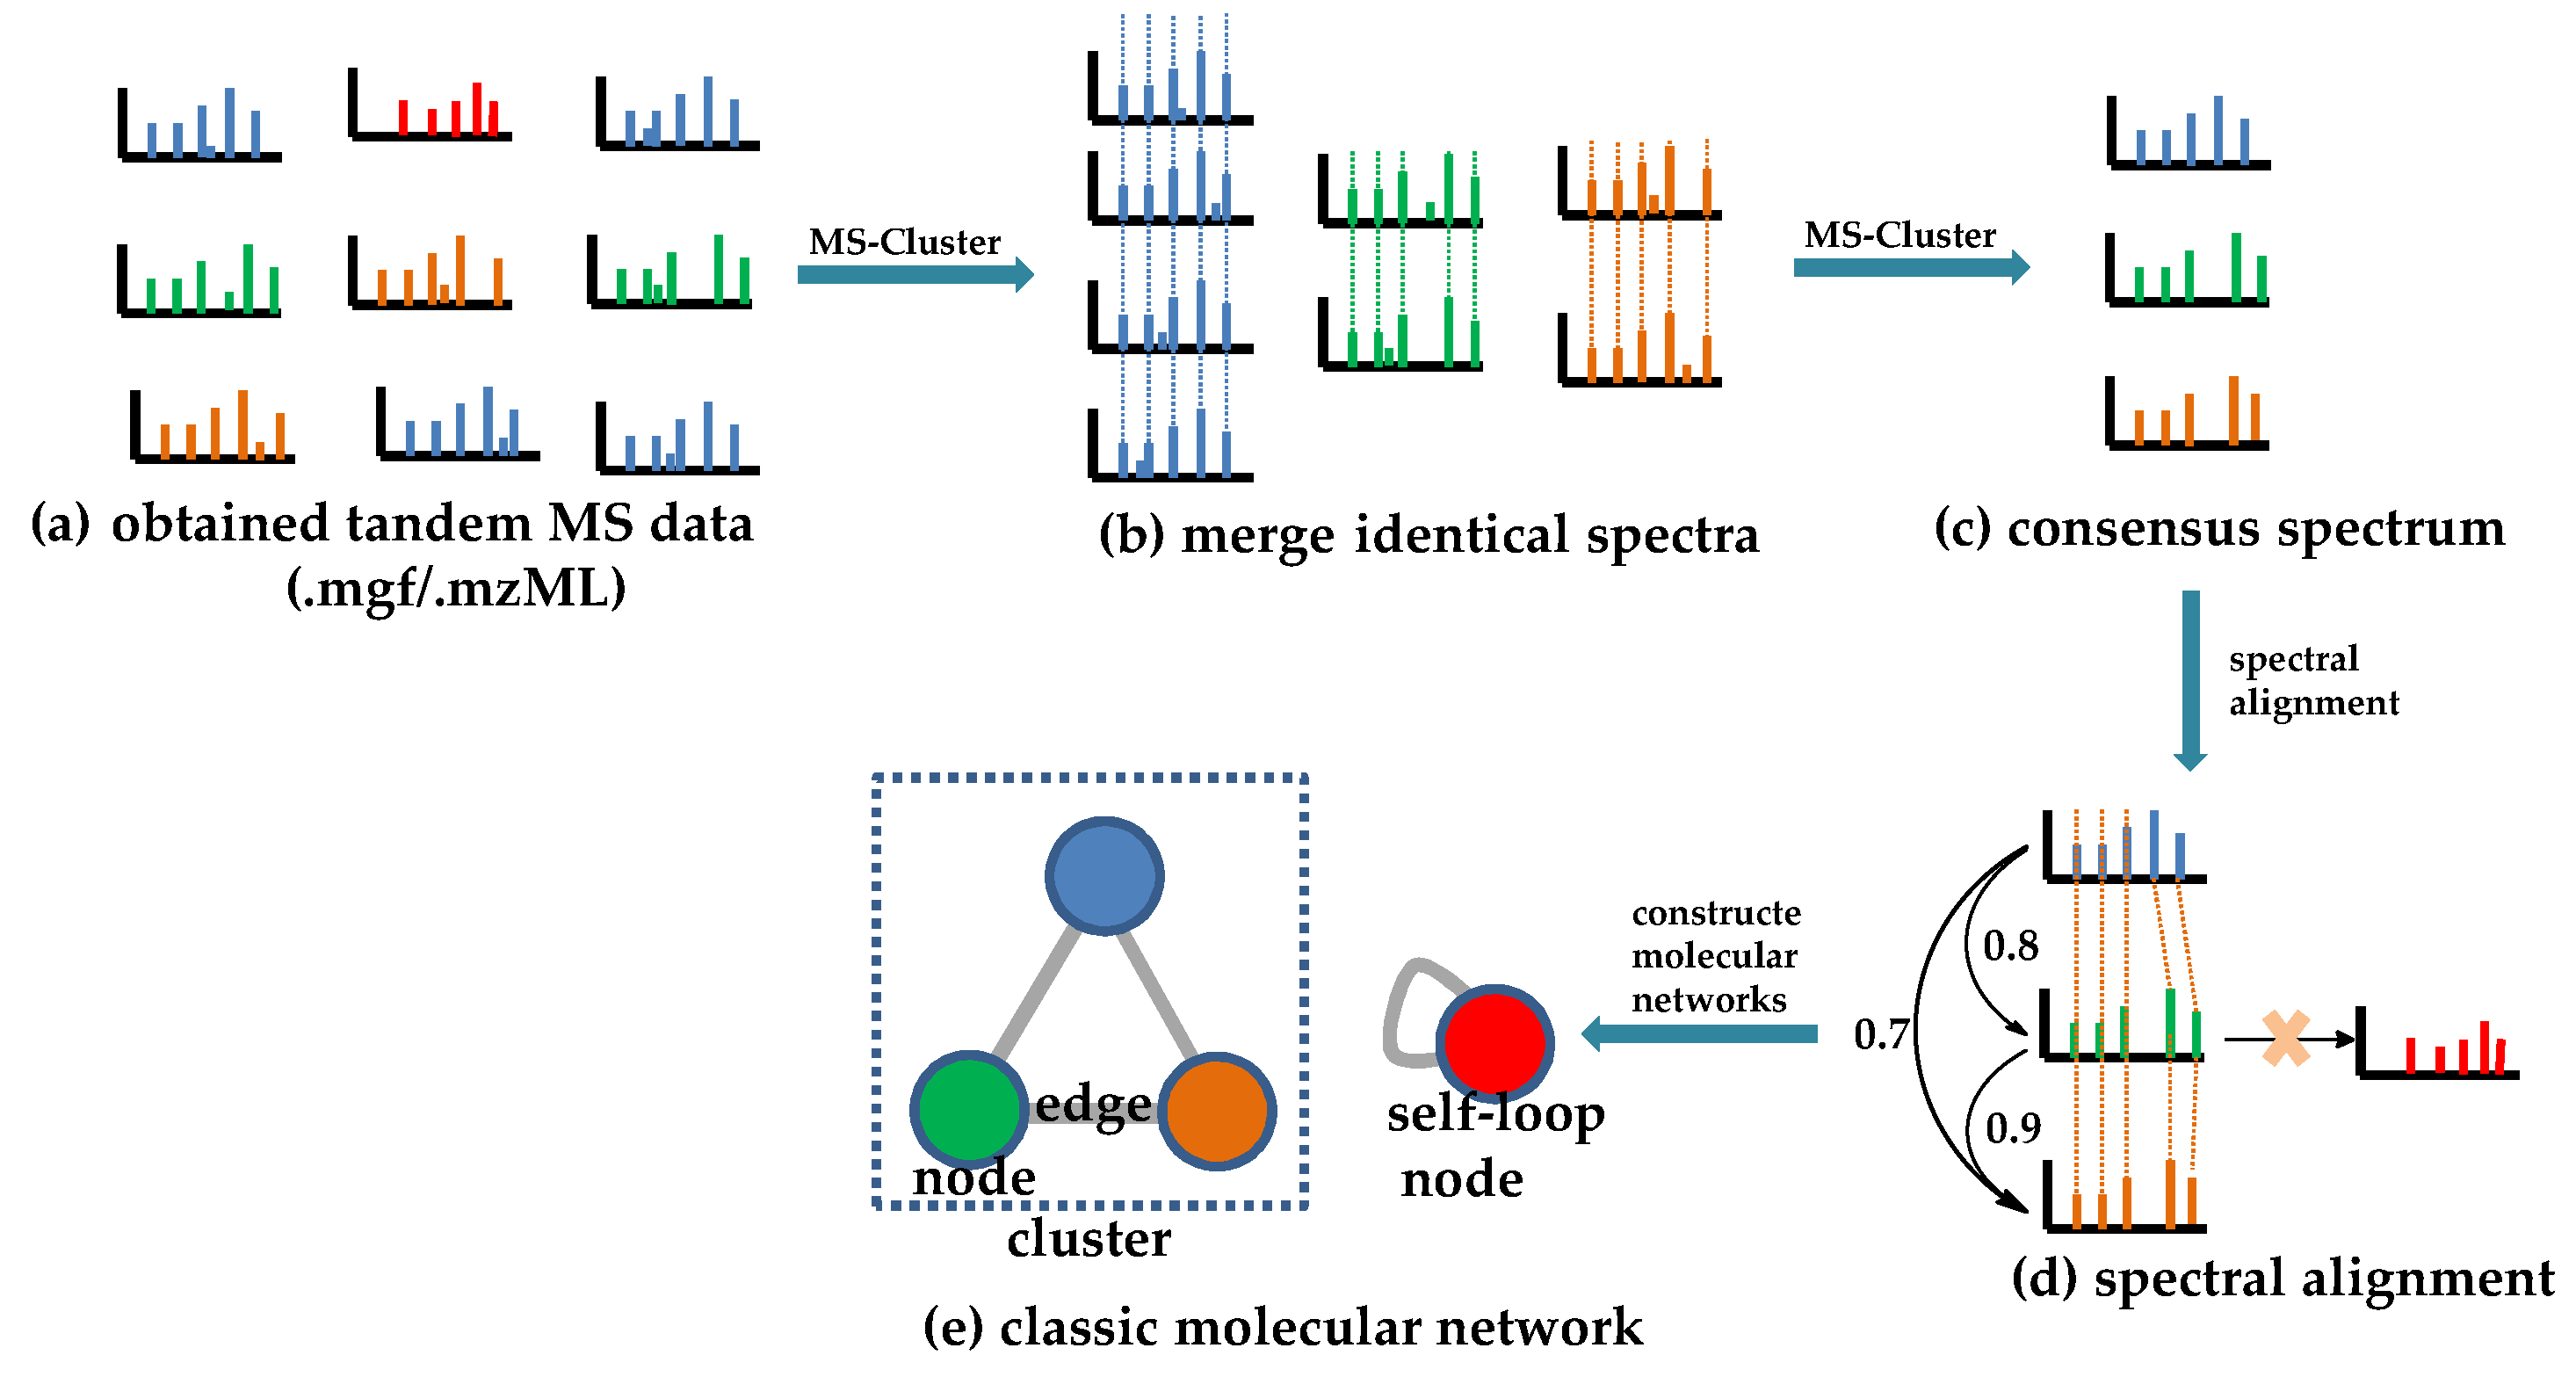
3. Feature-Based Molecular Networking (FBMN)
Although CLMN is very convenient for the rapid processing of large-scale MS/MS datasets, it cannot differentiate positional isomers or stereoisomers, or provide accurate relative quantitative information, due to the limitations of the MS-Cluster algorithm. To address this issue, Dorrestein’s group developed FBMN by integrating comparative metabolomics with MN in 2017 [42][50]. In this method, not only the fragmentation data but also the isotope patterns, the retention times, and the ion mobility spectrometry can be compared. Compared with CLMN, there are two main different steps in the workflow of FBMN (Figure 4). First, the obtained tandem MS spectra (Figure 4a) should be pre-processed using MZmine [62][51], OpenMS [63][52], or other feature detection and alignment tools [42][50] to detect, group, and align those features (Figure 4b). Second, the exported feature lists ((.cvs, feature quantification table) and (.mgf, MS2 spectral summary file)) are uploaded to perform the dedicated feature networking workflow on the GNPS platform, to generate a feature-based network (Figure 4c) [42][50].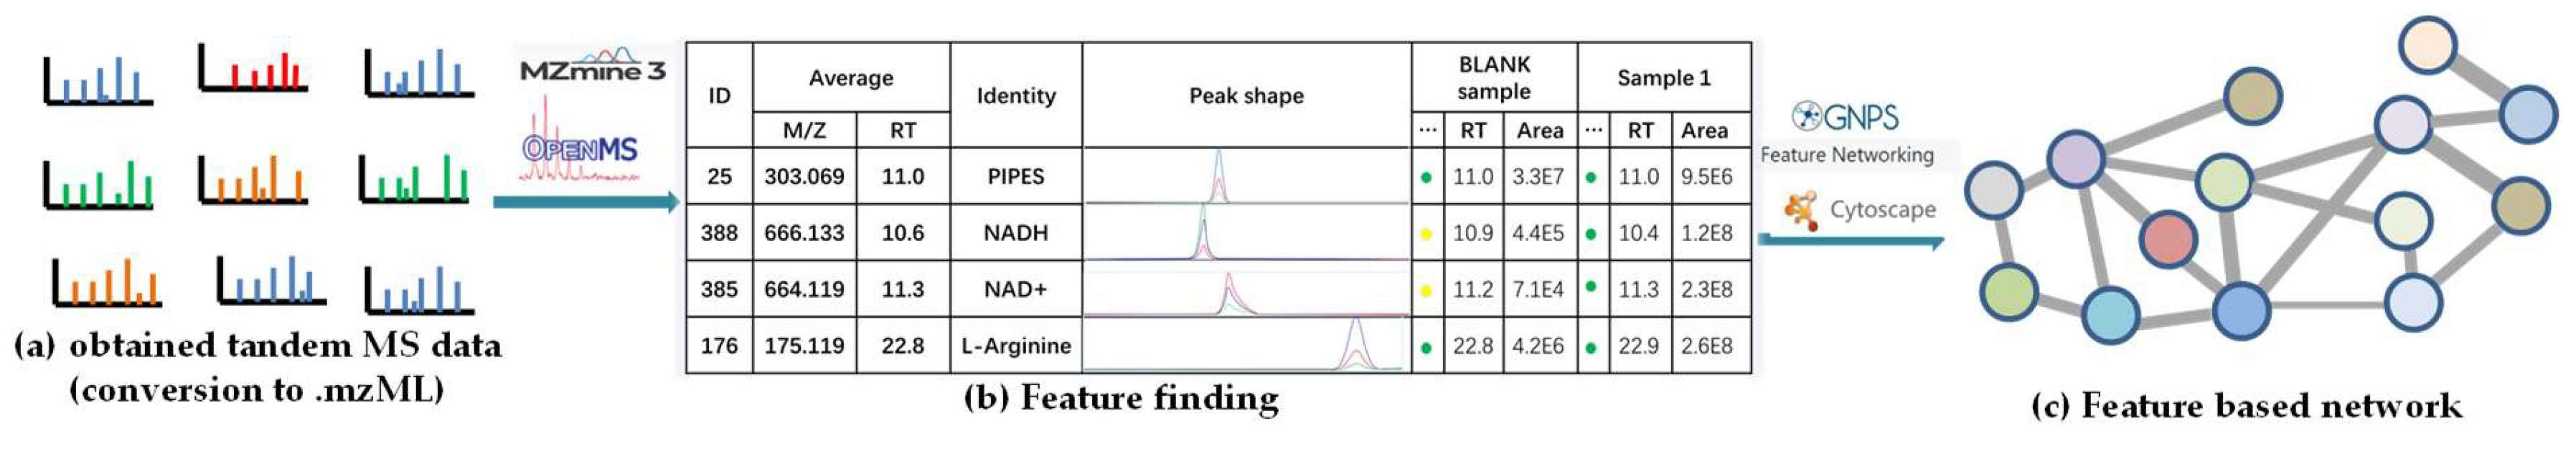
References
- Clardy, J.; Walsh, C. Lessons from natural molecules. Nature 2004, 432, 829–837.
- Ma, P.; Xu, H.; Li, J.; Lu, F.; Ma, F.; Wang, S.; Xiong, H.; Wang, W.; Buratto, D.; Zonta, F.; et al. Functionality-independent DNA encoding of complex natural products. Angew. Chem. 2019, 131, 9335–9362.
- Koch, M.A.; Schuffenhauer, A.; Scheck, M.; Wetzel, S.; Casaulta, M.; Odermatt, A.; Ertl, P.; Waldmann, H. Charting biologically relevant chemical space: A structural classification of natural products (SCONP). Proc. Natl. Acad. Sci. USA 2005, 102, 17272–17277.
- Newman, D.J.; Cragg, G.M. Natural products as sources of new drugs over the nearly four decades from 01/1981 to 09/2019. J. Nat. Prod. 2020, 83, 770–803.
- Najmi, A.; Javed, S.A.; Al Bratty, M.; Alhazmi, H.A. Modern approaches in the discovery and development of plant-based natural products and their analogues as potential therapeutic agents. Molecules 2022, 27, 349.
- Top 200 Pharmaceuticals by Retails in 2021. Available online: https://njardarson.lab.arizona.edu/content/top-pharmaceuticals-poster (accessed on 12 August 2022).
- David, B.; Wolfender, J.L.; Dias, D.A. The pharmaceutical industry and natural products: Historical status and new trends. Phytochem. Rev. 2014, 14, 299–315.
- Sheridan, C. Recasting natural product research. Nat. Biotechnol. 2012, 30, 385–387.
- McChesney, J.D.; Venkataraman, S.K.; Henri, J.T. Plant natural products: Back to the future or into extinction? Phytochemistry 2007, 68, 2015–2022.
- Walsh, G. Biopharmaceutical benchmarks 2018. Nat. Biotechnol. 2018, 36, 1136–1145.
- Cohen, P.; Cross, D.; Jӓnne, P.A. Kinase drug discovery 20 years after imatinib: Progress and future directions. Nat. Rev. Drug Discov. 2021, 20, 551–569.
- Drago, J.Z.; Modi, S.; Chandarlapaty, S. Unlocking the potential of antibody-drug conjugates for cancer therapy. Nat. Rev. Clin. Oncol. 2021, 18, 327–344.
- Békés, M.; Langley, D.R.; Crews, C.M. PROTAC targeted protein degraders: The past is prologue. Nat. Rev. Drug Discov. 2022, 21, 181–200.
- Sabe, V.T.; Ntombela, T.; Jhamba, L.A.; Maguire, G.E.M.; Govender, T.; Naicker, T.; Kruger, H.G. Current trends in computer aided drug design and a highlight of drugs discovered via computational techniques: A review. Eur. J. Med. Chem. 2021, 224, 113705.
- Cooper, B.M.; Iegre, J.; O’Donovan, D.H.; Halvarsson, M.Ö.; Spring, D.R. Peptides as a platform for targeted therapeutics for cancer: Peptide-drug conjugates (PDCs). Chem. Soc. Rev. 2021, 50, 1480–1494.
- Kurita, K.L.; Linington, R.G. Connecting phenotype and chemotype: High-content discovery strategies for natural products research. J. Nat. Prod. 2015, 78, 587–596.
- Sorokina, M.; Steinbeck, C. Review on natural products databases: Where to find data in 2020. J. Cheminform. 2020, 12, 20.
- Pye, C.R.; Bertin, M.J.; Lokey, R.S.; Gerwick, W.H.; Linington, R.G. Retrospective analysis of natural products provides insights for future discovery trends. Proc. Natl. Acad. Sci. USA 2017, 114, 5601–5606.
- Covington, B.C.; McLean, J.A.; Bachmann, B.O. Comparative mass spectrometry-based metabolomics strategies for the investigation of microbial secondary metabolites. Nat. Prod. Rep. 2017, 34, 6–24.
- Gaudencio, S.P.; Pereira, F. Dereplication: Racing to speed up the natural products discovery process. Nat. Prod. Rep. 2015, 32, 779–810.
- El-Elimat, T.; Figueroa, M.; Ehrmann, B.M.; Cech, N.B.; Pearce, C.J.; Oberlies, N.H. High-resolution MS, MS/MS, and UV database of fungal secondary metabolites as a dereplication protocol for bioactive natural products. J. Nat. Prod. 2013, 76, 1709–1716.
- Wohlleben, W.; Mast, Y.; Stegmann, E.; Ziemert, N. Antibiotic drug discovery. Microb. Biotechnol. 2016, 9, 541–548.
- López-Pérez, J.L.; Therón, R.; del Olmo, E.; Díaz, D. NAPROC-13: A database for the dereplication of natural product mixtures in bioassay-guided protocols. Bioinformatics 2007, 23, 3256–3257.
- Crüsemann, M.; O’Neill, E.C.; Larson, C.B.; Melnik, A.V.; Floros, D.J.; da Silva, R.R.; Jensen, P.R.; Dorrestein, P.C.; Moore, B.S. Prioritizing natural product diversity in a collection of 146 bacterial strains based on growth and extraction protocols. J. Nat. Prod. 2017, 80, 588–597.
- Agarwal, G.; Carcache, P.J.B.; Addo, E.M.; Kinghorn, A.D. Current status and contemporary approaches to the discovery of antitumor agents from higher plants. Biotechnol. Adv. 2020, 38, 107337.
- Alfaro, J.A.; Bohlӓnder, P.; Dai, M.; Filius, M.; Howard, C.J.; van Kooten, X.F.; Ohayon, S.; Pomorski, A.; Schmid, S.; Aksimentiev, A.; et al. The emerging landscape of single-molecule protein sequencing technologies. Nat. Methods 2021, 18, 604–617.
- Zhang, F.; Ge, W.; Ruan, G.; Cai, X.; Guo, T. Data-independent acquisition mass spectrometry-based proteomics and software tools: A glimpse in 2020. Proteomics 2020, 20, e1900276.
- Timp, W.; Timp, G. Beyond mass spectrometry, the next step in proteomics. Sci. Adv. 2020, 6, eaax8978.
- Hajirasouliha, I.; Tilgner, H.U. The tech for the next decade: Promises and challenges in genome biology. Genome Biol. 2019, 20, 86.
- Miggiels, P.; Wouters, B.; van Westen, G.J.P.; Dubbelman, A.-C.; Hankemeier, T. Novel technologies for metabolomics: More for less. TrAC Trends Anal. Chem. 2019, 120, 115323.
- Aldridge, S.; Teichmann, S.A. Single cell transcriptomics comes of age. Nat. Commun. 2020, 11, 4307.
- Asp, M.; Bergenstråhle, J.; Lundeberg, J. Spatially resolved transcriptomes-next generation tools for tissue exploration. Bioessays 2020, 42, 1900221.
- Caesar, L.K.; Montaser, R.; Keller, N.P.; Kelleher, N.L. Metabolomics and genomics in natural products research: Complementary tools for targeting new chemical entities. Nat. Prod. Rep. 2021, 38, 2041–2065.
- Sukmarini, L. Recent advances in discovery of lead structures from microbial natural products: Genomics- and metabolomics-guided acceleration. Molecules 2021, 26, 2542.
- Wolfender, J.-L.; Litaudon, M.; Touboul, D.; Queiroz, E.F. Innovative omics-based approaches for prioritisation and targeted isolation of natural products—New strategies for drug discovery. Nat. Prod. Rep. 2019, 36, 855–868.
- Beniddir, M.A.; Kang, K.B.; Genta-Jouve, G.; Huber, F.; Rogers, S.; van der Hooft, J.J.J. Advances in decomposing complex metabolite mixtures using substructure- and network-based computational metabolomics approaches. Nat. Prod. Rep. 2021, 38, 1967–1993.
- Jarmusch, S.A.; van der Hooft, J.J.J.; Dorrestein, P.C.; Jarmusch, A.K. Advancements in capturing and mining mass spectrometry data are transforming natural products research. Nat. Prod. Rep. 2021, 38, 2066–2082.
- Ramos, A.E.F.; Evanno, L.; Poupon, E.; Champy, P.; Beniddir, M.A. Natural products targeting strategies involving molecular networking: Different manners, one goal. Nat. Prod. Rep. 2019, 36, 960–980.
- Bingol, K.; Brüschweiler, R. Knowns and unknowns in metabolomics identified by multidimensional NMR and hybrid MS/NMR methods. Curr. Opin. Biotechnol. 2017, 43, 17–24.
- Aron, A.T.; Gentry, E.C.; McPhail, K.L.; Nothias, L.-F.; Nothias-Esposito, M.; Bouslimani, A.; Petras, D.; Gauglitz, J.M.; Sikora, N.; Vargas, F.; et al. Reproducible molecular networking of untargeted mass spectrometry data using GNPS. Nat. Protoc. 2020, 15, 1954–1991.
- Wang, M.; Carver, J.J.; Phelan, V.V.; Sanchez, L.M.; Garg, N.; Peng, Y.; Nguyen, D.D.; Watrous, J.; Kapono, C.A.; Luzzatto-Knaan, T.; et al. Sharing and community curation of mass spectrometry data with Global Natural Products Social Molecular Networking. Nat. Biotechnol. 2016, 34, 828–837.
- Shannon, P.; Markiel, A.; Ozier, O.; Baliga, N.S.; Wang, J.T.; Ramage, D.; Amin, N.; Schwikowski, B.; Ideker, T. Cytoscape: A software environment for integrated models of biomolecular interaction networks. Genome Res. 2003, 13, 2498–2504.
- Olivon, F.; Elie, N.; Grelier, G.; Roussi, F.; Litaudon, M.; Touboul, D. MetGem software for the generation of molecular networks based on the t-SNE algorithm. Anal. Chem. 2018, 90, 13900–13908.
- Van der Maaten, L.; Hinton, G. Visualizing data using t-SNE. J. Mach. Learn. Res. 2008, 9, 2579–2605.
- Huber, F.; Ridder, L.; Verhoeven, S.; Spaaks, J.H.; Diblen, F.; Rogers, S.; van der Hooft, J.J.J. Spec2Vec: Improved mass spectral similarity scoring through learning of structural relationships. PLoS Comput. Biol. 2021, 17, e1008724.
- Huber, F.; van der Burg, S.; van der Hooft, J.J.J.; Ridder, L. MS2DeepScore: A novel deep learning similarity measure to compare tandem mass spectra. J. Cheminform. 2021, 13, 84.
- Lee, S.R.; Schalk, F.; Schwitalla, J.W.; Guo, H.; Yu, J.S.; Song, M.; Jung, W.H.; de Beer, Z.W.; Beemelmanns, C.; Kim, K.H. GNPS-guided discovery of madurastatin siderophores from the termite-associated Actinomadura sp. RB99. Chem. Eur. J. 2022, 28, e202200612.
- Wu, C.; van der Heul, H.U.; Melnik, A.V.; Lüebben, J.; Dorrestein, P.C.; Minnaard, A.J.; Choi, Y.H.; van Wezel, G.P. Lugdunomycin, an angucycline-derived molecule with unprecedented chemical architecture. Angew. Chem. Int. Ed. 2019, 58, 2809–2814.
- Bonneau, N.; Chen, G.; Lachkar, D.; Boufridi, A.; Gallard, J.-F.; Retailleau, P.; Petek, S.; Debitus, C.; Evanno, L.; Beniddir, M.A.; et al. An unprecedented blue chromophore found in Nature using a "chemistry first" and molecular networking approach: Discovery of dactylocyanines A-H. Chem. Eur. J. 2017, 23, 14454–14461.
- Nothias, L.-F.; Petras, D.; Schmid, R.; Dührkop, K.; Rainer, J.; Sarvepalli, A.; Protsyuk, I.; Ernst, M.; Tsugawa, H.; Fleischauer, M.; et al. Feature-based molecular networking in the GNPS analysis environment. Nat. Methods 2020, 17, 905–908.
- Pluskal, T.; Castillo, S.; Villar-Briones, A.; Orešič, M. MZmine 2: Modular framework for processing, visualizing, and analyzing mass spectrometry-based molecular profile data. BMC Bioinformatics 2010, 11, 395.
- Röst, H.L.; Sachsenberg, T.; Aiche, S.; Bielow, C.; Weisser, H.; Aicheler, F.; Andreotti, S.; Ehrlich, H.C.; Gutenbrunner, P.; Kenar, E.; et al. OpenMS: A flexible open-source software platform for mass spectrometry data analysis. Nat. Methods 2016, 13, 741–748.
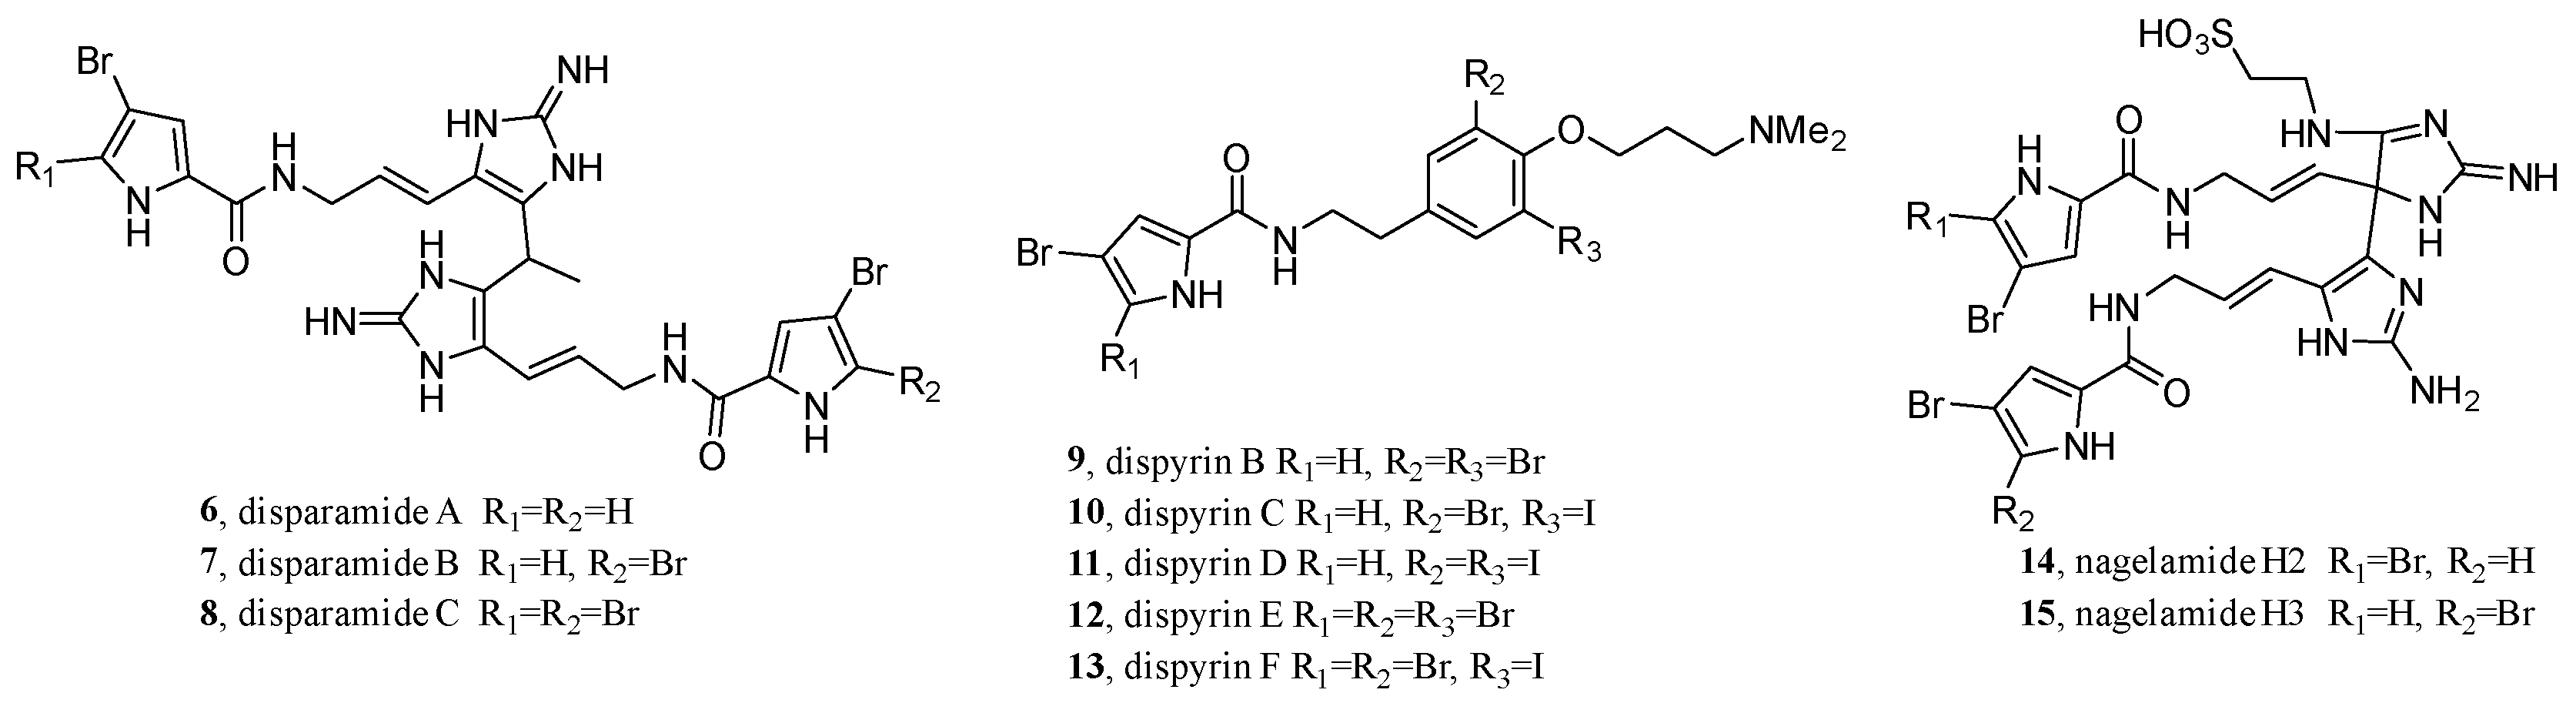
- Freire, V.F.; Gubiani, J.R.; Spencer, T.M.; Hajdu, E.; Ferreira, A.G.; Ferreira, D.A.S.; de Castro Levatti, E.V.; Burdette, J.E.; Camargo, C.H.; Tempone, A.G.; et al. Feature-based molecular networking discovery of bromopyrrole alkaloids from the marine sponge Agelas dispar. J. Nat. Prod. 2022, 85, 1340–1350.