2. Cd Pollution in Rice and Wheat Cropping System
2.1. Cd Concentrations in Rice and Wheat Grain
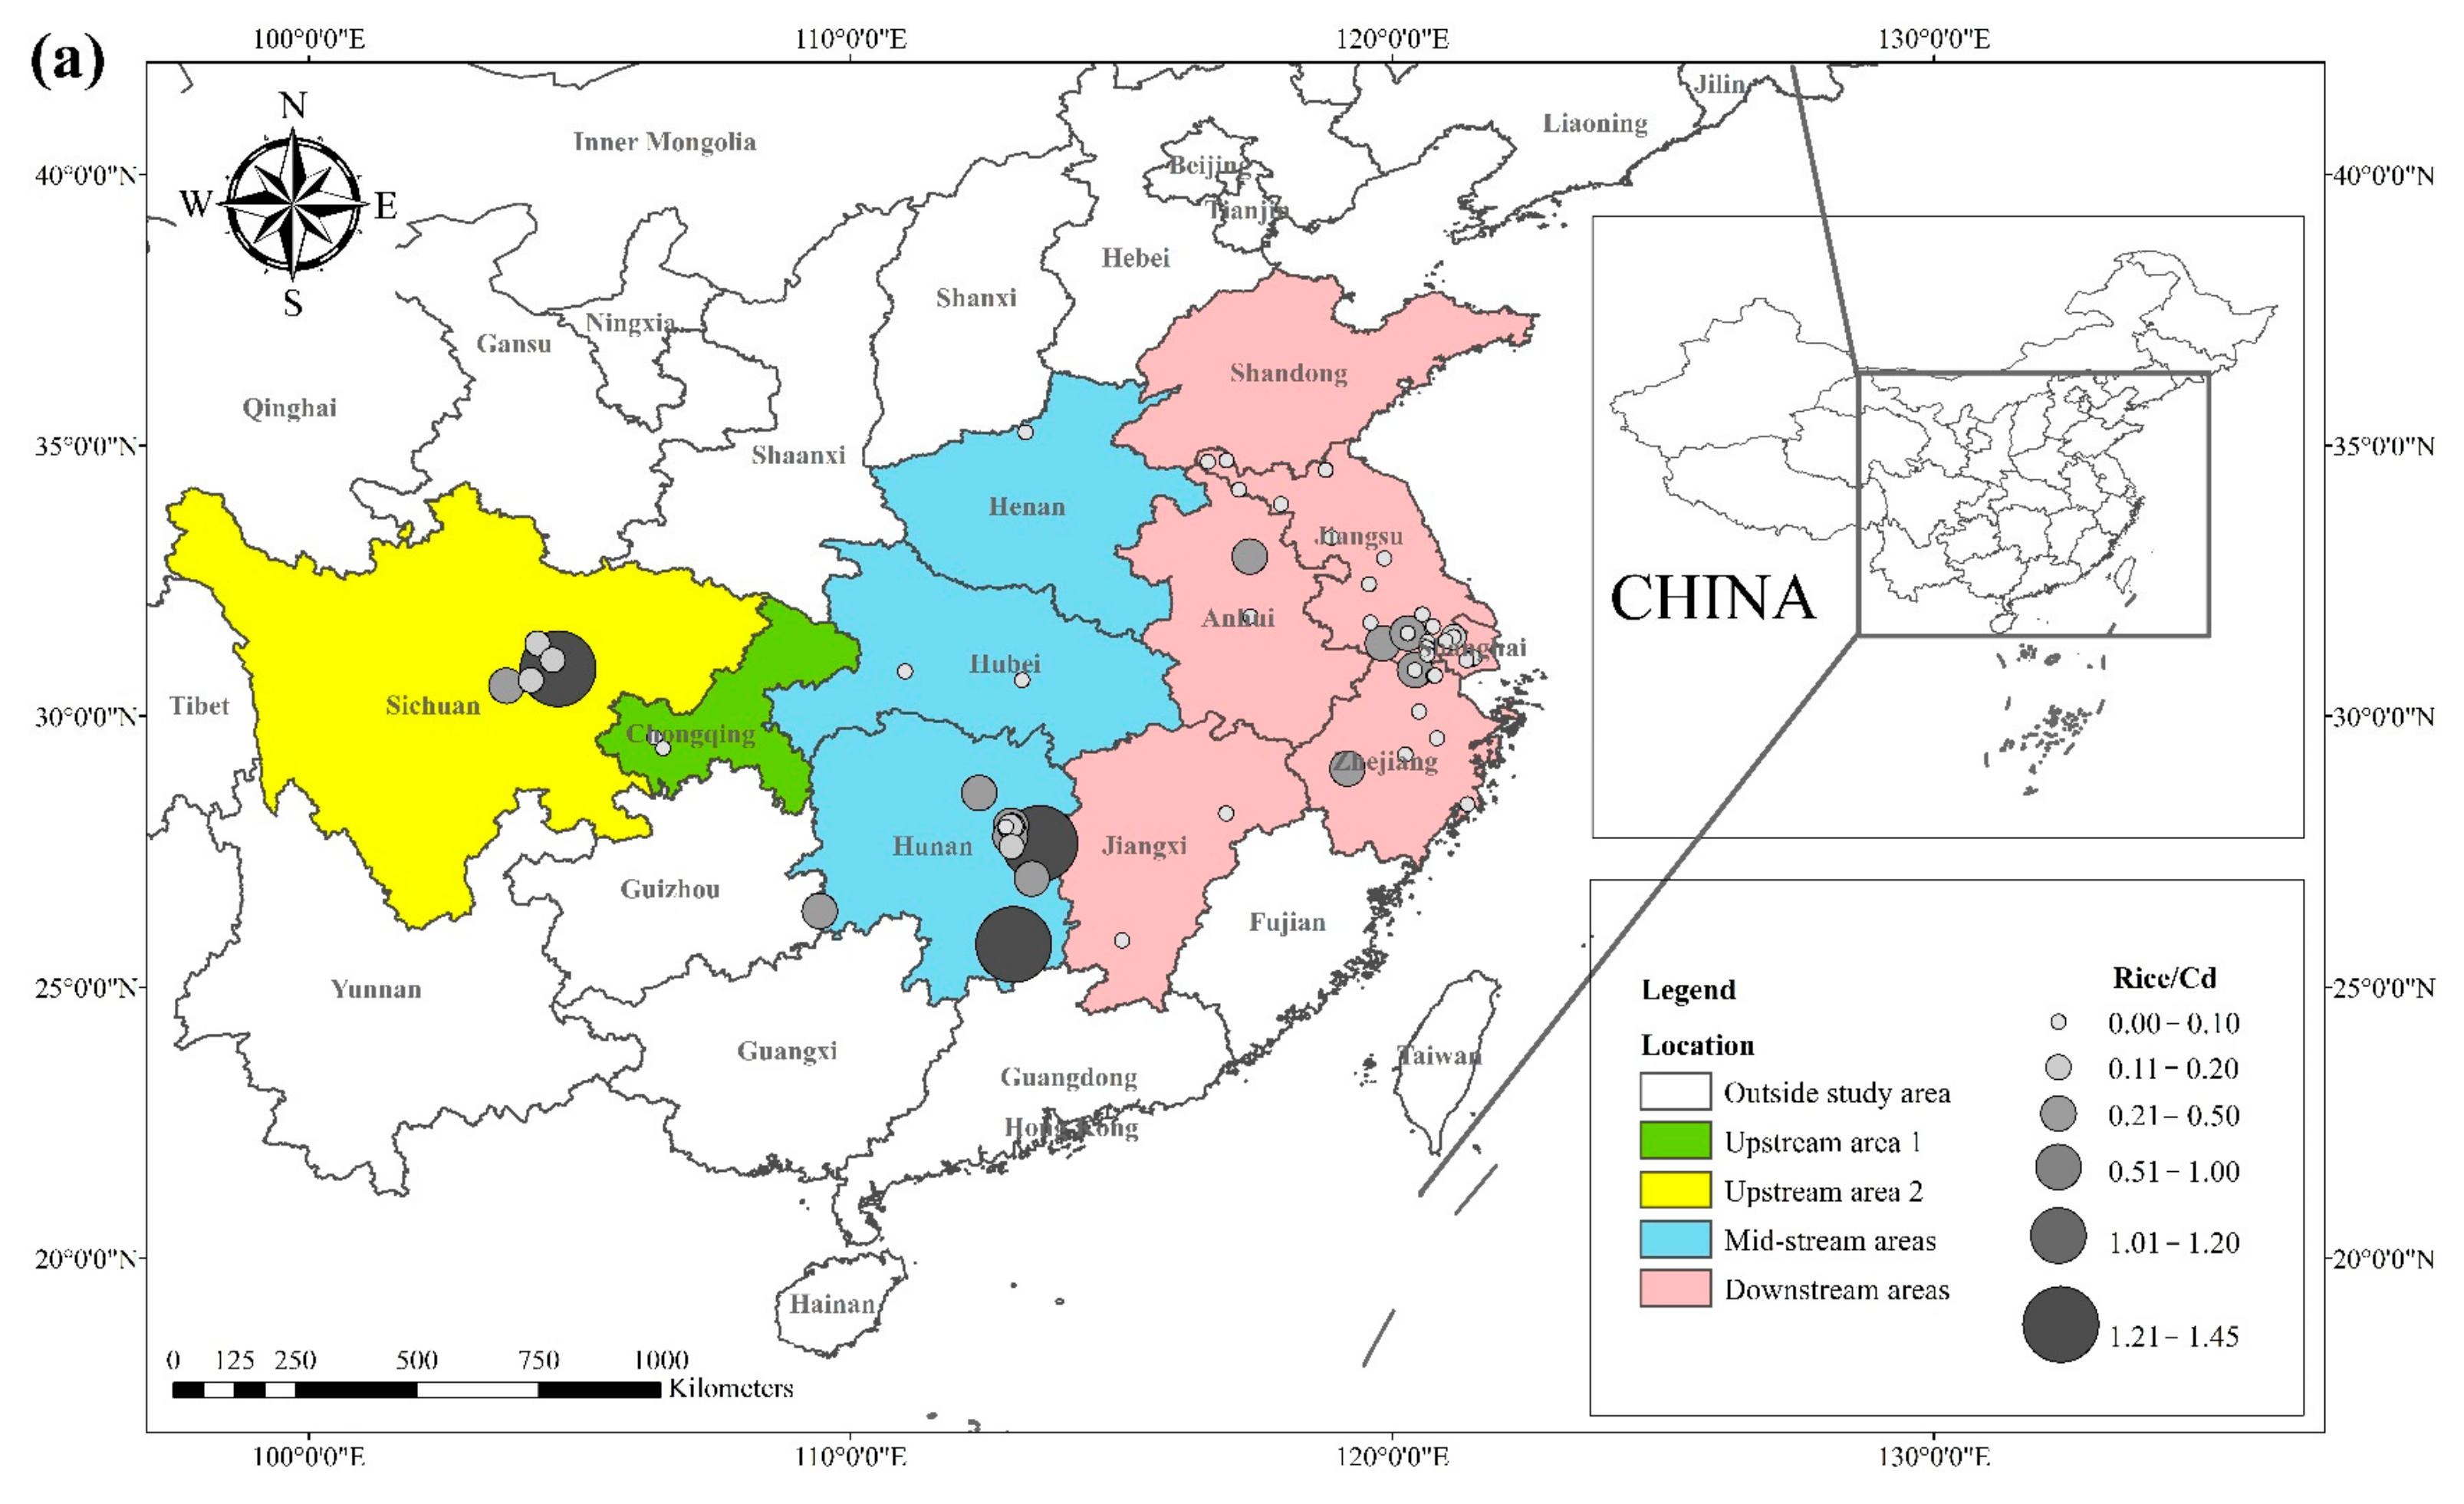
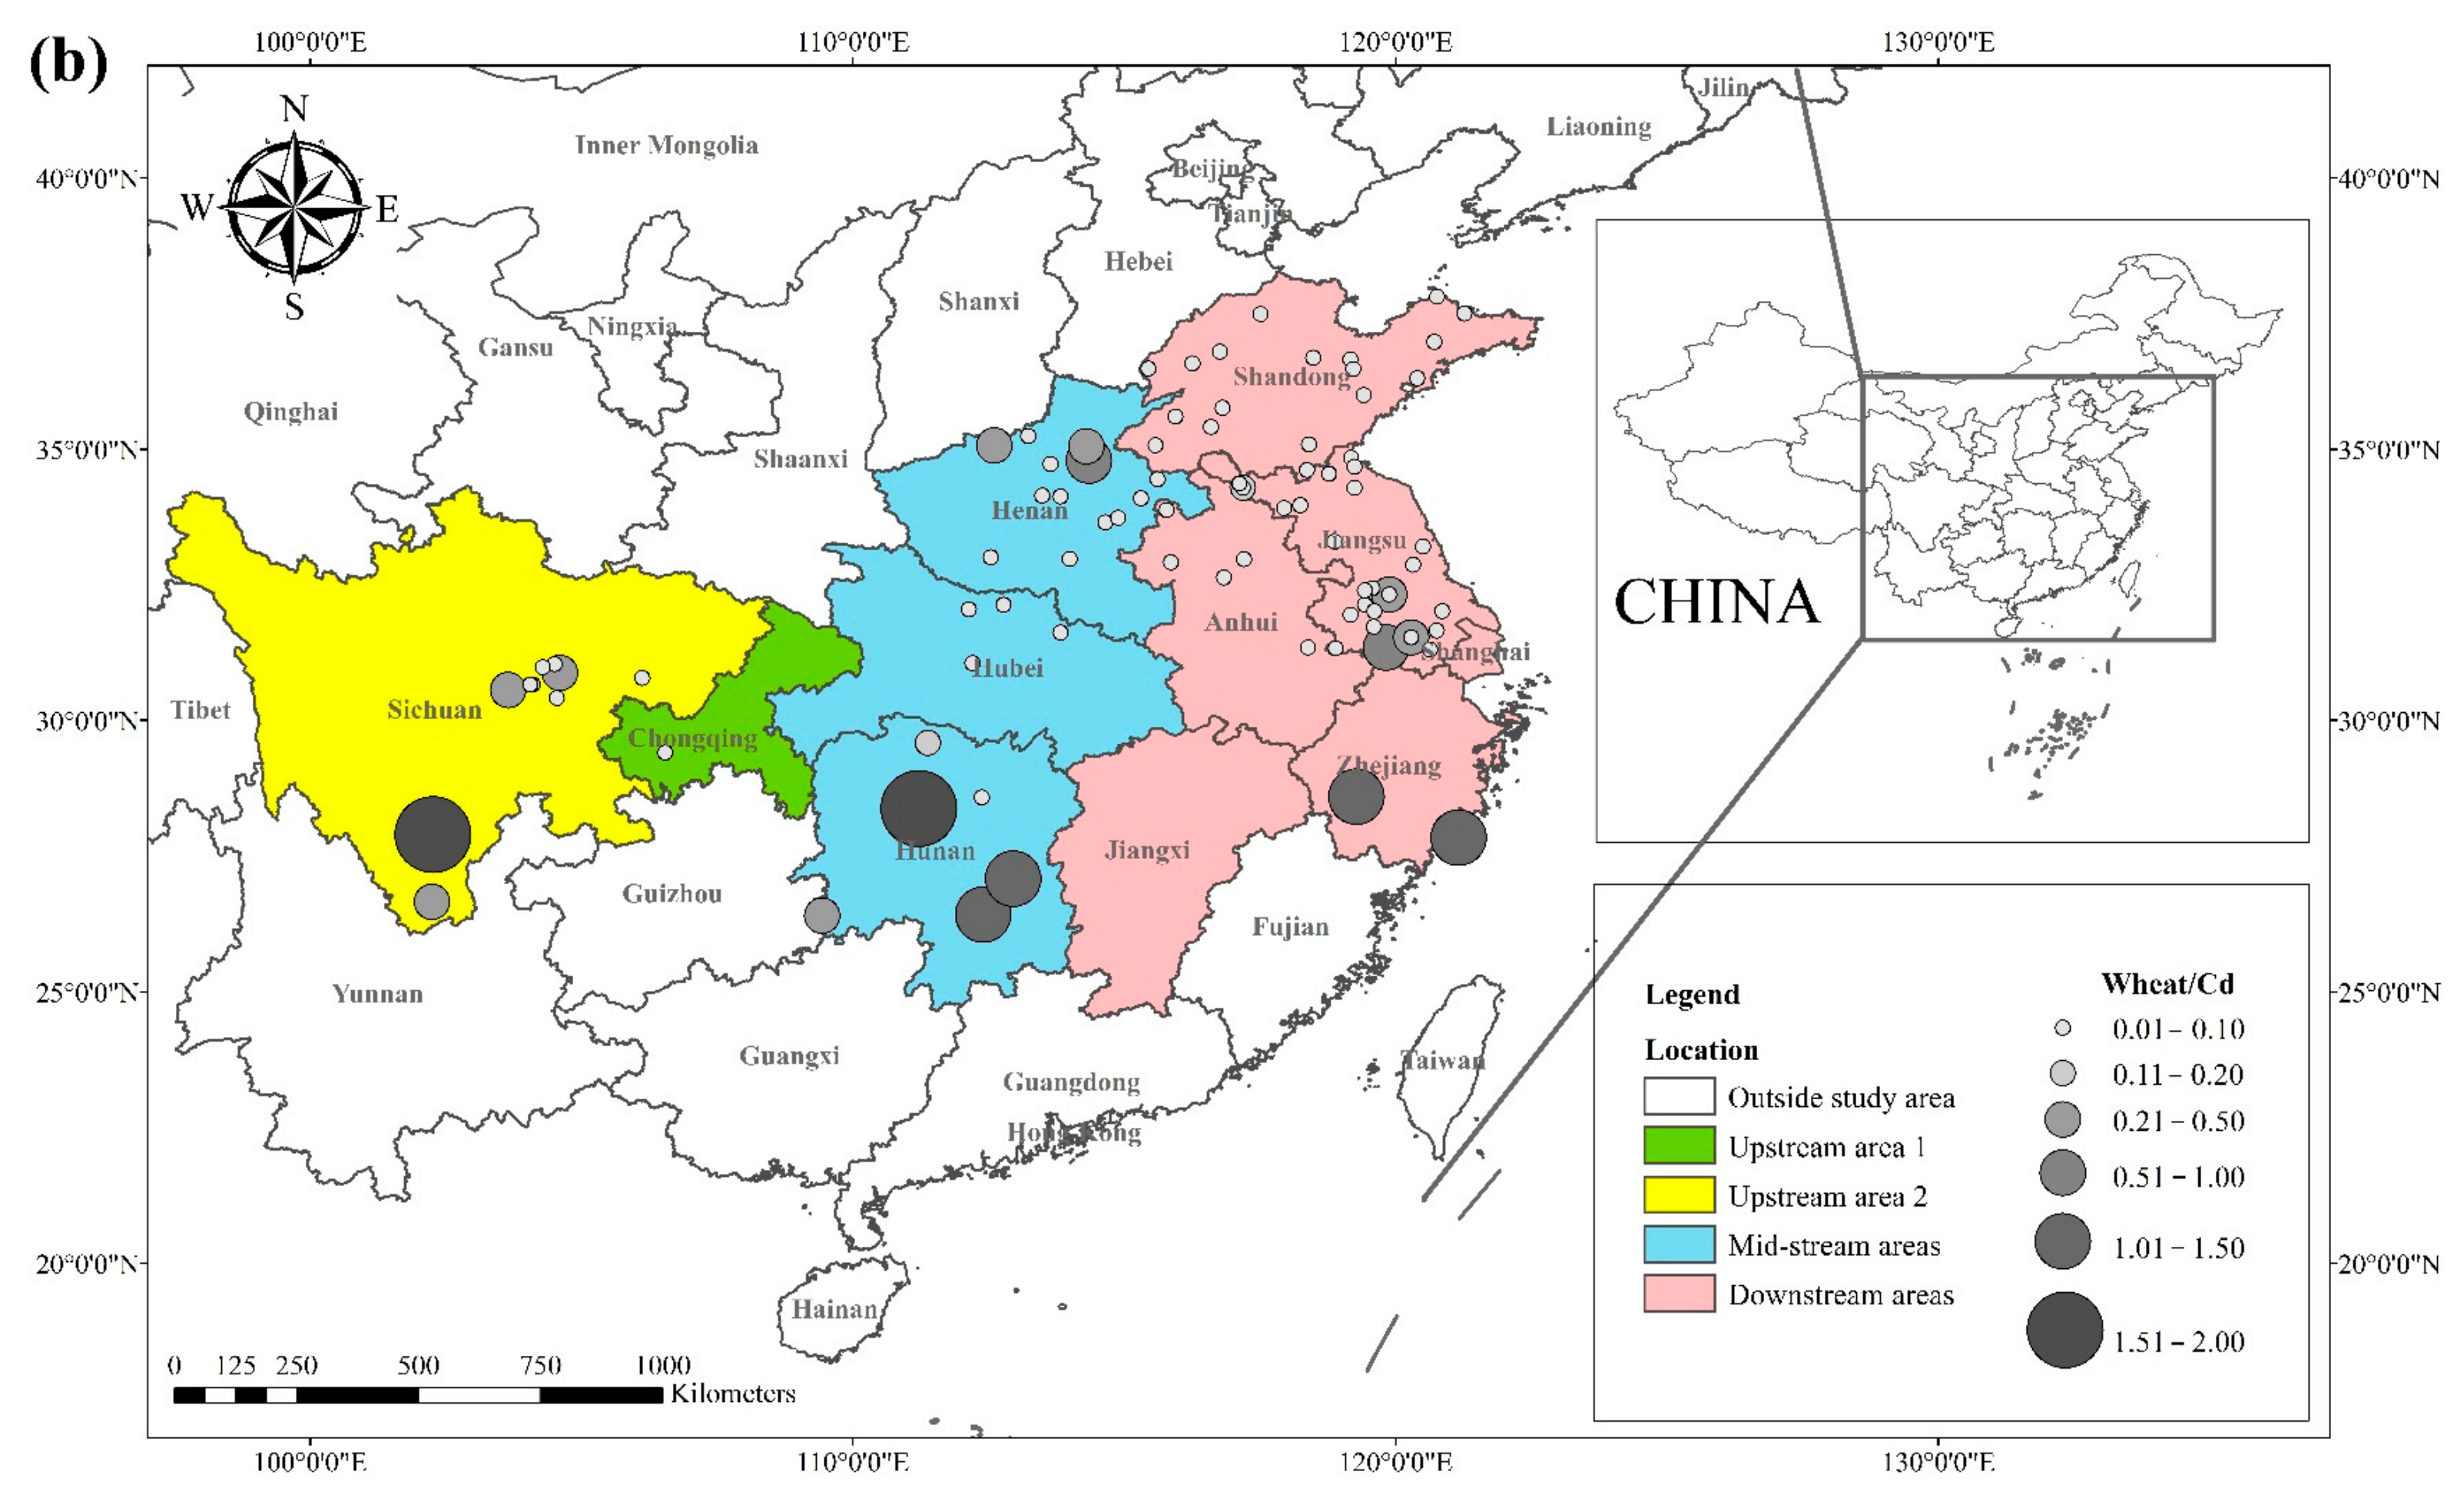
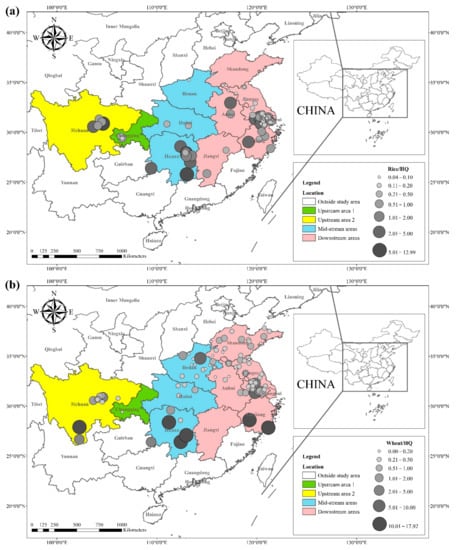
The literature survey results showed that the regions where both rice and wheat were grown were mainly in nine provinces and two municipalities around the Yangtze River Basin and southeast of the Yellow River Basin, including Sichuan, Chongqing, Hubei, Hunan, Jiangxi, Anhui, Zhejiang, Jiangsu, Shanghai, Shandong, and Henan provinces.
Table 1 shows the results of other studies on the Cd pollution of rice and wheat cropping systems in China. The retrieved data showed that the average concentration of Cd in rice ranged from 0.0070 mg kg
−1 to 1.45 mg kg
−1. The proportion of studies where the Cd concentration in rice was lower than the national food safety standard limit (GB 2762-2017) (0.2 mg kg
−1) was 79%. The spatial distribution of Cd concentration in rice is presented in
Figure 1a, with larger dots representing higher Cd concentrations. Studies on excess Cd content in rice were mainly conducted in the central part of Sichuan province in the upper reaches of the Yangtze River, the southwest of Chongqing, the southeast and northeast of Hunan, as well as the northern part of Anhui, southern Jiangsu, and northern Zhejiang in the Yangtze River Delta region. Studies on Cd accumulation in rice have also been conducted in other major rice-producing countries, including Thailand, Bangladesh, Indonesia, and India. Effective methods should be formulated to remediate Cd-contaminated rice in Punjab (India, 0.99 mg kg
−1) and Mae Tao (Thailand, 0.329 mg kg
−1), where the average Cd concentration in rice exceeds the required limit. The spatial distribution of Cd concentrations in wheat is shown in
Figure 1b. The average concentration of Cd in wheat ranged between 0.0080 mg kg
−1 and 2.0 mg kg
−1, and the proportion of studies where the Cd concentration in wheat was lower than the national food safety standard (0.1 mg kg
−1) was 83%. Studies on excessive Cd concentration in wheat were mainly conducted in the southern part of Sichuan in the upper reaches of the Yangtze River, the southeastern and northern parts of Hunan Province, the southern part of Jiangsu, and the southern part of Zhejiang in the Yangtze River Delta region, as well as Shandong and Henan provinces in the southeast of the Yellow River Basin. The Cd pollution of wheat in the rice and wheat cropping system was relatively low compared with the Cd pollution in rice, and the pollution area was smaller for wheat.
Figure 1.
Distribution of Cd concentrations in (
a
) rice and (
b
) wheat, based on data collected from previous studies.
Table 1.
The cadmium pollution of rice and wheat cropping systems in eleven provinces in China.
| Province |
Mean/Ricecd (mg kg−1) |
Range (mg kg−1) |
Mean/Wheatcd (mg kg−1) |
Range (mg kg−1) |
Reference |
| Jiangsu |
0.0532 ± 0.0204 |
0.0040~0.4190 |
0.1050 ± 0.0320 |
0.0150~0.8700 |
[48][49]56[50][51][52][53][54][55][56][57][58],57[,5859,59][,6060][55,,61,62,63,64,65,66,67] |
| Zhejiang |
0.1216 ± 0.0378 |
0.0200~0.3400 |
0.9010 ± 0.3361 |
0.0233~1.30 |
[61][62][63][64][65][68,69,70,71,72] |
| Anhui |
0.0860 |
0.0860 |
0.0358 ± 0.0250 |
0.0358~0.0102 |
[55][66][67][62,73,74] |
| Hunan |
0.4322 ± 0.1513 |
0.0420~1.415 |
0.8720 ± 0.3185 |
0.0400~1.57 |
[55][64][67][68][69][70][71][62,71,74,75,76,77,78] |
| Jiangxi |
0.0605 ± 0.0185 |
0.0420~0.0790 |
— |
— |
[72][79[73],80] |
| Sichuan |
0.4403 ± 0.2123 |
0.1100~1.4500 |
0.3448 ± 0.1896 |
0.0400~0.4400 |
[5]5[61][74][75][,6876,81],82[77,83][78][,84,85] |
| Hubei |
0.0460 |
0.0460 |
0.0533 ± 0.0233 |
0.0300~0.100 |
[54][79][80][61,86,87] |
| Chongqing |
0.0462 ± 0.0143 |
0.0220~0.0870 |
0.0080 |
0.0080 |
[81][82][88,89] |
| Shanghai |
0.0448 ± 0.0111 |
0.0190~0.0820 |
— |
— |
[83][90] |
| Henan |
0.0046 |
0.0046 |
0.0482 ± 0.0174 |
0.0100~0.6300 |
[55][66][84][85][86][62,73,91,92,93] |
| Shangdong |
— |
— |
0.0435 ± 0.0061 |
0.0100~0.0920 |
[54][87][61,94] |
The Cd content in rice and wheat in Hunan Province increased significantly. Studies reported that the average concentration of Cd in rice and wheat was 0.21 mg kg
−1 and 1.08 mg kg
−1, respectively. Hunan province is known for its rich non-ferrous metals and extensive mining industry. The elevated Cd concentration in the paddy soils in Hunan province was highly correlated with the mining activities, and non-ferrous metal smelting was mainly conducted in the Xiangjiang River Basin. Studies on Cd pollution in paddy fields in the Xiangjiang River Basin showed that the average concentrations of Cd in paddy soils in Chenzhou, Xiangtan, Hengyang, Zhuzhou, Changsha, and Xiangyin city were 3.01, 1.93, 1.73, 0.50, 0.39, and 0.66 mg kg
−1, respectively, all exceeding the recommended level
[88][89][95,96].
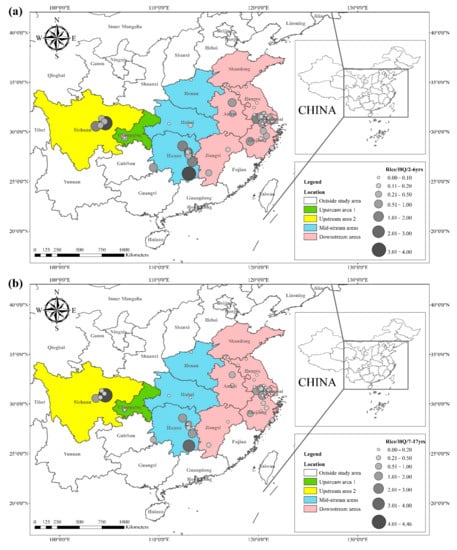
2.2. Cd Hazard Quotients in Rice and Wheat
The health risks of exposure to heavy metals through oral, dermal, and inhalation routes can be assessed using a health exposure risk equation. The risk of exposure through dietary Cd intake is expressed in terms of
ADI and
HQ. The World Health Organization (WHO) has established a provisional tolerable daily intake (
PTDI) for Cd of 0.06 mg kg
−1 day
−1; exposed populations have high health risks when the
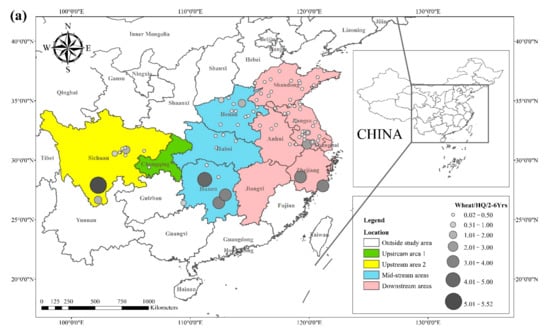
HQ is greater than 1. Dietary Cd intake poses a threat to local populations due to the combined effect of high grain intake rates and high grain Cd concentrations. The overall Cd concentration in Hunan province is significantly higher than that of other regions due to the extensive industrial activities in this region. The average Cd concentration in rice in Hunan exceeds the recommended limit by approximately 62%, and the average Cd concentration in wheat exceeds the recommended limit by about 81%. The spatial distribution of dietary Cd intake (
HQ) in rice and wheat is shown in
Figure 2, with a larger point indicating a higher risk factor. Findings from reviewed studies showed that the average risk factor for Cd in rice was 1.20, and the average risk factor for Cd in wheat was 1.54. The areas with a high
HQ of Cd in rice were mainly located in the Yangtze River Basin and the southeastern coastal areas, including Sichuan, Hunan, Anhui, Jiangsu, and Zhejiang. Studies conducted in Chongqing, Hubei, and Shandong showed that the risk factor for Cd was low in these regions. The areas with a high
HQ of Cd in wheat were primarily located in Sichuan, Hunan, Anhui, Jiangsu, Zhejiang, and Henan, and the risk factors for Cd in Chongqing, Hubei, and Shandong were lower compared with other regions. Consumption of locally produced rice and wheat increased the intake of Cd by the local population.
Figure 2.
HQ
of Cd in (
a
) rice and (
b
) wheat, based on data collected from previous studies.
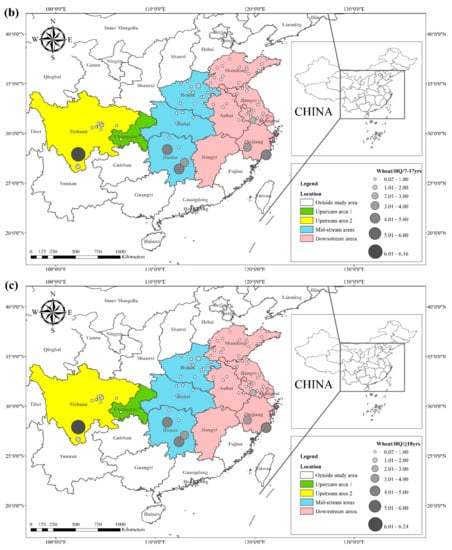
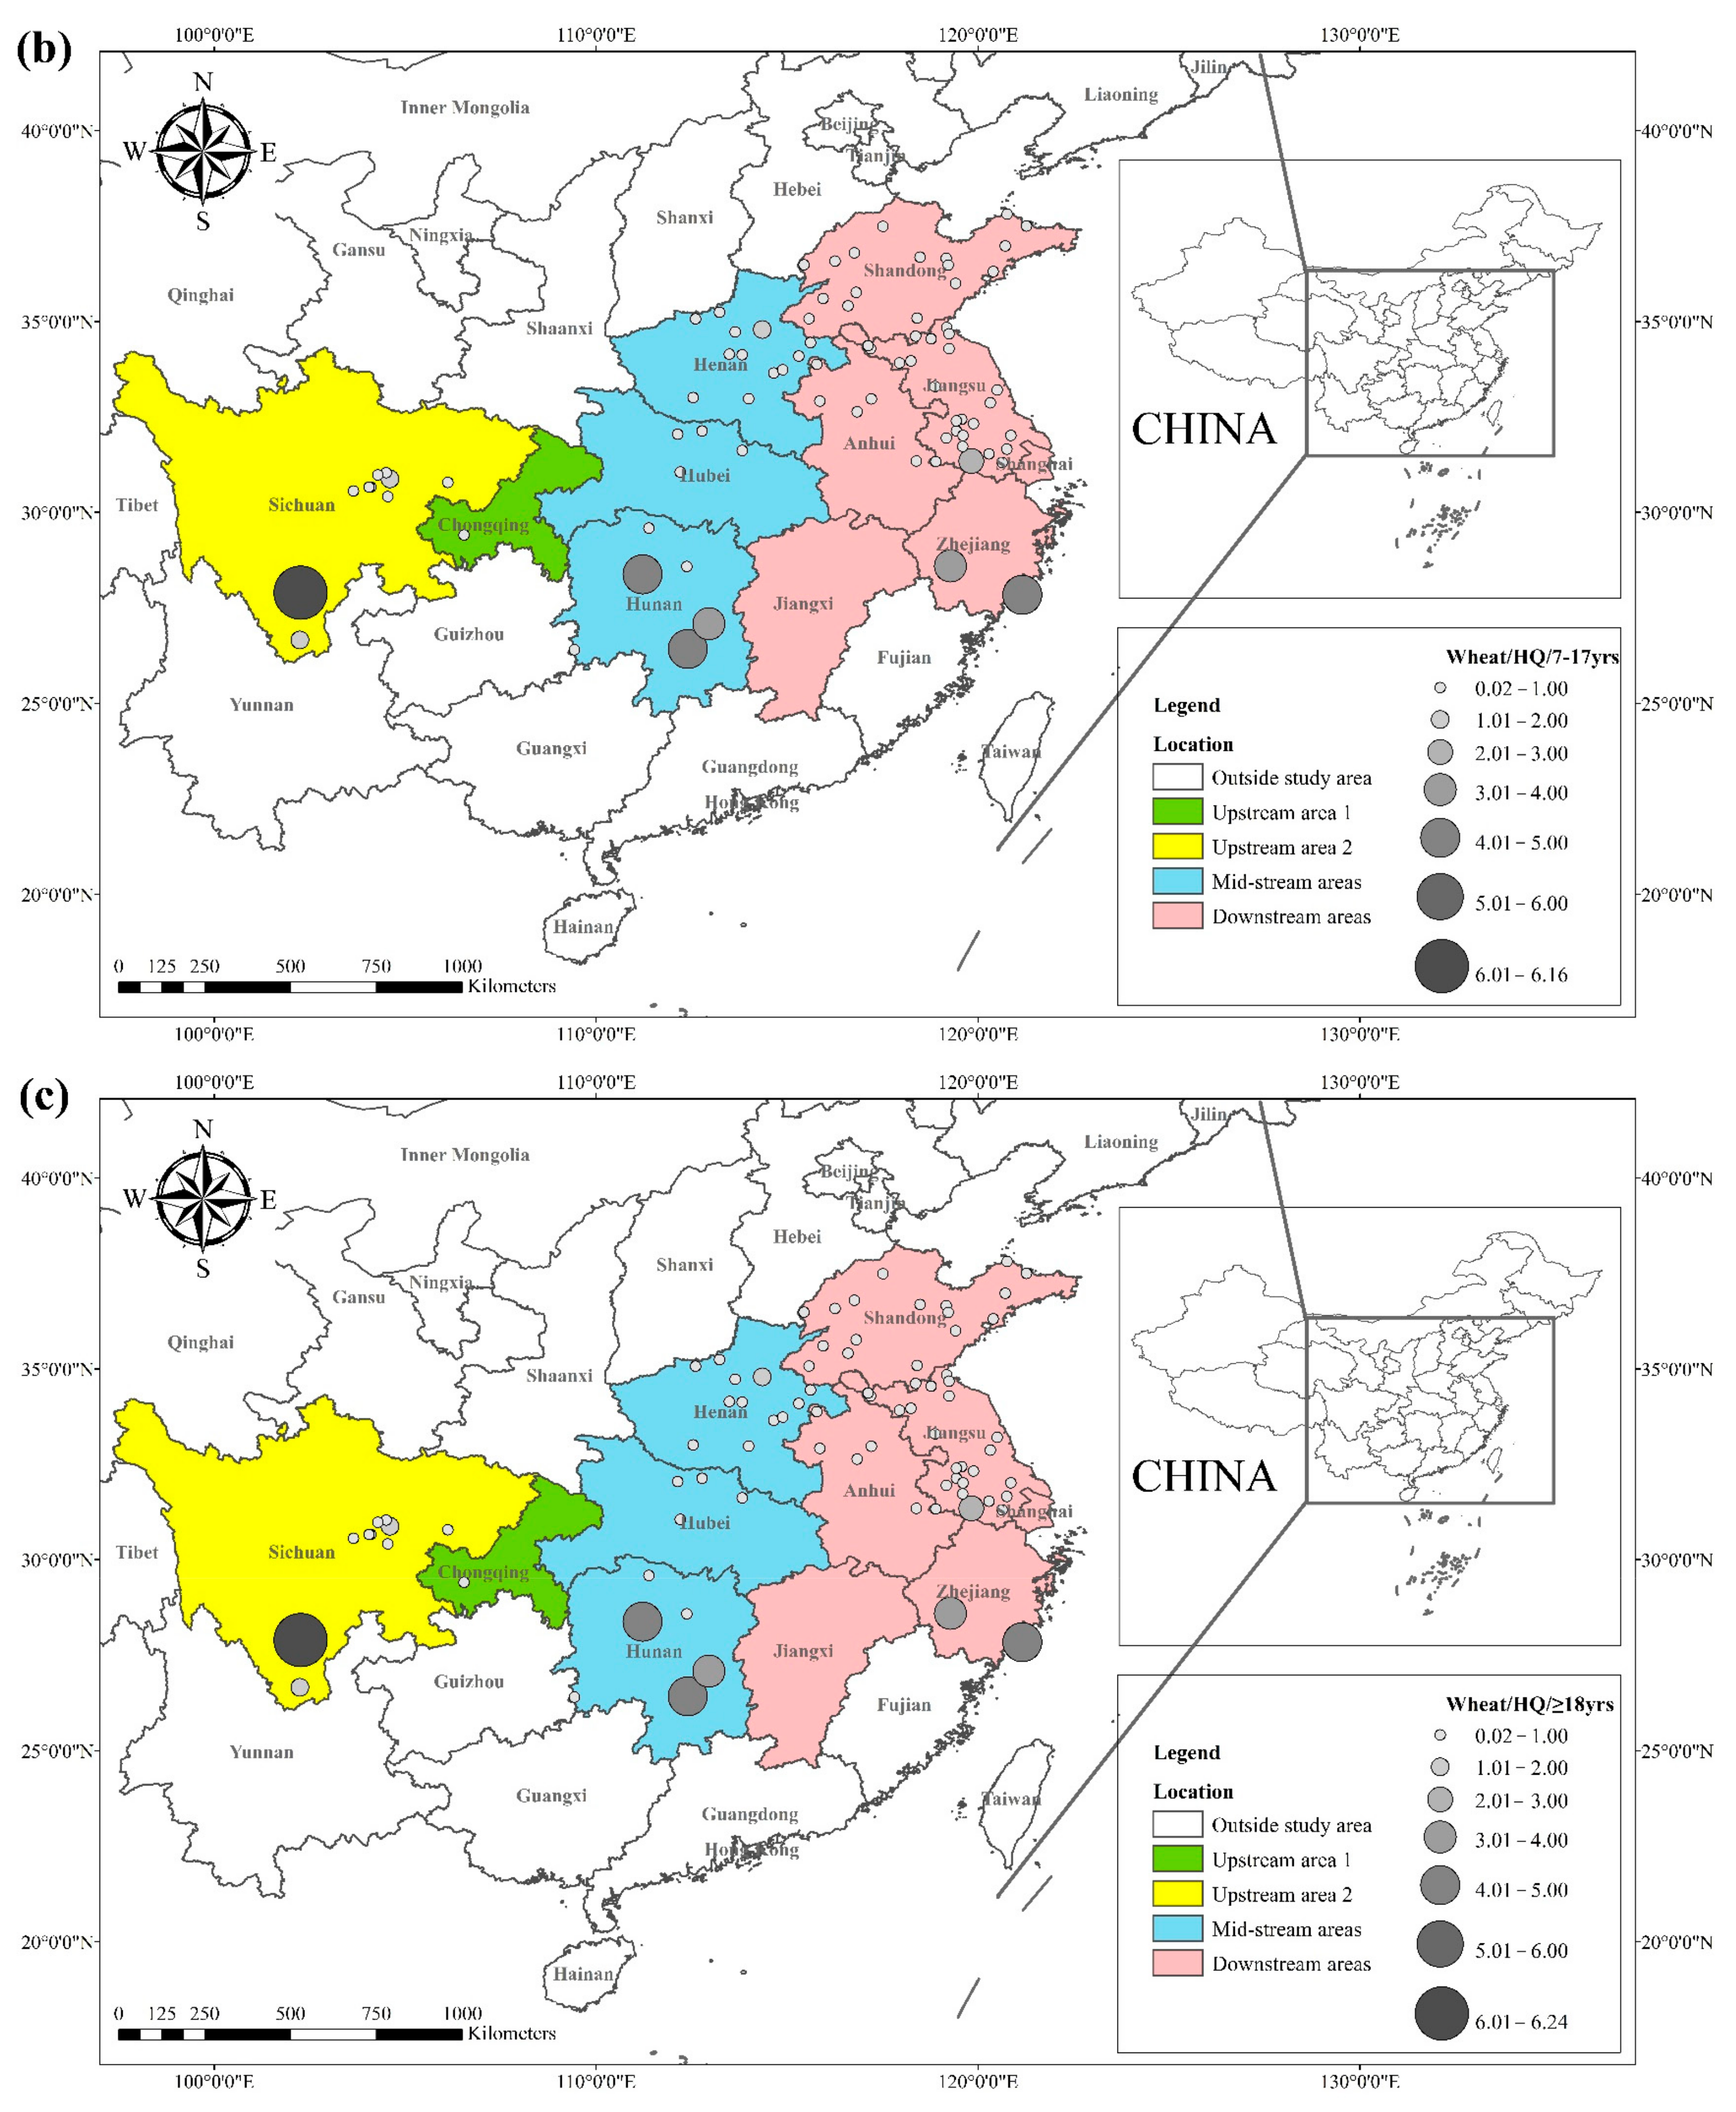
The
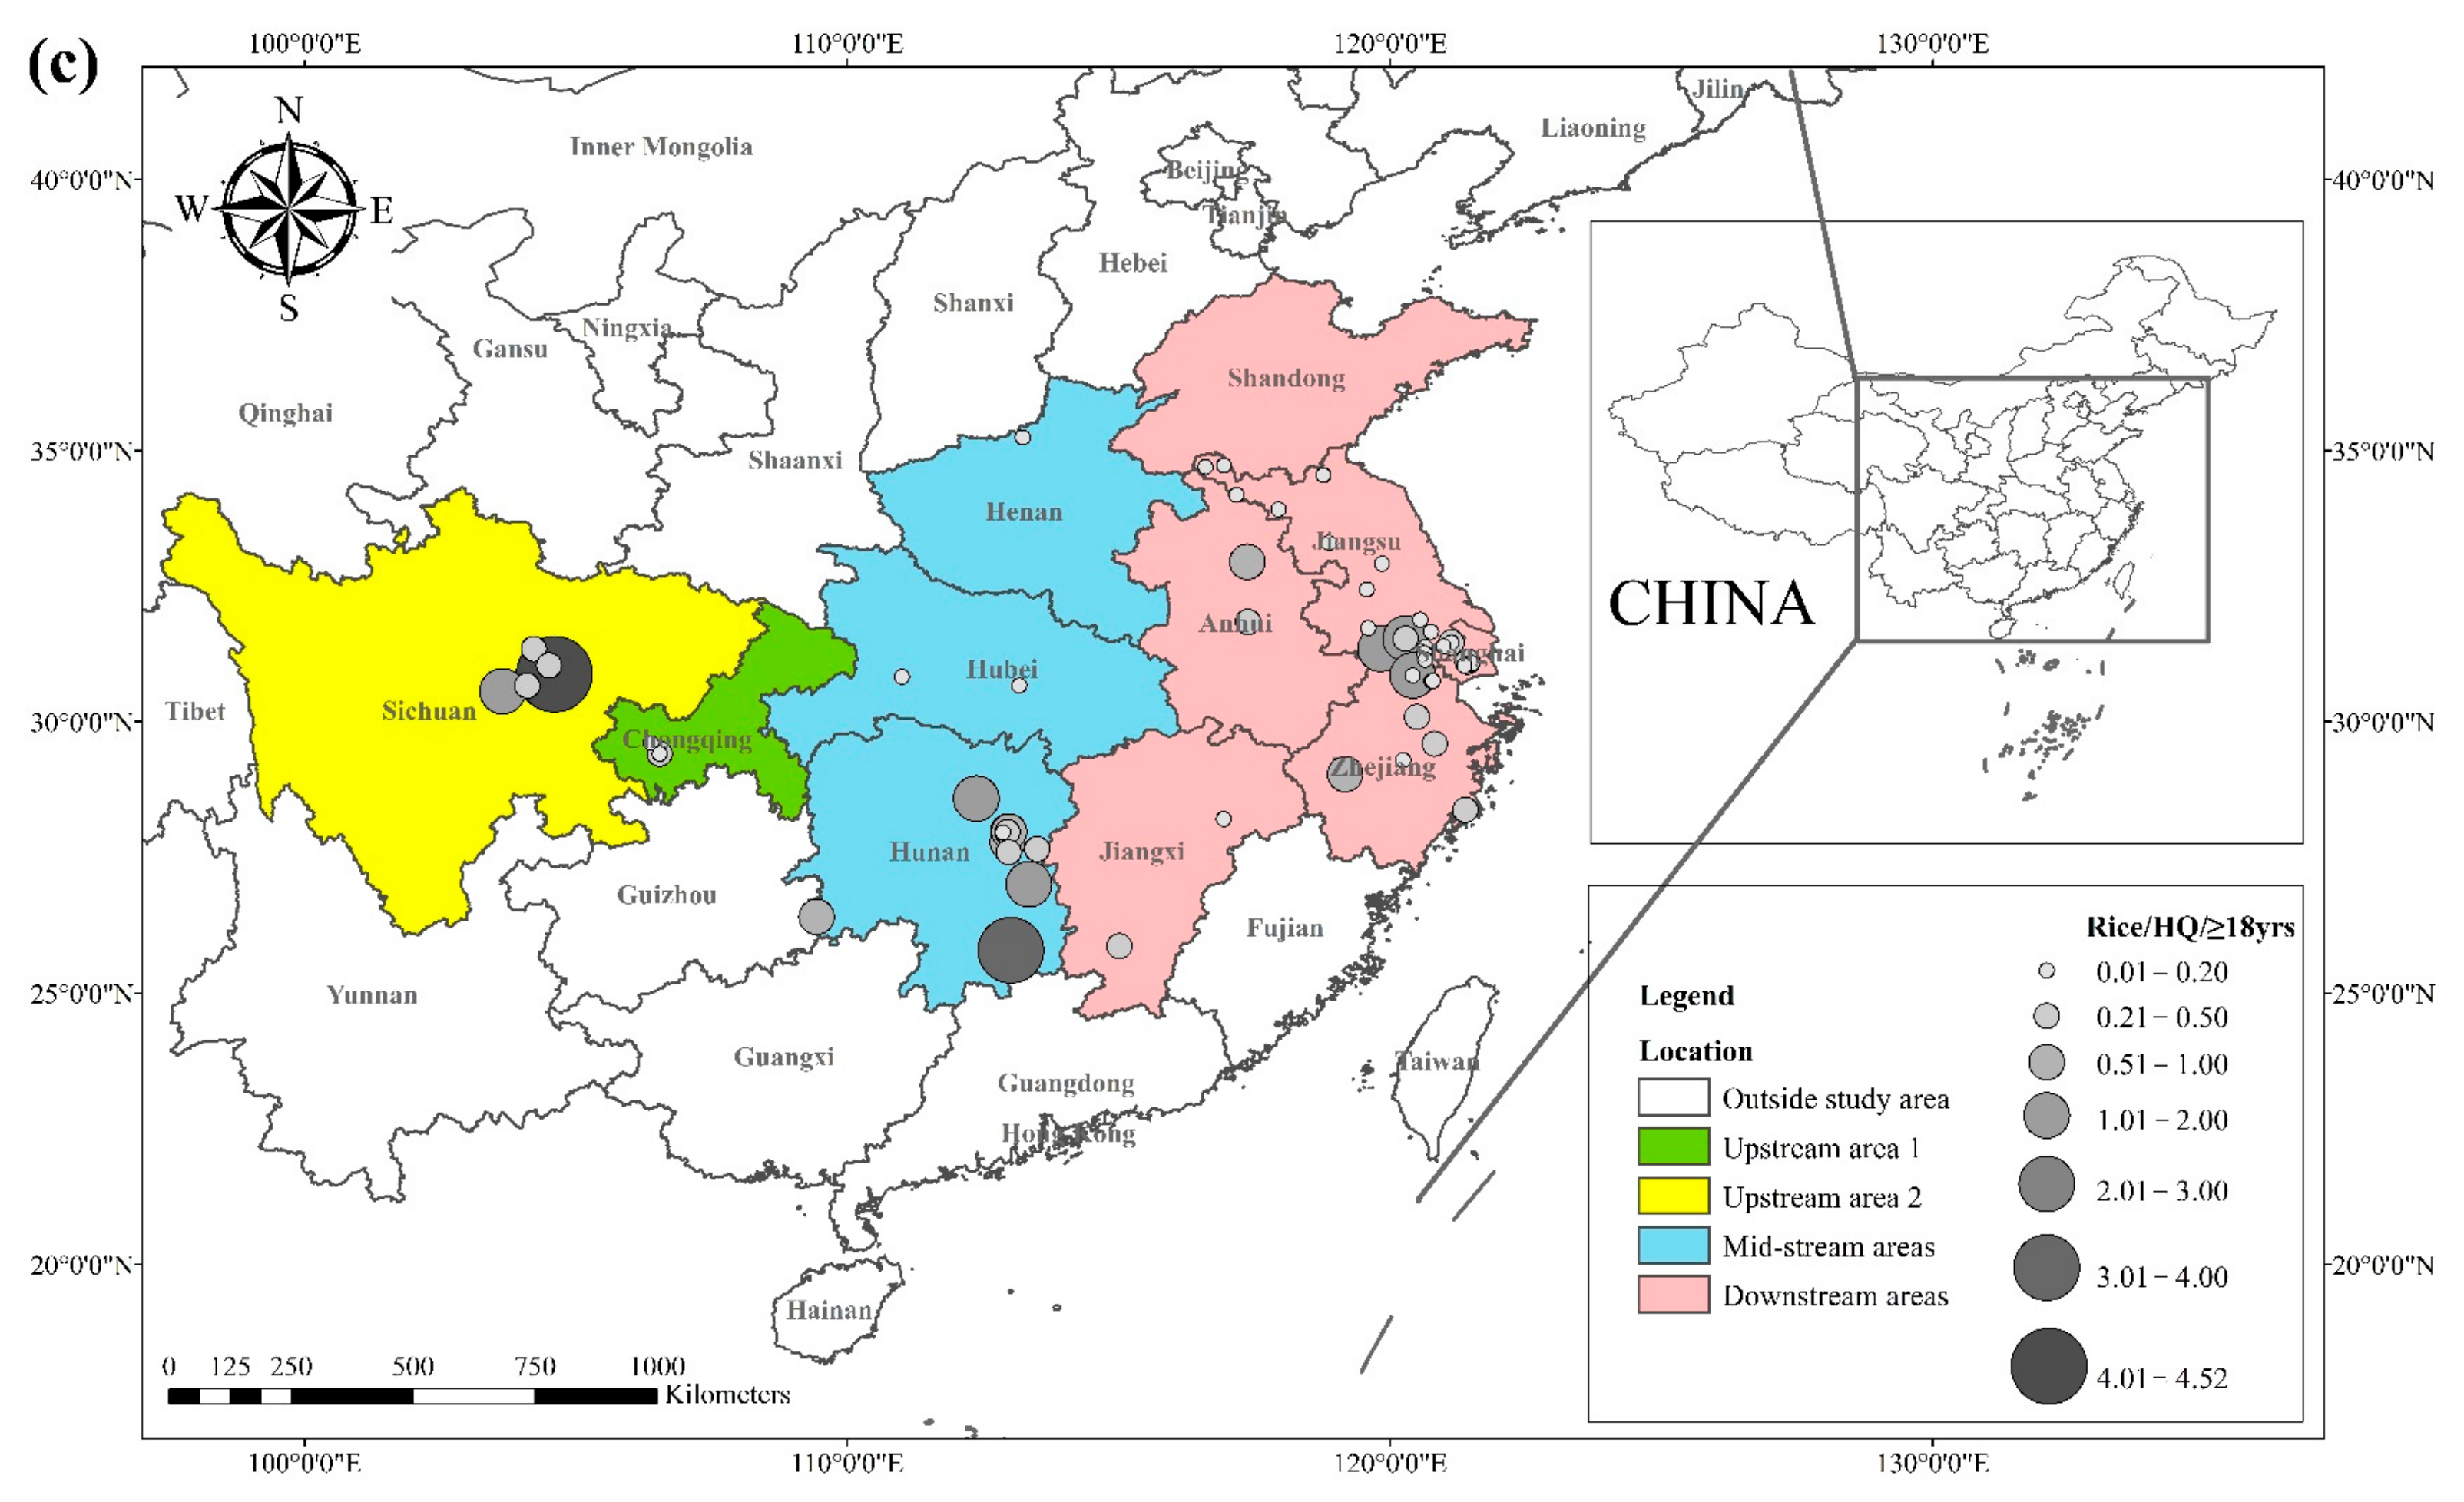
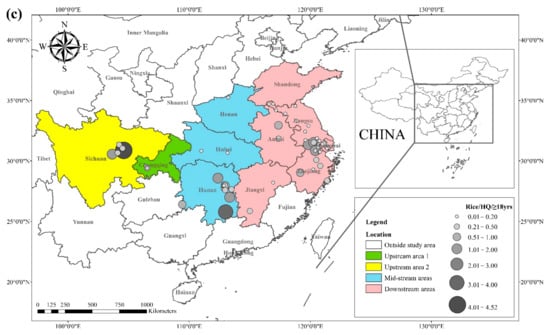
HQ for the dietary consumption of rice and wheat for the corresponding populations (children (2–6 yrs.), adolescents (7–17 yrs.), and adults (≥18 yrs.)) are presented in
Figure 3 and
Figure 4. The areas with a high
HQ dietary intake of Cd in rice for children, adolescents, and adults were mainly located in central Sichuan, central and eastern Hunan, northern Anhui, and southern Jiangsu. The
HQ value for rice and wheat in Hunan province was 1.8 and 2.6 times higher than the national average dietary Cd intake of 15.3 μg kg
−1 BW month
−1, respectively, according to the 2015 General Diet Study
[38][90][38,97]. In contrast, dietary Cd exposures in populations outside Asia were generally very low. A previous study reported that the Cd exposure in the European population was 6.4~9.6 μg kg
−1 BW month
−1 [91][98], whereas the Cd in Australia was 2.2~6.9 μg kg
−1 BW month
−1, and that in the United States was reported as 4.6 μg kg
−1 BW month
−1 [92][99]. The areas with a high
HQ of dietary Cd in wheat for children, adolescents, and adults were primarily located in southern Sichuan, central and eastern Hunan, southern Jiangsu, and southern Zhejiang, with
HQ values greater than 1. Notably, Sichuan and Hunan provinces exhibited average dietary Cd intakes 5.5 and 8.1 times higher than the recommended intake, respectively.
Figure 3.
(
a
)
HQ
/2–6 yrs., (
b
)
HQ
/7–17 yrs., and (
c
)
HQ
/ ≥ 18 yrs. of Cd in rice, based on data collected from previous studies.
Figure 4.
(
a
)
HQ
/2–6 yrs., (
b
)
HQ
/7–17 yrs., and (
c
)
HQ
/ ≥ 18 yrs. of Cd in wheat based on data collected from previous studies.
2.3. Cd in Rice-Wheat Cropping Field
A high
HQ is positively correlated with a high concentration of Cd in soil. The first step in preventing Cd in grain is to identify and block major sources of contamination in the soil-based rice/wheat system. A high Cd concentration in agricultural soils mainly results from the geological background derived from the parent material and from human activities, such as the deposition of the atmosphere, mining activities, irrigation using wastewater, the application of phosphate fertilizers, livestock manure, organic fertilizer, and sludge application. Cd is a naturally occurring non-essential trace element, and the average concentration of Cd in soils is 0.01~2.00 mg kg
−1 globally, whereas the average concentration in China ranges from 0.10~1.80 mg kg
−1 [93][100]. Cd mainly exists as a complex with sulfur. Cd is released from this complex into the surface environment during mineral rock weathering. Parent materials determine the Cd content in soil systems. Soils derived from parent materials inherit the characteristics of the parent materials and their trace element content
[94][101]. A study conducted in the Khorat Basin of Thailand showed that the different properties of parent materials significantly contributed to the chemical composition of paddy soils
[95][102]. In addition, a study in Guizhou, China, reported that dry land topsoil derived from carbonate rocks had higher levels of Cr, Cd, and Hg
[96][103]. The soil background value represents the contribution of the parent material, which exhibits a complex and diverse distribution in China. Geographic differences in soil Cd background values are observed, with higher background values reported in some provinces, such as Guizhou and Guangxi. Although there was no notable anthropogenic source of heavy metal pollution in the sampling area, an elevated Cd content was observed in paddy soil samples from the Cd geological anomaly areas in Guangxi and southwest China regions, which can be attributed to the weathering of carbonate rocks
[97][98][99][100][104,105,106,107].
3. Mechanism of Cd Pollution in Rice and Wheat Cropping System
3.1. Transport of Cd in Rice and Wheat Cropping System
The negative effects of Cd on crop physiological and biochemical processes, such as protein metabolism, mineral absorption, and photosynthesis, have been widely studied in the past
[101][102][126,127]. The excessive accumulation of Cd in crops will significantly affect the growth and development of crops and lead to the further accumulation of Cd. Cd accumulation in crops is, therefore, influenced by a variety of soil factors, as well as the bioavailability and environmental availability of the crop to Cd. Environmental availability represents the content of heavy metals in soil, mainly including the proportion dissolved in pore water and the proportion adsorbed on the surface of soil minerals. Bioavailability refers to the portion of heavy metals dissolved in pore water that can be absorbed by the plant, while toxic bioavailability refers to the portion that accumulates in the plant and may be toxic to the plant
[103][104][128,129].
The transport of bioavailable Cd from soil to rice grains is via coplastids that absorb roots and via root cells that load or sequester xylem. Cd is then transported through the xylem to the shoots and through the xylem to the nodes. The transport and accumulation of phloem to grain begins. Cd is a transcellular process regulated by a variety of transporters, such as absorption by root isoplasts, loading or isolation by root cells in the xylem, transport to nodes through the xylem, and transport to grains through the phloem. For example,
OsIRT1 (IRT, iron-regulated transporter) and
OsNramp1 (Nramp, natural resistance-associated macrophage protein) transporters are involved in the uptake of Cd in roots. The
OsHMA3 protein regulates Cd sequestration in root cell vacuoles, whereas
OsHMA2 (HMA, a P1B-type ATPase) regulates Cd delivery to developing tissues.
OsLCT1 (
OsLCT1, a low-affinity cation transporter) is a transporter associated with phloem Cd transport
[99][106]. In the transport of Cd from soil to grain, xylem loading and transport is the first rate-controlling step, while phloem transport and unloading is the last rate-limiting step. Roots and nodes are the basic barriers to Cd transport to brown rice grains
[105][106][130,131].
Cd uptake in wheat plants is mainly through the roots
[107][108][132,133]. The rate of Cd uptake by wheat varies with soil type, air pollution, and wheat variety
[109][110][111][134,135,136]. In addition, root exudates play an essential role in the accumulation of Cd in wheat
[111][136]. A recent study showed that chlorine (Cl
− could activate Cd in soil and increase the rate of Cd uptake by wheat. Depending on the wheat variety, the high and low concentrations of Cd accumulated by the root system after Cd uptake are transferred to the shoots
[112][113][137,138]. Studies report that the higher retention of Cd in roots can be attributed to the chelation of Cd by organic acids
[107][132]. However, another study reported that phytochelation might not be a limiting factor for the differential storage of Cd in wheat roots
[114][139]. Shoot Cd accumulation in wheat depends on root-cadmium transport, whereas Cd accumulation in wheat grain mainly depends on root-shoot Cd transfer and the indirect transport of Cd from root to grain through xylem-to-phloem of the stem
[115][116][140,141]. Riesen and Feller (2005) reported that Cd could be reactivated in wheat by the phloem and transpiration process
[117][142]. Rice exhibits significant differences in Cd transport and accumulation among various genotypes. A study was conducted on 38 rice genotypes (indica vs. japonica), and the results showed that Cd concentrations ranged from 0.06 mg kg
−1 to 0.99 mg kg
−1, with significantly higher Cd accumulation levels in indica rice than in japonica rice
[118][143]. Differences in grain Cd accumulation between different genotypes can be attributed to the differences in the transport of Cd from vegetative organs such as leaves and stems to the reproductive parts
[119][144]. Cd transport in the rice-soil ecosystem is regulated by various transporters. Therefore, the expression level of the transporter gene and the content of the transporter affect the level of accumulation of Cd in rice. Overexpression of the
OsHMA3 protein limits Cd accumulation in rice grains and enhances Cd tolerance
[120][145]. In addition, the co-expression of
OsHMA2,
OsLCT1, and
OsZIP3 effectively inhibits Cd transfer and accumulation in rice grains
[121][146].
For safe wheat production, people have tried to screen and plant low-Cd-accumulating wheat varieties in light and moderate Cd-contaminated farmland
[122][123][147,148]. Zhang et al. planted 8 wheat varieties in Cd-contaminated soil with a soil Cd content of 1.12 mg kg
−1 (pH = 7.15)
[123][148], of which 6 wheat varieties had a grain Cd content lower than the national food safety standard (0.10 mg kg
−1). Chen et al. (2017) screened out 10 low-Cd accumulation varieties from 261 wheat varieties and planted them in Cd-contaminated farmland with a soil Cd content of 2.4 mg kg
−1 (pH = 7.35)
[124][149]. Low Cd accumulation in wheat cultivars is related not only to its genetic characteristics, such as low expression of transporters
[125][150], smaller root morphological parameters (root length, surface area, and volume), etc. but also to its rhizosphere exudates and microbial communities
[126][151]. Variety is an important factor affecting the Cd content of wheat grains. In some densely populated countries such as China and India, the use of heavy metal-contaminated farmland for agricultural production is inevitable, and planting crops with a low accumulation of heavy metals is a cost-effective measure to achieve food security in these regions.