Your browser does not fully support modern features. Please upgrade for a smoother experience.
Please note this is a comparison between Version 1 by Mudassir Ali khan Ali Khan and Version 2 by Beatrix Zheng.
Global climate change has increased severe torrential hazards, particularly debris flows in mountainous regions. After floods and earthquakes, debris flows are the most devastating natural hazard in the world. The effects of debris flow on human life and built environments necessitate reconsidering current infrastructure planning, engineering, and risk management practices. Hence, the vulnerability of elements at risk is critical for effective risk reduction systems.
- debris flow
- vulnerability approach
- uncertainties
- damage assessment
1. Introduction
Rapid climate change has a high-order impact on natural and engineered slope stability, resulting in serious mountainous hazards. However, the nature, location, magnitude, direction, and frequency of hazards in response to climate change are still uncertain [1]. Among the mountainous hazard, debris flows are a tragic and expensive hazard worldwide. Sometimes the consequences are pathetic because they hit the built environment rapidly and without warning [2][3][2,3]. Earlier, it was difficult to quantify the global loss occurred by debris flow due to a lack of systematic data collection techniques. However, since 2004, systematic hazard databases and mass media reports have allowed the proper quantification and spatial distribution of fatalities worldwide [4]. According to Dilley et al., 2005 [3], landslides and debris flows were responsible for roughly 1000 fatalities worldwide per year. In addition, 4862 fatal landslides were recorded from 2004 to 2016, resulting 55,997 fatalities (approx.) globally due to tectonic movement, climate change, and human activities. Furthermore, the Global Fatal Landslide Database (GFLD) shows that landslides are unevenly distributed, severely affecting South America, East Africa, Turkey, Iran, the European Alps, and Asia (along the Himalayan Arc) [4][5][4,5].
Furthermore, Dowling and Santi [6] analyzed the 213 debris flow events from 38 countries and reported almost 77,800 fatalities from 1950 to 2011, making it the third-largest dangerous hazard after floods and earthquakes. Most recently, flood with debris flows affected 33 million people and killed more than 1500 in Pakistan between mid-June and July 2022 [7]. Moreover, the Republic of South Korea claimed 1728 fatalities (approx.) between 1977 and 2017, with an estimated loss of USD 500 million to USD 1 billion due to debris flow hazards [5][8][5,8]. Additionally, the United States Research Council reported that each year in the United States, landslides caused by wildfires and strong rains claim the lives of an average of 25 to 30 individuals [9]. Therefore, debris flows brought on by anthropogenic climate change cause remarkable financial losses [10][11][12][10,11,12] and always pose a serious threat to human life and the built environment. Hence, detailed and robust studies are required to quantify the vulnerability by considering climate change in the built environment.
Recent studies advanced the research on the likelihood of hazard occurrence [13][14][13,14], its runout distances, [15][16][15,16] triggering, monitoring [17], and hazard mapping of debris flows [18][19][20][21][18,19,20,21]. Furthermore, at the same time, researchers’ interest has grown in developing frameworks by considering the interaction between natural hazards and elements at risk [22][23][24][25][22,23,24,25]. In this respect, vulnerability plays a crucial role in determining a geological hazard’s danger. It uses several ideas to reflect various characteristics of scientific fields and their intended usage (i.e., physical, social, institutional, systematic, and functional). As long as physical vulnerability is concerned, it deals with the degree of loss to an element or set of elements impacted by an external source within the affected area on a scale of 0 (no loss) to 1 (total loss) [26]. In this context, matrices, curves, and indicators have proven successful methods for determining how structures are vulnerable to debris flow hazards [27]. However, these methods have their strengths and weaknesses due to the availability of hazard data, regional specificities, and applicability of each approach to the built environment. Furthermore, uncertainties associated with these approaches make the system unreliable [28] and sometimes underestimate the loss and damage associated with the hazard. Therefore, it is necessary to precisely predict the debris flow characteristics, vulnerability, and uncertainties at each step of the risk assessment system.
2. Debris Flow and Its Consequences
Debris flows are very rapid to extremely rapid non-plastic flows. It may be defined as the mixture of loose sediments and water that moves down in a steep channel [10][21][10,21]. A debris flow event may occur in a series of surges that travels several hundred kilometers with a velocity ranged 4–16 m/s [29]. Based on the moment transfer mechanism, many events are identified as debris slides, mudflows, debris floods, debris torrents, mud spates, and lahars [10][30][31][10,30,31]. However, this researchticle only focuses on the debris flow and its consequences on the built environment. The debris flow density ranges from 1800 to 2400 kg/m3, twice the density of mud slurry [32][33][32,33]. Climate change (e.g., intense rainfall), deforestation, and earthquakes are the primary causes of debris flows [34][35][36][34,35,36].
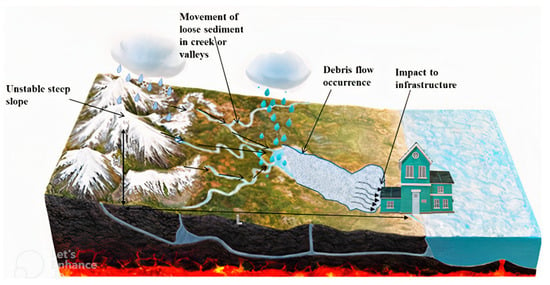
Additionally, wildfires, melting glaciers, and disruption of snow cover distribution due to unfavorable weather conditions are other important factors triggering most debris flows in mountainous regions [37]. For instance, extensive rainfall for a long period initiates steep slope failure leading to massive sediment entertainment in the stream. These sediment movements later converted into disruptive events for many systems of infrastructure, as illustrated in Figure 1. The slope failure mechanism is a complex phenomenon caused by the reduction of cohesive forces between soil particles and the dissipation of pore pressure due to the infiltration of rainwater into the slope. Furthermore, additional load and relief, improperly designed or poorly executed drainage systems significantly affect the overall stability of slope [37][38][37,38].

Figure 1.
Illustration of debris flow process and impact on infrastructure.
Debris flow consequences are broadly divided into physical and socioeconomic impacts on customers or users of the infrastructure. Physical impacts are the most immediate ones, including injuries, fatalities, and emotional loss to victims, as well as complete to partial damage to infrastructures such as buildings, rail tracks, roads, and utility lines. On the other hand, the socioeconomic impact is the long-term impact due to the relocation of residences and loss of jobs and capital due to debris flow hazards.
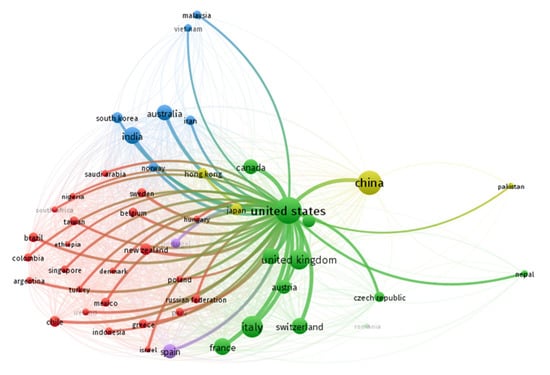
According to the United States National Research Council (2011) [39], landslides caused an almost USD 1 billion loss in America, Japan, Italy, India, China, and the Soviet Union from 1960 to 1980. In addition, debris flow has damaged 390 commercial and residential buildings in China [40], 20 roads in South Korea [41], and several bridge piers in Romania [42]. Moreover, a debris flow event (1993) in the Kulekhani watershed, located in the lesser Himalayan region of Nepal, damaged the Amaluza dam. This dam was a component of the Paute hydroelectric plant, which supplied 65% of the electricity need consumed by Ecuador. Debris flood caused by dam failure severely damaged the hundreds of private homes and industrial complexes in the Rio Paute valley [43]. Therefore, estimation of the probability of debris flow occurrence and their extent with the vulnerability of elements at risk always support decision-makers in developing efficient mitigation and protection solutions. In this regard, researchers have been trying to develop different computational and analytical methods to estimate the possibility of hazard occurrence, loss to the built environment, and designing suitable risk reduction strategies for the last 20 years. Figure 2 represents the extensive research carried out in the vulnerability assessment of debris flow hazards by considering hazard intensity and damage by advanced monitoring technique, digital elevation model (DEM), and photogrammetry [31] from the United States to other subcontinents of the world. Figure 2 has been extracted by several sets of bibliographic analysis in VOS viewer software.

Figure 2. A bibliographic representation of the countries contributing to the physical vulnerability assessment research of debris flow hazards in the last 20 years (Vos viewer).
Furthermore, countries such as the United States, United Kingdom, Canada, China, and India continuously contribute to developing the landslide inventory, pre- and post-event data acquisition systems, and hybrid vulnerability assessment techniques for better risk management strategies.
