Your browser does not fully support modern features. Please upgrade for a smoother experience.
Please note this is a comparison between Version 1 by Junxiang Zhu and Version 2 by Camila Xu.
Information exchange between building information modelling (BIM) and geographic information system (GIS) is problematic, especially in terms of semantic information. Graph-based technologies, such as the resource description framework (RDF) and the labelled property graph (LPG), are promising in solving this problem. These two technologies are different but have not been systematically investigated in the context of BIM/GIS integration.
- building information modelling (BIM)
- geographic information system (GIS)
- industry foundation classes (IFC)
1. Introduction
1.1. Overview of BIM and GIS Integration
The integration of building information modelling (BIM) and geographic information systems (GISs) enables the creation of large-scale virtual city models, which can contribute to the development of smart cities and digital twins [1], which has been investigated by researchers from the Architecture, Engineering, and Construction (AEC) domain and the geospatial industry over the past ten years, at both the application level and the fundamental data level. While application-level studies primarily investigate the joint use of BIM and GIS technologies in solving practical problems, such as flood damage assessment [2][3][2,3], traffic noise assessment [4], supply chain management [5][6][5,6], offshore platform disassembly [7], and construction risk management [8], data-level studies investigate how to effectively integrate data from these two diverse sources to better support the upper application-level studies [9]. Data-level studies are required because BIM data cannot be directly and fully read by GIS applications, which is an across-domain interoperability issue.
1.2. The Interoperability Issue between BIM and GIS
Interoperability issues are common between information systems, such as GISs that integrate heterogeneous data from various sources, such as satellite images from remote sensing [10], topographic data from surveying and photogrammetry [11], location data from positioning systems [12], and other textual or tabular data. An early study on interoperability is from Bishr [13], which investigated the interoperability issue among GISs and proposed six levels of interoperability in relation to network protocols, hardware and OS (Operating System), spatial data files, DBMS (database management system), data model, and application semantics, respectively.
The interoperability can be improved by advances in the underlying technologies [13]. By far, many of the interoperability issues have been properly addressed for GIS, such as those related to network protocols, hardware and OS, spatial data files, and DBMS. For example, common database APIs (Application Programming Interface), such as ODBC (Open Database Connectivity) and JDBC (Java Database Connectivity) [14], can be used to improve interoperability at the DBMS level.
This interoperability theory can also be applied to BIM/GIS integration. Between BIM and GIS, the interoperability issue is at both the syntactic and semantic levels [15][16][15,16]. Syntactic interoperability is mainly about accessing information, i.e., how to read building information, while semantic interoperability is mainly about understanding information, i.e., how to interpret building information. Bishr [13] proposed two approaches for improving data interoperability, including (1) providing the data receiver with information about the data and (2) providing a mechanism that enables automatic data conversion. In the context of BIM/GIS integration, most studies adopted the second approach. They converted BIM data in the open IFC (Industry Foundation Classes) format into common GIS formats, such as CityGML (City Geography Markup Language) [17], GML (Geography Markup Language) [2], shapefile [18][19][18,19], 3D tiles [20], and 3D scene layer (I3S) [21]. To facilitate BIM-to-GIS data conversion, there are also efforts in developing international standards, such as the ISO/TR 23262:2021 [22] for GIS(geospatial)/BIM interoperability and the ISO/TS 19166:2021 [23] for BIM to GIS conceptual mapping (B2GM).
1.3. The Basic Pattern for BIM-to-GIS Data Conversion
The mainstream of BIM/GIS integration is to use building information in GIS [24][25][24,25], due to the different strengths of BIM and GIS. In the workflow of BIM/GIS integration, BIM is usually used as an information source and GIS is used for information processing and analysing, and BIM data need to be converted.
During the data conversion, two aspects of BIM data need to be considered, i.e., geometry and semantics. Geometric information is about the size, shape, location, and orientation of models, while semantic information provides additional information about these models, such as attributes, relations, and properties, which is also referred to as non-geometric information [26][27][26,27]. Due to their diverse natures, these two types of information need to be handled separately.
Accordingly, data-level integration of BIM and GIS mainly deals with two tasks, i.e., geometry conversion and semantics transfer [24][25][24,25]. Geometry conversion deals with the conversion of ‘shape’, so that the shapes of building components created by BIM, both explicit shapes (e.g., boundary representation, or B-rep) and implicit shapes (e.g., swept solids and constructive solid geometry), can all be converted into explicit shapes to be used in GIS [28][29][30][28,29,30]. The process of converting implicit models into explicit models is referred to as boundary evaluation [31]. Semantics transfer deals with the transfer of semantic information (or the ‘information’ in BIM). The separately processed geometric information and semantic information are then combined again on the GIS side and used in practice [2][24][2,24]. This is the basic pattern for BIM-to-GIS data conversion (see Figure 1). A thorough review of BIM/GIS data integration has been presented by Zhu et al. [24].
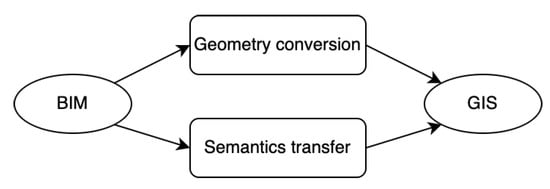
Figure 1.
The basic pattern for BIM-to-GIS data conversion.
1.4. Problems in BIM-to-GIS Conversion Paths
This basic conversion pattern can be expanded into detailed paths for converting BIM data into different formats on the GIS side. Zhu et al. [24] have identified four conversion paths on top of this basic pattern, including the dataset-oriented path, the system-oriented path, the data-model-based path, and the ontology-based path. Unfortunately, these conversion paths cannot address the interoperability issue on their own.
First, the dataset-oriented path has problems in geometry conversion and semantics transfer. (a) For the IFC-to-CityGML conversion, an effective and efficient way for the solid-to-surface conversion is absent, and the class mapping problem has not been well addressed. (b) For the IFC-to-shapefile conversion, the main problem is semantics transfer. The interconnected BIM information, which can be thought of as a graph according to Zhu et al. [21], cannot be effectively represented in the traditional relational database that is used by GIS [32]. (c) A relatively new format used in BIM/GIS integration is 3D Tiles, which is a format used by Cesium [33] to stream 3D geospatial datasets for web-based applications [34]. The IFC-to-3D-tiles conversion, like the IFC-to-shapefile conversion, mainly focuses on geometry and transfers limited semantics. Second, the data-model-based path mainly creates project-specific data models by identifying information requirements for projects. For example, the BO-IDM (BIM-oriented indoor data model) developed by Isikdag et al. [35] presents information requirements for indoor navigation. Using this path, only the required information was extracted and transferred. Third, the ontology-based path only focuses on semantics only, in which the geometry is neglected.
When the use of a single conversion path cannot solve the problem, a potential way to improve data interoperability is to jointly use several paths. For example, the geometric information can be handled by using shapefile or 3D Tile (the dataset-oriented path), while the semantic information can be stored in Resource Description Framework (RDF) (the ontology-based path), or other graph-based formats that can effectively represent the relationships [26].
1.5. Using Graph to Improve Interoperability
Graphs can be used to represent interconnected information [36], such as BIM information, and support efficient and effective information retrieval and analysis by using graph-traversal based algorithms [32]. Due to the flexible structure and the high performance in information storage and retrieval, graph databases are being adopted by many areas, such as the AEC domain [37][38][37,38], the geospatial industry [39], and the biomedical domain [40][41][40,41].
In a general sense, a graph can model most things in the world [42], and according to [43], a graph-based model is in many cases likely to facilitate the integration of information. In this sense, in the context of BIM/GIS integration, there would be a new form of using building information on the GIS side, which is ‘geometry plus graph’ (see Figure 2), instead of the traditional ‘geometry plus tables’.
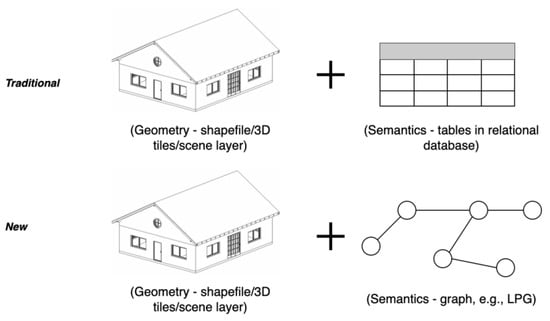
Figure 2.
A new form of using building information in GIS by using graph.
2. Using Graph in BIM/GIS Data Integration
2.1. Graphs and Graph Theory
Graph is a term generally used to describe diagrams consisting of nodes and edges. A graph can be mathematically described by using the equation, , where G is a graph, V indicates the set of vertices in the graph, and E is the set of edges in the graph [44][53], and . The graph theory studies graphs, including graph type (e.g., pseudograph, directed graph, labelled graph, and multigraph), graph structure (e.g., trees, cycles, networks), features of graph structure (e.g., distance, connectivity, and planarity), and graph-based algorithms (e.g., the Dijkstra’s algorithm for finding the shortest path between two nodes), as well as using these algorithms to solve practical problems. The basic concepts in graph theory include node, edge, path, connectivity, and graph traversal [45][54]. In general, a graph can be used to model all kinds of scenarios due to its general-purpose, and expressive structure [42].
The main applications of graphs include the following. (a) Information visualisation. Graphs are more expressive than tables and texts, and more importantly, they are more intuitive and easier to understand. For example, the IFC schema expressed in UML (Unified Modelling Language, a language for graphically representing data models/standards [46][55]) is easier to understand than the text-based EXPRESS schema. In this sense, a graph is also helpful in understanding the structure of datasets in many fields, such as business, government, and science. (b) Data storage. Graph-based databases, such as neo4j, can use nodes and edges to store information. Data, especially relationships, stored in a graph database can be more efficiently retrieved than from a conventional relational database [47][49]. (c) Data analysis. Graph theory focuses on the modelling of networks of connected elements [43], and the connections between elements can be identified through networks. Graph algorithms have been widely used in computer science, information communication, and geospatial science. For example, Dijkstra’s algorithm is commonly used in pathfinding and navigation [48][49][56,57].
2.2. Graphs in BIM/GIS Data Integration
Graphs are being used in BIM/GIS integration, mainly at the application level, where BIM, GIS, and graphs were jointly used to solve problems such as indoor navigation and emergency response [35][50][51][52][53][35,58,59,60,61]. In these studies, the basic pattern is (a) extracting building information and geospatial information, (b) generating the geometric graphs (or geometric network), such as the multi-purpose geometric network model by Teo and Cho [53][61], and (c) applying the path finding algorithm.
At the data level, there is a smaller number of studies. These studies mainly convert BIM and GIS data into graphs, e.g., in the form of RDF triples or LPG. For example, Stouffs et al. [54][62] converted IFC and CityGML into graphs separately and connected them via a correlation graph, which is referred to as the Triple Graph Grammar (TGG), to convert IFC data into CityGML. Hor et al. [32] created a semantic graph database by converting CityGML and IFC into RDF, which was later converted into a property graph in neo4j. Malinverni et al. [39] investigated the conversion of CityGML into RDF.
Even though only a limited number of studies are directly dedicated to BIM/GIS data integration using a graph, there are more studies available on converting IFC into graphs, which can contribute to the first steps of BIM/GIS data integration [24]. The whole process of BIM/GIS data integration is presented in Figure 34, as well as the potential contribution of graphs in this process. The next section is about converting IFC into graphs.
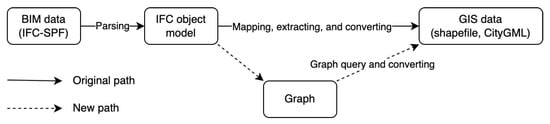
Figure 34.
Graph contributing to BIM/GIS data integration.