Phyto products are widely used in natural products, such as medicines, cosmetics or as so-called “superfoods”. However, the exact metabolite composition of these products is still unknown, due to the time-consuming process of metabolite identification. Non-target screening by LC-HRMS/MS could be a technique to overcome these problems with its capacity to identify compounds based on their retention time, accurate mass and fragmentation pattern. In particular, the use of computational tools, such as deconvolution algorithms, retention time prediction, in silico fragmentation and sophisticated search algorithms, for comparison of spectra similarity with mass spectral databases facilitate researchers to conduct a more exhaustive profiling of metabolic contents.
- non-target screening
- LC-HRMS/MS
- metabolites
- annotation
1. Introduction
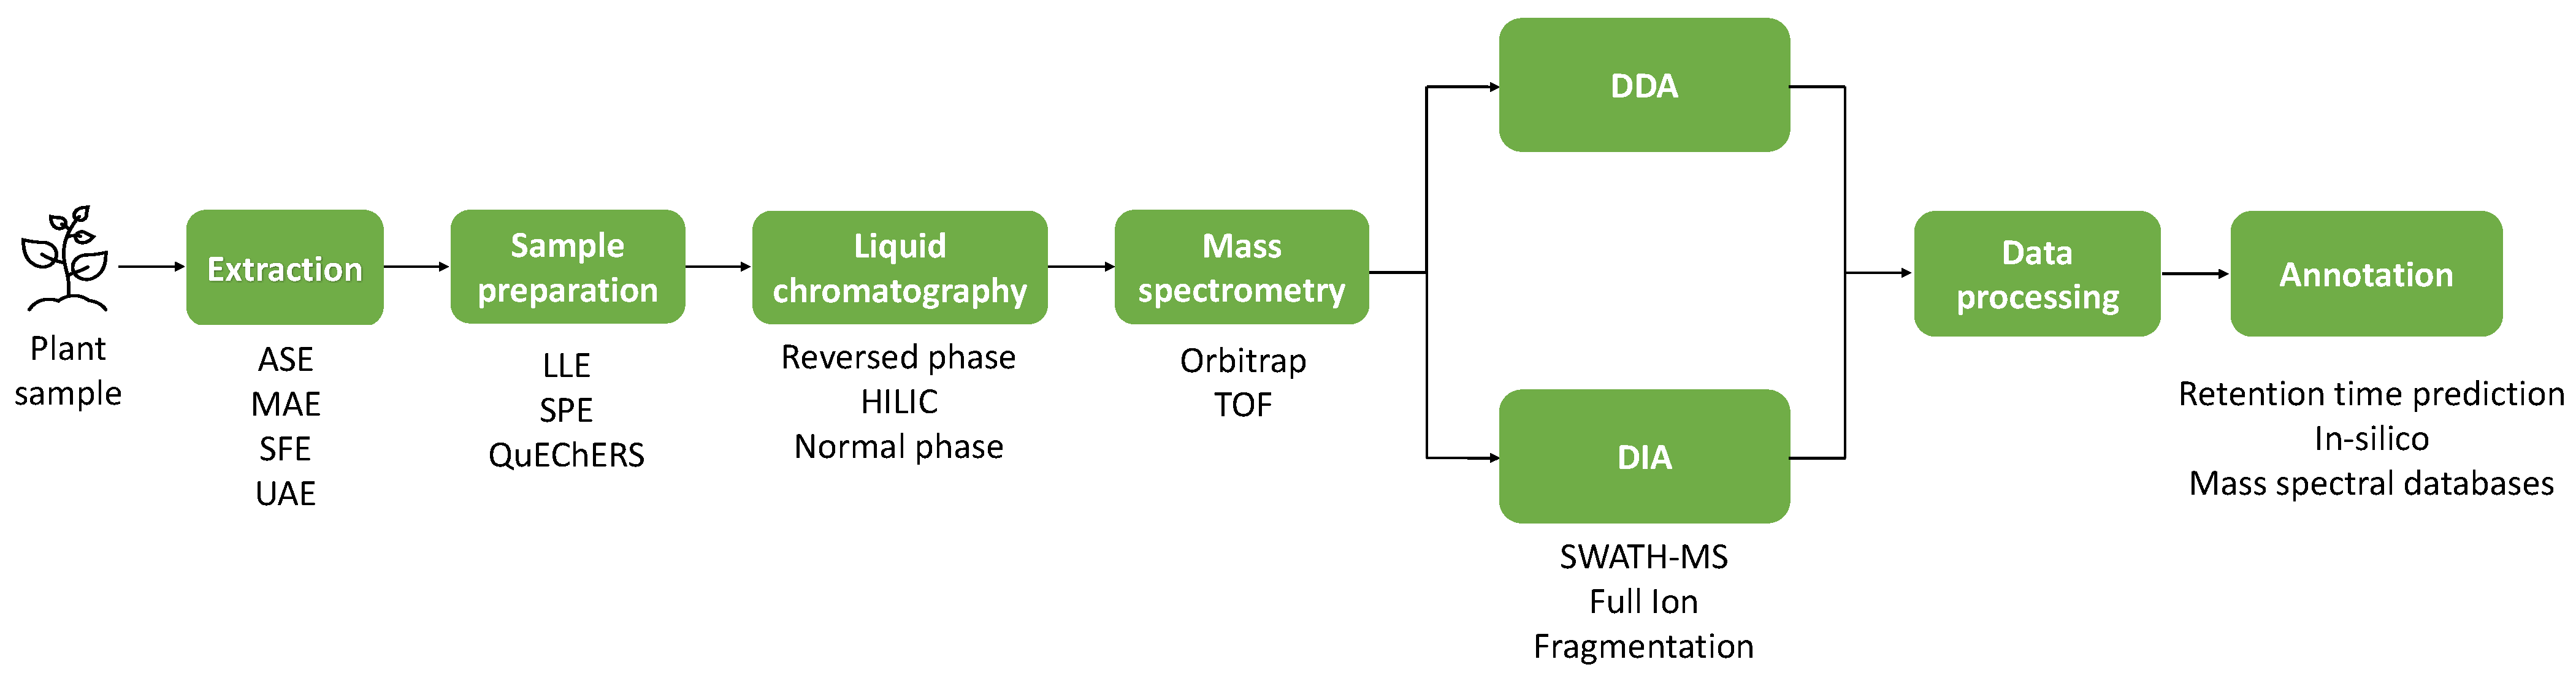
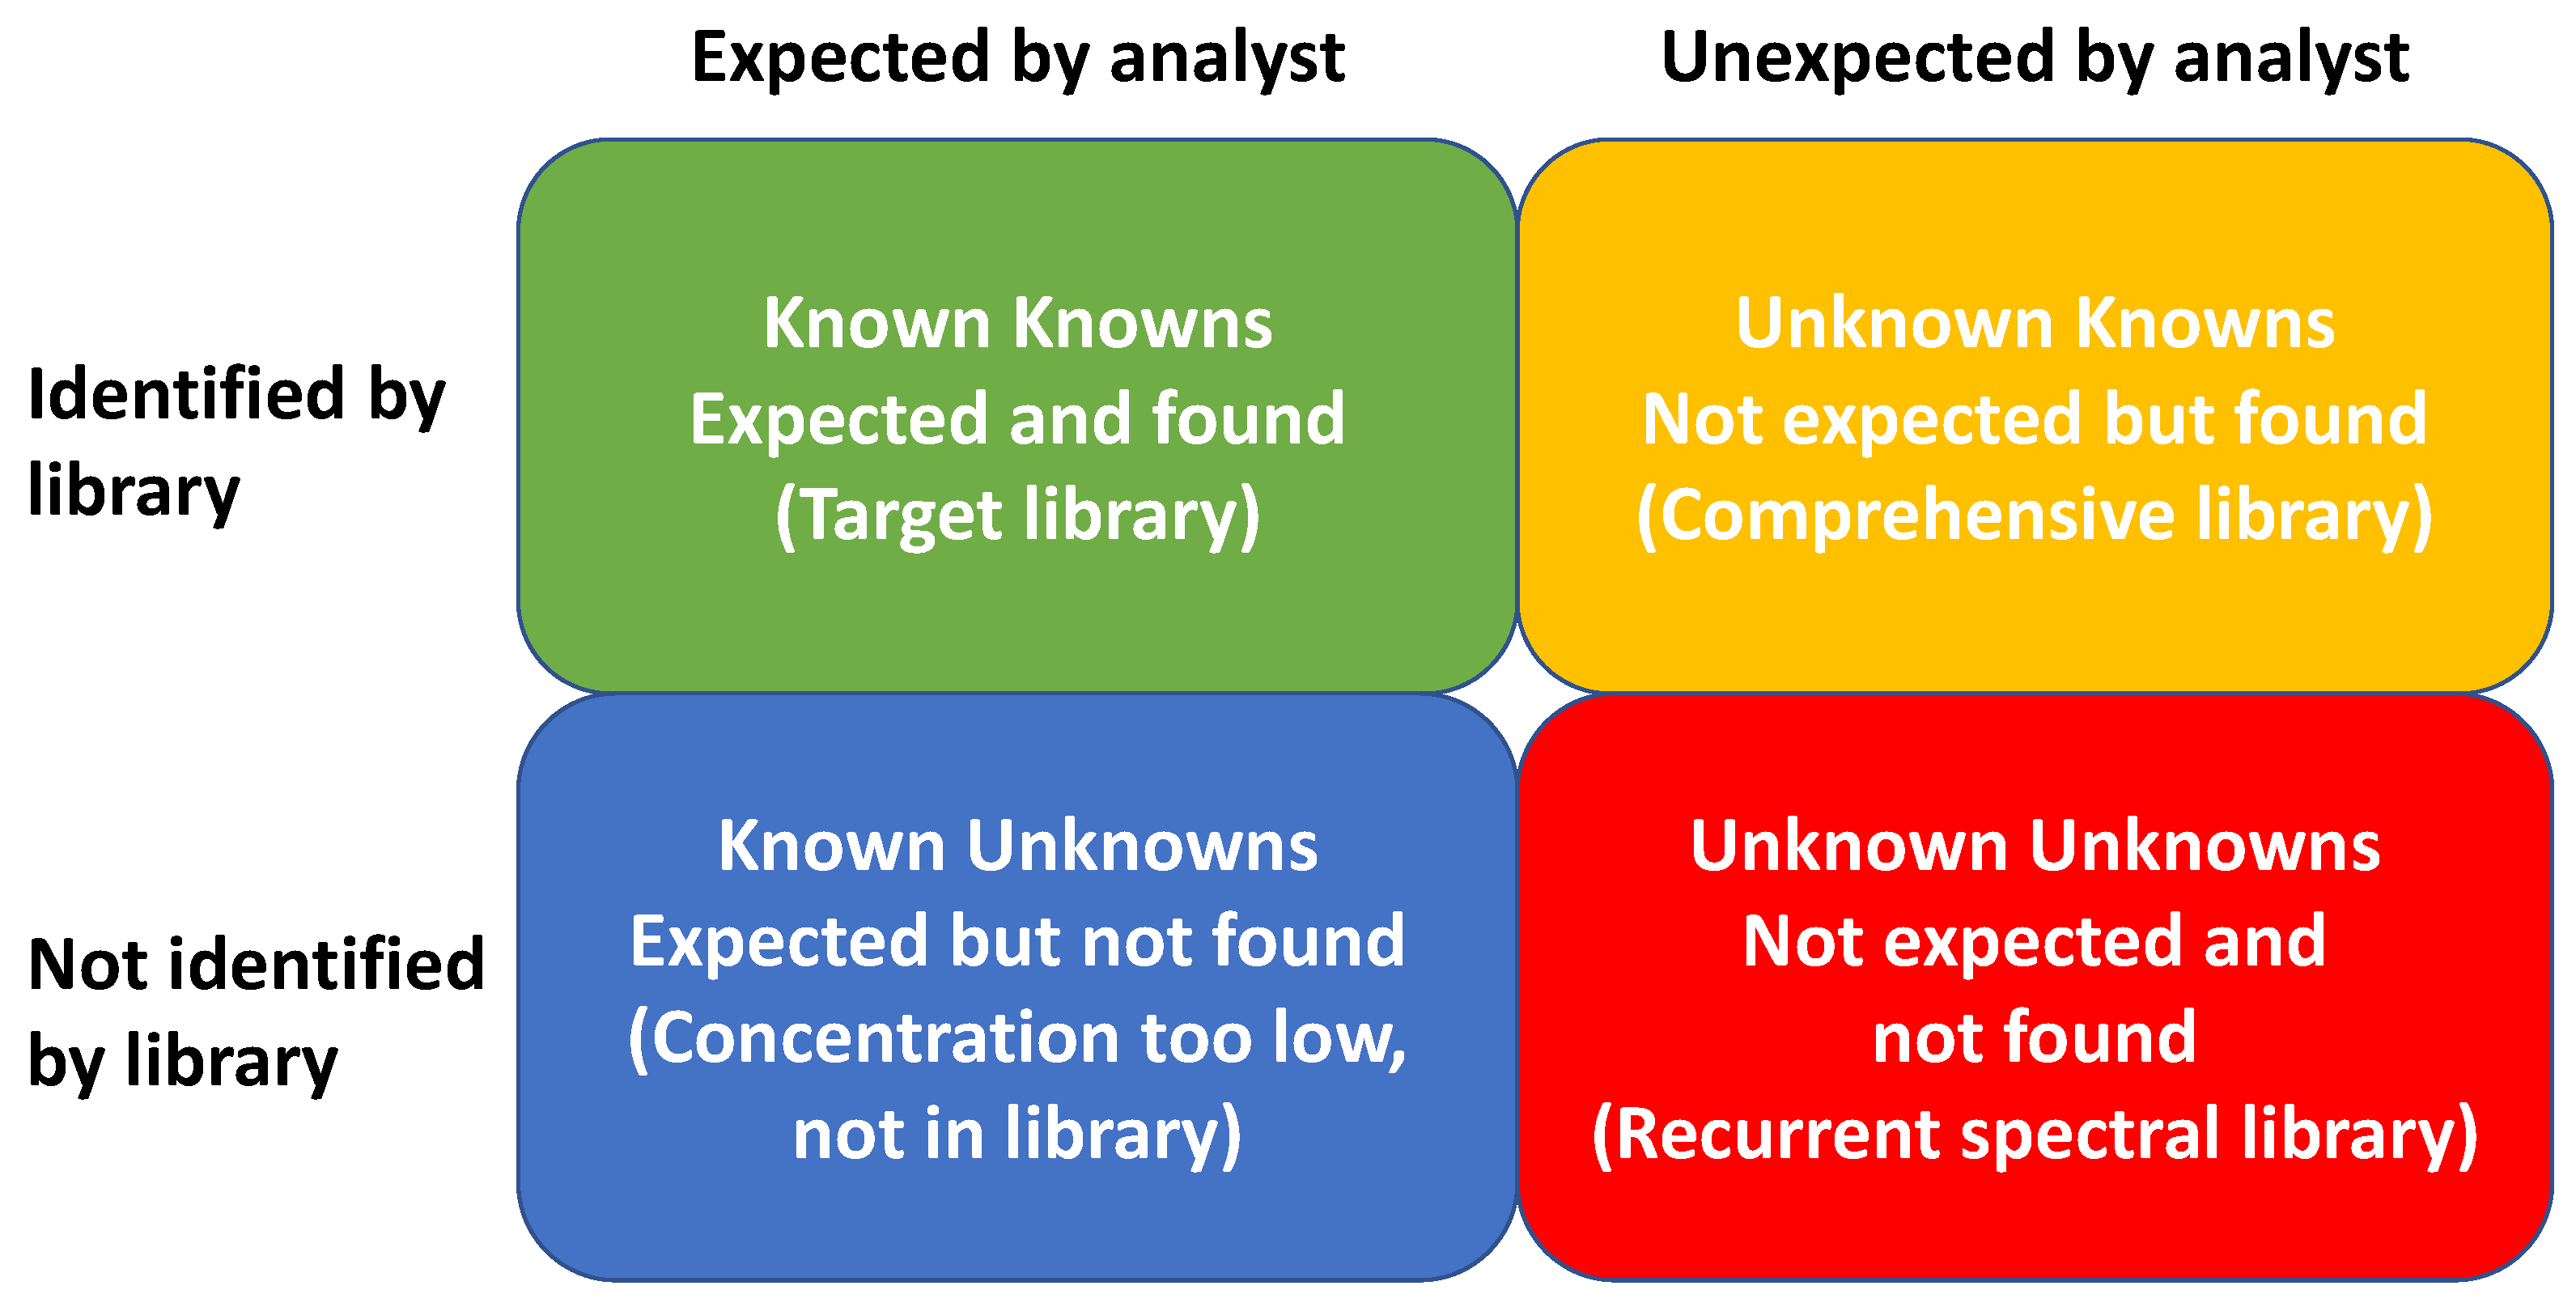
2. Applications
References
- New Hope Network. Natural Retail Market Size and Stats|Market Overview. 2020. Available online: https://www.newhope.com/market-data-and-analysis/market-overview-2020-natural-retail-market-size-and-stats (accessed on 13 July 2021).
- Bolaños, P.P.; Romero-González, R.; Frenich, A.G.; Vidal, J.L.M. Application of hollow fibre liquid phase microextraction for the multiresidue determination of pesticides in alcoholic beverages by ultra-high pressure liquid chromatography coupled to tandem mass spectrometry. J. Chromatogr. A 2008, 1208, 16–24. https://doi.org/10.1016/j.chroma.2008.08.059.
- Paar, M. On the History of Austrian Wine Law from 1907 to 1985. JEHL 2019, 10, 15–25.
- Daughton, C.G. The Matthew Effect and widely prescribed pharmaceuticals lacking environmental monitoring: Case study of an exposure-assessment vulnerability. Sci. Total Environ. 2014, 466, 315–325. https://doi.org/10.1016/j.scitotenv.2013.06.111.
- Stein, S. Mass spectral reference libraries: An ever-expanding resource for chemical identification. Anal. Chem. 2012, 84, 7274–7282. https://doi.org/10.1021/ac301205z.
- Lachenmeier, D.W.; Humpfer, E.; Fang, F.; Schütz, B.; Dvortsak, P.; Sproll, C.; Spraul, M. NMR-spectroscopy for nontargeted screening and simultaneous quantification of health-relevant compounds in foods: The example of melamine. J. Agric. Food Chem. 2009, 57, 7194–7199. https://doi.org/10.1021/jf902038j
- Musio, B.; Todisco, S.; Antonicelli, M.; Garino, C.; Arlorio, M.; Mastrorilli, P.; Latronico, M.; Gallo, V. Non-Targeted NMR Method to Assess the Authenticity of Saffron and Trace the Agronomic Practices Applied for Its Production. Appl. Sci. 2022, 12, 2583. https://doi.org/10.3390/app12052583.
- Remane, D.; Wissenbach, D.K.; Peters, F.T. Recent advances of liquid chromatography-(tandem) mass spectrometry in clini-cal and forensic toxicology—An update. Clin. Biochem. 2016, 49, 1051–1071. https://doi.org/10.1016/j.clinbiochem.2016.07.010.
- Oberacher, H.; Arnhard, K. Compound identification in forensic toxicological analysis with untargeted LC-MS-based tech-niques. Bioanalysis 2015, 7, 2825–2840. https://doi.org/10.4155/bio.15.193.
- Vijlder, T. de; Valkenborg, D.; Lemière, F.; Romijn, E.P.; Laukens, K.; Cuyckens, F. A tutorial in small molecule identification via electrospray ionization-mass spectrometry: The practical art of structural elucidation. Mass Spectrom. Rev. 2018, 37, 607–629. https://doi.org/10.1002/mas.21551.
- Milman, B.L.; Zhurkovich, I.K. The chemical space for non-target analysis. TrAC Trends Anal. Chem. 2017, 97, 179–187. https://doi.org/10.1016/j.trac.2017.09.013.
- Milman, B.L.; Zhurkovich, I.K. Mass spectral libraries: A statistical review of the visible use. TrAC Trends Anal. Chem. 2016, 80, 636–640. https://doi.org/10.1016/j.trac.2016.04.024.
- Bade, R.; Causanilles, A.; Emke, E.; Bijlsma, L.; Sancho, J.V.; Hernandez, F.; de Voogt, P. Facilitating high resolution mass spectrometry data processing for screening of environmental water samples: An evaluation of two deconvolution tools. Sci. Total Environ. 2016, 569, 434–441. https://doi.org/10.1016/j.scitotenv.2016.06.162.
- Bader, T.; Schulz, W.; Kümmerer, K.; Winzenbacher, R. LC-HRMS Data Processing Strategy for Reliable Sample Comparison Exemplified by the Assessment of Water Treatment Processes. Anal. Chem. 2017, 89, 13219–13226. https://doi.org/10.1021/acs.analchem.7b03037.
- Hollender, J.; Schymanski, E.L.; Singer, H.P.; Ferguson, P.L. Nontarget Screening with High Resolution Mass Spectrometry in the Environment: Ready to Go? Environ. Sci. Technol. 2017, 51, 11505–11512. https://doi.org/10.1021/acs.est.7b02184.
- Schymanski, E.L.; Singer, H.P.; Slobodnik, J.; Ipolyi, I.M.; Oswald, P.; Krauss, M.; Schulze, T.; Haglund, P.; Letzel, T.; Grosse, S.; et al. Non-target screening with high-resolution mass spectrometry: Critical review using a collaborative trial on water analysis. Anal. Bioanal. Chem. 2015, 407, 6237–6255. https://doi.org/10.1007/s00216-015-8681-7.
- Fischer, K.; Fries, E.; Körner, W.; Schmalz, C.; Zwiener, C. New developments in the trace analysis of organic water pollu-tants. Appl. Microbiol. Biotechnol. 2012, 94, 11–28. https://doi.org/10.1007/s00253-012-3929-z.
- Burgard, D.A.; Banta-Green, C.; Field, J.A. Working upstream: How far can you go with sewage-based drug epidemiology? Environ. Sci. Technol. 2014, 48, 1362–1368. https://doi.org/10.1021/es4044648.
- Urbas, A.; Schoenberger, T.; Corbett, C.; Lippa, K.; Rudolphi, F.; Robien, W. NPS Data Hub: A web-based community driven analytical data repository for new psychoactive substances. Forensic Chem. 2018, 9, 76–81. https://doi.org/10.1016/j.forc.2018.05.003.
- Causanilles, A.; Kinyua, J.; Ruttkies, C.; van Nuijs, A.L.N.; Emke, E.; Covaci, A.; Voogt, P. de. Qualitative screening for new psychoactive substances in wastewater collected during a city festival using liquid chromatography coupled to high-resolution mass spectrometry. Chemosphere 2017, 184, 1186–1193. https://doi.org/10.1016/j.chemosphere.2017.06.101.
- Jorge, T.F.; Rodrigues, J.A.; Caldana, C.; Schmidt, R.; van Dongen, J.T.; Thomas-Oates, J.; António, C. Mass spectrome-try-based plant metabolomics: Metabolite responses to abiotic stress. Mass Spectrom. Rev. 2016, 35, 620–649. https://doi.org/10.1002/mas.21449.
- Bletsou, A.A.; Jeon, J.; Hollender, J.; Archontaki, E.; Thomaidis, N.S. Targeted and non-targeted liquid chromatography-mass spectrometric workflows for identification of transformation products of emerging pollutants in the aquatic environment. TrAC Trends Anal. Chem. 2015, 66, 32–44. https://doi.org/10.1016/j.trac.2014.11.009.
- Chaleckis, R.; Meister, I.; Zhang, P.; Wheelock, C.E. Challenges, progress and promises of metabolite annotation for LC-MS-based metabolomics. Curr. Opin. Biotechnol. 2019, 55, 44–50. https://doi.org/10.1016/j.copbio.2018.07.010.
- Hernández, F.; Sancho, J.V.; Ibáñez, M.; Grimalt, S. Investigation of pesticide metabolites in food and water by LC-TOF-MS. TrAC Trends Anal. Chem. 2008, 27, 862–872. https://doi.org/10.1016/j.trac.2008.08.011.
- Pérez-Ortega, P.; Lara-Ortega, F.J.; Gilbert-López, B.; Moreno-González, D.; García-Reyes, J.F.; Molina-Díaz, A. Screening of Over 600 Pesticides, Veterinary Drugs, Food-Packaging Contaminants, Mycotoxins, and Other Chemicals in Food by Ul-tra-High Performance Liquid Chromatography Quadrupole Time-of-Flight Mass Spectrometry (UHPLC-QTOFMS). Food Anal. Methods 2017, 10, 1216–1244.
- Kalogiouri, N.P.; Aalizadeh, R.; Dasenaki, M.E.; Thomaidis, N.S. Application of High Resolution Mass Spectrometric meth-ods coupled with chemometric techniques in olive oil authenticity studies—A review. Anal. Chim. Acta 2020, 1134, 150–173. https://doi.org/10.1016/j.aca.2020.07.029.
- Righetti, L.; Paglia, G.; Galaverna, G.; Dall Asta, C. Recent Advances and Future Challenges in Modified Mycotoxin Analysis: Why HRMS Has Become a Key Instrument in Food Contaminant Research. Toxins 2016, 8, 361. https://doi.org/10.3390/toxins8120361.
- Carlier, J.; Guitton, J.; Bévalot, F.; Fanton, L.; Gaillard, Y. The principal toxic glycosidic steroids in Cerbera manghas L. seeds: Identification of cerberin, neriifolin, tanghinin and deacetyltanghinin by UHPLC-HRMS/MS, quantification by UHPLC-PDA-MS. J. Chromatogr. B Analyt. Technol. Biomed. Life Sci. 2014, 962, 1–8. https://doi.org/10.1016/j.jchromb.2014.05.014.
- Pérez-Ortega, P.; Lara-Ortega, F.J.; Gilbert-López, B.; Moreno-González, D.; García-Reyes, J.F.; Molina-Díaz, A. Screening of Over 600 Pesticides, Veterinary Drugs, Food-Packaging Contaminants, Mycotoxins, and Other Chemicals in Food by Ul-tra-High Performance Liquid Chromatography Quadrupole Time-of-Flight Mass Spectrometry (UHPLC-QTOFMS). Food Anal. Methods 2017, 10, 1216–1244.
- Kunzelmann, M.; Winter, M.; Åberg, M.; Hellenäs, K.-E.; Rosén, J. Non-targeted analysis of unexpected food contaminants using LC-HRMS. Anal. Bioanal. Chem. 2018, 410, 5593–5602. https://doi.org/10.1007/s00216-018-1028-4.
- Nagatomi, Y.; Yoshioka, T.; Yanagisawa, M.; Uyama, A.; Mochizuki, N. Simultaneous LC-MS/MS analysis of glyphosate, glufosinate, and their metabolic products in beer, barley tea, and their ingredients. Biosci. Biotechnol. Biochem. 2013, 77, 2218–2221. https://doi.org/10.1271/bbb.130433.
- Anderson, H.E.; Santos, I.C.; Hildenbrand, Z.L.; Schug, K.A. A review of the analytical methods used for beer ingredient and finished product analysis and quality control. Anal. Chim. Acta 2019, 1085, 1–20. https://doi.org/10.1016/j.aca.2019.07.061.
- Inoue, T.; Nagatomi, Y.; Suga, K.; Uyama, A.; Mochizuki, N. Fate of pesticides during beer brewing. J. Agric. Food Chem. 2011, 59, 3857–3868. https://doi.org/10.1021/jf104421q.
- Pinu, F. Grape and Wine Metabolomics to Develop New Insights Using Untargeted and Targeted Approaches. Fermentation 2018, 4, 92. https://doi.org/10.3390/fermentation4040092.
- Ruocco, S.; Perenzoni, D.; Angeli, A.; Stefanini, M.; Rühl, E.; Patz, C.-D.; Mattivi, F.; Rauhut, D.; Vrhovsek, U. Metabolite profiling of wines made from disease-tolerant varieties. Eur. Food Res. Technol. 2019, 245, 2039–2052. https://doi.org/10.1007/s00217-019-03314-z.
- Arbulu, M.; Sampedro, M.C.; Gómez-Caballero, A.; Goicolea, M.A.; Barrio, R.J. Untargeted metabolomic analysis using liquid chromatography quadrupole time-of-flight mass spectrometry for non-volatile profiling of wines. Anal. Chim. Acta 2015, 858, 32–41. https://doi.org/10.1016/j.aca.2014.12.028.
- Arapitsas, P.; Ugliano, M.; Perenzoni, D.; Angeli, A.; Pangrazzi, P.; Mattivi, F. Wine metabolomics reveals new sulfonated products in bottled white wines, promoted by small amounts of oxygen. J. Chromatogr. A 2016, 1429, 155–165. https://doi.org/10.1016/j.chroma.2015.12.010.
- Díaz, R.; Gallart-Ayala, H.; Sancho, J.V.; Nuñez, O.; Zamora, T.; Martins, C.P.B.; Hernández, F.; Hernández-Cassou, S.; Saurina, J.; Checa, A. Told through the wine: A liquid chromatography-mass spectrometry interplatform comparison reveals the influence of the global approach on the final annotated metabolites in non-targeted metabolomics. J. Chromatogr. A 2016, 1433, 90–97. https://doi.org/10.1016/j.chroma.2016.01.010.
- Li, X.; Zhang, X.; Ye, L.; Kang, Z.; Jia, D.; Yang, L.; Zhang, B. LC-MS-Based Metabolomic Approach Revealed the Signifi-cantly Different Metabolic Profiles of Five Commercial Truffle Species. Front. Microbiol. 2019, 10, 2227. https://doi.org/10.3389/fmicb.2019.02227.
- Spínola, V.; Pinto, J.; Castilho, P.C. Identification and quantification of phenolic compounds of selected fruits from Madeira Island by HPLC-DAD-ESI-MS(n) and screening for their antioxidant activity. Food Chem. 2015, 173, 14–30. https://doi.org/10.1016/j.foodchem.2014.09.163.
- Kolniak-Ostek, J. Identification and quantification of polyphenolic compounds in ten pear cultivars by UPLC-PDA-Q/TOF-MS. J. Food Compos. Anal. 2016, 49, 65–77. https://doi.org/10.1016/j.jfca.2016.04.004.
- Simirgiotis, M.J.; Bórquez, J.; Schmeda-Hirschmann, G. Antioxidant capacity, polyphenolic content and tandem HPLC-DAD-ESI/MS profiling of phenolic compounds from the South American berries Luma apiculata and L. chequén. Food Chem. 2013, 139, 289–299. https://doi.org/10.1016/j.foodchem.2013.01.089.
- Bastos, K.X.; Dias, C.N.; Nascimento, Y.M.; Da Silva, M.S.; Langassner, S.M.Z.; Wessjohann, L.A.; Tavares, J.F. Identification of Phenolic Compounds from Hancornia speciosa (Apocynaceae) Leaves by UHPLC Orbitrap-HRMS. Molecules 2017, 22, 143. https://doi.org/10.3390/molecules22010143.
- Bertin, R.L.; Gonzaga, L.V.; Da Borges, G.S.C.; Azevedo, M.S.; Maltez, H.F.; Heller, M.; Micke, G.A.; Tavares, L.B.B.; Fett, R. Nutrient composition and, identification/quantification of major phenolic compounds in Sarcocornia ambigua (Amaran-thaceae) using HPLC–ESI-MS/MS. Food Res. Int. 2014, 55, 404–411. https://doi.org/10.1016/j.foodres.2013.11.036.
- Lin, L.-Z.; Sun, J.; Chen, P.; Monagas, M.J.; Harnly, J.M. UHPLC-PDA-ESI/HRMSn profiling method to identify and quantify oligomeric proanthocyanidins in plant products. J. Agric. Food Chem. 2014, 62, 9387–9400. https://doi.org/10.1021/jf501011y.
- Abu-Reidah, I.M.; Ali-Shtayeh, M.S.; Jamous, R.M.; Arráez-Román, D.; Segura-Carretero, A. HPLC-DAD-ESI-MS/MS screening of bioactive components from Rhus coriaria L. (Sumac) fruits. Food Chem. 2015, 166, 179–191. https://doi.org/10.1016/j.foodchem.2014.06.011.
- Regazzoni, L.; Arlandini, E.; Garzon, D.; Santagati, N.A.; Beretta, G.; Maffei Facino, R. A rapid profiling of gallotannins and flavonoids of the aqueous extract of Rhus coriaria L. by flow injection analysis with high-resolution mass spectrometry as-sisted with database searching. J. Pharm. Biomed. Anal. 2013, 72, 202–207. https://doi.org/10.1016/j.jpba.2012.08.017.
- El Sayed, A.M.; Ezzat, S.M.; El Naggar, M.M.; El Hawary, S.S. In vivo diabetic wound healing effect and HPLC–DAD–ESI–MS/MS profiling of the methanol extracts of eight Aloe species. Rev. Bras. Farmacogn. 2016, 26, 352–362. https://doi.org/10.1016/j.bjp.2016.01.009.
- Meng, X.; Bai, H.; Guo, T.; Niu, Z.; Ma, Q. Broad screening of illicit ingredients in cosmetics using ultra-high-performance liquid chromatography-hybrid quadrupole-Orbitrap mass spectrometry with customized accurate-mass database and mass spectral library. J. Chromatogr. A 2017, 1528, 61–74. https://doi.org/10.1016/j.chroma.2017.11.004.