Along with the rise of cloud and edge computing has come a plethora of solutions that regard the deployment and operation of different types of applications in such environments. Infrastructure as a service (IaaS) providers offer a number of different hardware solutions to facilitate the needs of the growing number of distributed applications. It is critical in this landscape to be able to navigate and discover the best-suited infrastructure solution for the applications, taking into account not only the cost of operation but also the quality of service (QoS) required for any given application. The proposed solution has two main research developments: (a) the creation and optimisation of multidimensional vectors that represent the hardware usage profiles of an application, and (b) the assimilation of a machine learning classification algorithm, in order to create a system that can create hardware-agnostic profiles of a vast variety of containerised applications in terms of nature and computational needs and classify them to known benchmarks. Given that benchmarks are widely used to evaluate a system’s hardware capabilities, having a system that can help select which benchmarks best correlate to a given application can help an IaaS provider make a more informed decision or recommendation on the hardware solution, not in a broad sense, but based on the needs of a specific application.
- application profiling and classification
- containerised applications
- machine learning classification methods
- supervised learning
1. Introduction
-
managing the application;
-
managing, selecting, and recommending the resources; and
-
managing the cost of operation.
2. Application Profiling System Architecture
The application profiling system is developed by using the Node RED flow-based programming framework (https://nodered.org/, accessed on 15 November 2022). This framework has a great variety of different nodes which help with the communication of different components in order to obtain the functionality needed. In addition, given the heterogeneity of hardware and APIs of the cloud-edge environments, it provides the necessary communication nodes for data exchange and manipulation of external resources. Application profiling system can function with different container environments (Docker, Kubernetes), but for research work conducted for thereis paper the container environment used is Docker. Containerised environments are proven to produce little to no overhead in the performance of the applications [9][21], thus minimising the interferences produced by the operating system used. Furthermore, the internal tools provided by the container environment engine are consistent and precise, reducing the usage of other external tools for metric collection. The application profiling system has two major components in order to work—the profiling component and the model trainer component. The profiling component is responsible for the creation of the multidimensional vector that represents the profile of the resource usage of a benchmark or application. As far as the profiling component is concerned, there are three main processes in the form of Node RED flows (as depicted in Figure 12) that are performed in order to create the profile, and these flows have the following functions.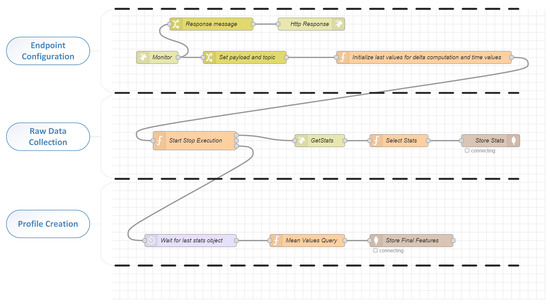
-
Metric endpoint configuration: In order to communicate with the appropriate Docker command line interface (CLI) and collect the Docker metrics for the container that runs a benchmark or an application, the appropriate configuration must be performed. The information needed for a new profile to start is the endpoint of the Docker machine and the container ID. In the case of benchmark profiling, the name of the benchmark as well as the workload are also needed in order to store the profile for training the model. In the case of application profiling, no extra information is needed.
-
Raw data collection and storage: After the successful communication with the Docker CLI, the application profiler collects the metrics for the resource usage of the specific container (Docker produces these metrics and delivers them to the users using the Docker stats service). These metrics are stored temporarily in a collection in the database. Some of the temporarily stored metrics will be used without any other computation, directly for the profile creations; others are stored in order to produce metrics that require more computations, such as mean values and deviations of specific metrics.
-
Profile creation and storage: When the metric extraction is finalised, then the temporarily stored metrics are retrieved in order to compute all the features of the profile (vector). In the case the profile created is from an execution of a benchmark; then it is stored in a specific collection in the database in order to be used for the model training and evaluation. If the profile is extracted from a running application, then it is sent to the classification model to be classified.
-
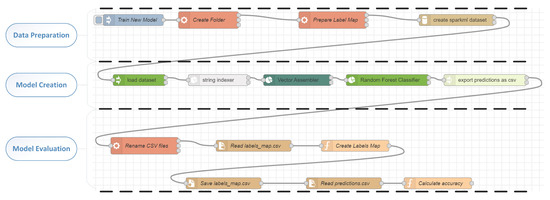
Data preparation: This process is in charge of all the first steps for data preparation and transformation. More specifically the appropriate folders are created to store the new model and the preparation of the new classes of benchmarks are initialised. After the data preparation, this process is able to produce the sparkML (https://spark.apache.org/docs/1.2.2/mllib-guide.html, accessed on 10 December 2021) dataset that will be fed to the model-creation process.
-
Model creation: This part of the flow facilitates the process of creating the actual classification model. The sparkML dataset is loaded, and the vectors representing the benchmarks are assembled attaching to them also the label which represents the benchmark category and workload. After the creation of the model, the results of the testing data set are exported as CSV in order to assess the accuracy of the model.
-
Model evaluation: This process is responsible for the accuracy evaluation of the produced model. It takes all the labels of the testing dataset produced by the model and checks them against the actual labels (benchmark and workload). If the model does not produce accuracy greater than a specified percentage, then the model is discarded.