Conversion between mechanical energy and electrical energy is critically important in industrial applications. Piezoelectric materials are unique for their ability in electric–mechanical transduction by applications of piezoelectric transducers that are usually spherical, cylindrical, or schistose. This topic review presents the most recent development of a piezoelectric transducers energy conversion network.
- network model of piezoelectric transducers
- piezoelectric spherical transducer
- piezoelectric cylindrical transducer
- center-frequency
- petroleum acoustical-logging
- experimental-measurement
Introduction
Piezoelectric materials are unique for their ability in electric–mechanical transduction, which provides decent conversions between mechanical energy and electrical energy. Piezoelectric transducers have been constructed extensively for industrial applications, e.g., in electrical, biomedical, and geophysical engineering [1]; and for defined applications with smaller geometric dimensions, lower noise level, and reduced power consumption [2, 3]. Detailed applications include mobile and internet communications [4, 5], underground mineral-resources exploration [6], measurement of in situ stresses of underground rock formation [7], inspection of mechanical properties of concrete [8, 9], intravascular ultrasound [10], acoustic lateral displacement verification [11], polarization state inspection of waves inside isotropic and anisotropic media [12, 13], wave energy devices [14], nondestructive detection [15, 16, 17], medical imaging [18], biometric recognition [19], implantable microdevices [20], and rangefinders [21], and more.
The most common geometric structures of acoustic piezoelectric transducers are spherical, cylindrical, and schistose. Thin-shell spherical transducers have been popularly used in prototype testing; thin-cylindrical transducers have been widely used in petroleum logging tools [22, 23], to achieve electric and acoustic energy conversion.
Network modeling
Based on the principle of linear superposition for multiple frequency components, a transducer can be modeled through a network of parallel-connected equivalent-circuits [23-27], as shown in Figure 1. The transient response process is assumed to be a zero-state response. Upon excitation from an electric signal, the residue theorem applied to the impulse response yields three physical modes, i.e., over-damping, critical-damping, and under-damping (oscillatory).
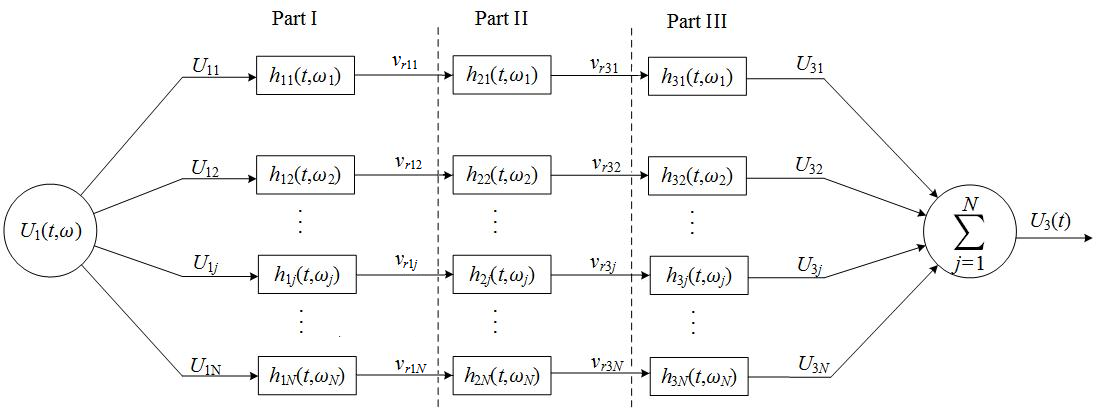 Figure 1 | Schematic presentation of a transmission network in an acoustic-measurement process, where N is the total number of sine frequency components of a driving electric-signal; U1j is the jth frequency component; vr1j is the jth frequency component of the vibration velocity of the transducer surface; vr3j is the jth frequency component in acoustic-signal arriving at the receiver; U3j is the jth frequency component of the measured electric-signal created through acoustic and electric conversion.
From the physical properties of the piezoelectric materials, the oscillatory mode is the only physically meaningful solution,
 , (1)
, (1)
where A3, B3, α1, β1, ω1, and φ1 are the physical parameters in the oscillatory mode.
With an excitation of the transducers, the signal can be expressed as a Fourier series with respect to the frequency components. Following the network in Figure 1, the electric to acoustic conversion is processed in part I and the acoustic to electric conversion is achieved in part III.
Spherical thin-shell transducers
Figure 2 shows the geometric structure of a thin-shell piezoelectric spherical transducer. The sphere has an average radius rb, a thin-shell thickness lt, and a polarization in the radial direction. The electrodes are connected to the inner and outer surfaces.
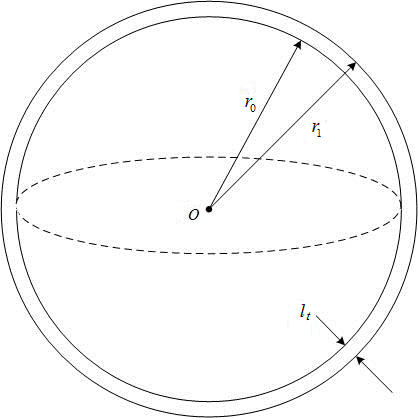 Figure 2 | A schematic presentation of a thin-spherical shell piezoelectric transducer, where the spherical radius is much larger than the thickness of the shell, which yields approximately
  , where
  .
.
The converted waves from the network model are comparable to experimental measurements by Fa, et al. [23-27]. Figure 3 presents the sample results of waveform and amplitude spectra at the receiving electric-terminals, comparing the measured signals to the network model. The measured amplitude spectrum has a slight shift to the lower frequency, presenting a percent error of 0.77%. We believe that this small discrepancy is the result of our assumption on the transient medium, which is assumed to be ideal. Realistically, water has a certain degree of viscosity that may lead to attenuation of the acoustic-signal in the propagation process. A minor correction may be used to reduce this percent error. Overall, the calculated results from the network model are in good agreement with that of the experimental observation.
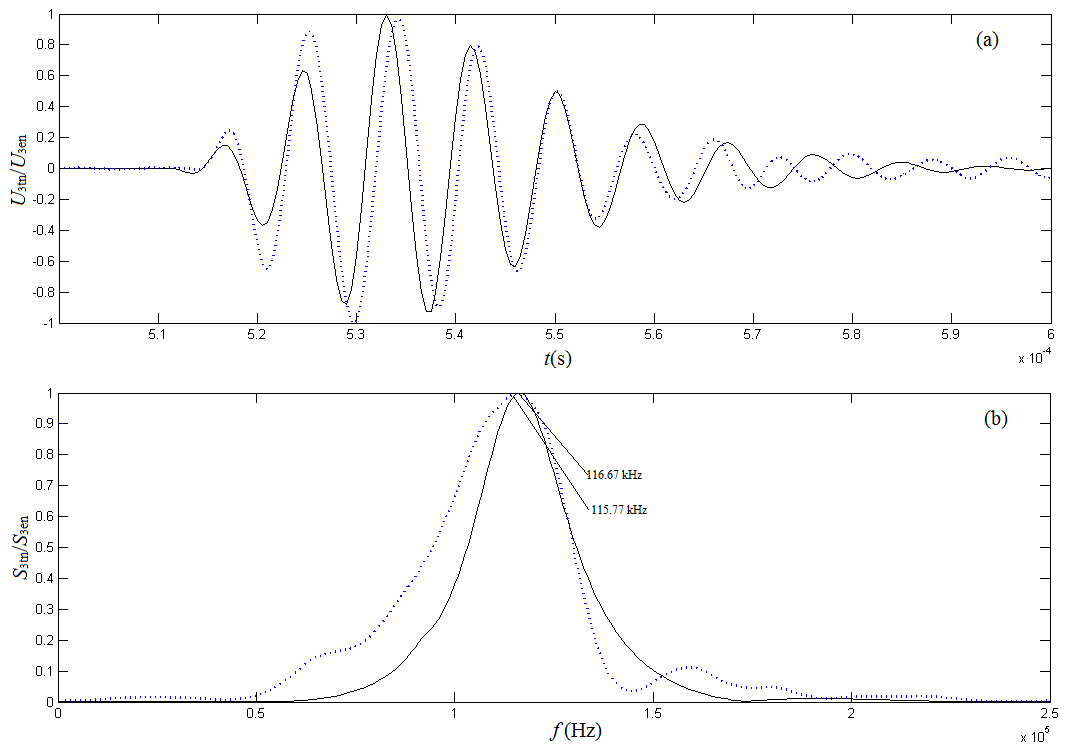 Figure 3 | A normalized sample of the electric-signals at the receiver-transducer of a spherical shin-shell transducer, where the solid lines are from the network model and the dotted-lines are from the experimental measurement: (a) the waveform; (b) the amplitude spectrum.
Cylindrical thin-shell transducers
Similar to the case of a thin-shell spherical transducer, the transient response [23, 25] of cylindrical transducers for the excited driving-voltage signal can be described by the parallel-connected equivalent circuit network, as shown in Figure 1.
Let us consider a thin-shell piezoelectric cylindrical transducer, as shown in Figure 4. It has an average radius ρ0 and a shell thickness lt , polarized in the radial direction. The electrodes were connected to the inner and outer surfaces. From axis symmetry, the tangential and axial stresses are zero.
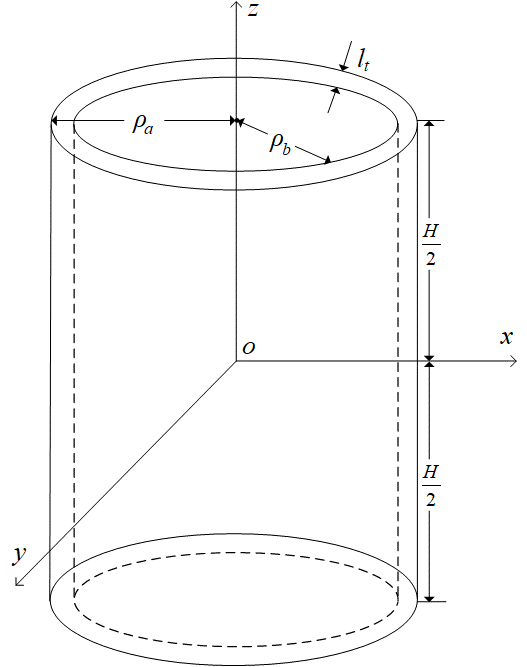 Figure 4 | The geometric structure of a thin-shell cylindrical piezoelectric transducer, where the radius of the cylinder is much larger than its thickness,
  , then
  and
and  .
.
The radiation directivity of a cylindrical transducer is important in practical applications. A sample calculated radiation directivity of a cylindrical transducer is shown in Figure 5. It shows that the acoustic energy radiated by the transducer is more centralized in the normal direction with the increased height of the thin cylindrical transducer.
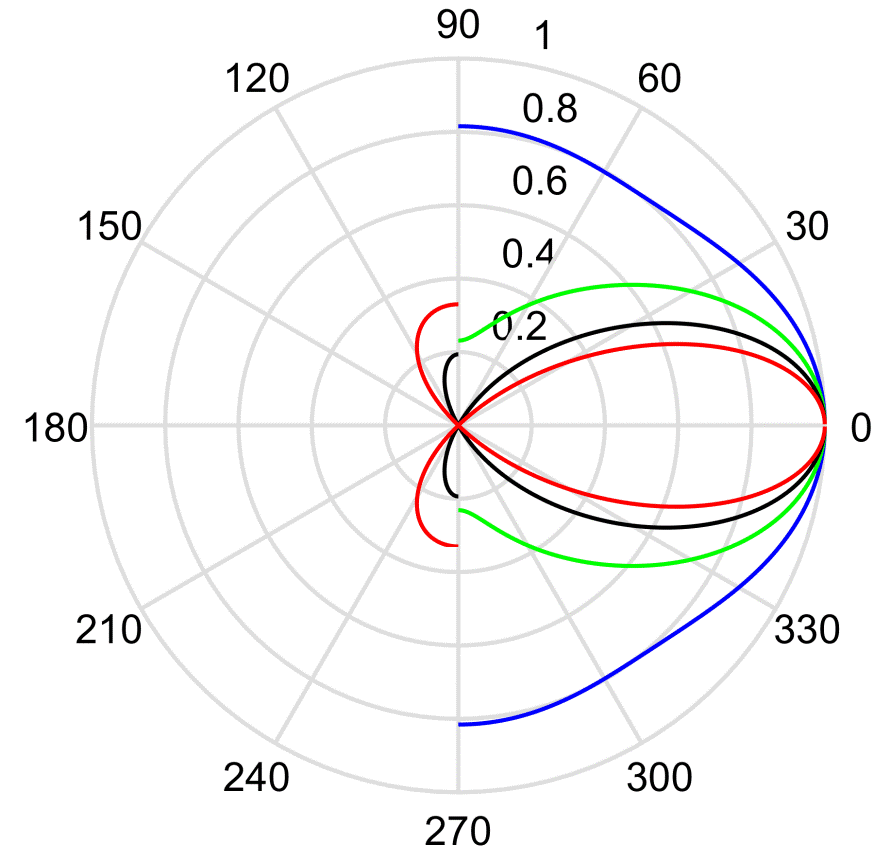 Figure 5 | The directivity of a thin-shell cylindrical transducer with varying height, where the average radius is
  = 20.50 mm; the red, black, green, and blue colors indicate the directivities of the cylinders with the height H = 40 mm, 60 mm, 80 mm, and 100 mm, respectively.
Applying a gated sinusoidal driving electric signal to the source transducer, Figure 6 shows the calculated cumulative output signals from the network model, compared to experimental observations. As in the case of spherical transducers, the theoretical model network calculation is in good agreement with the experimental measurement.
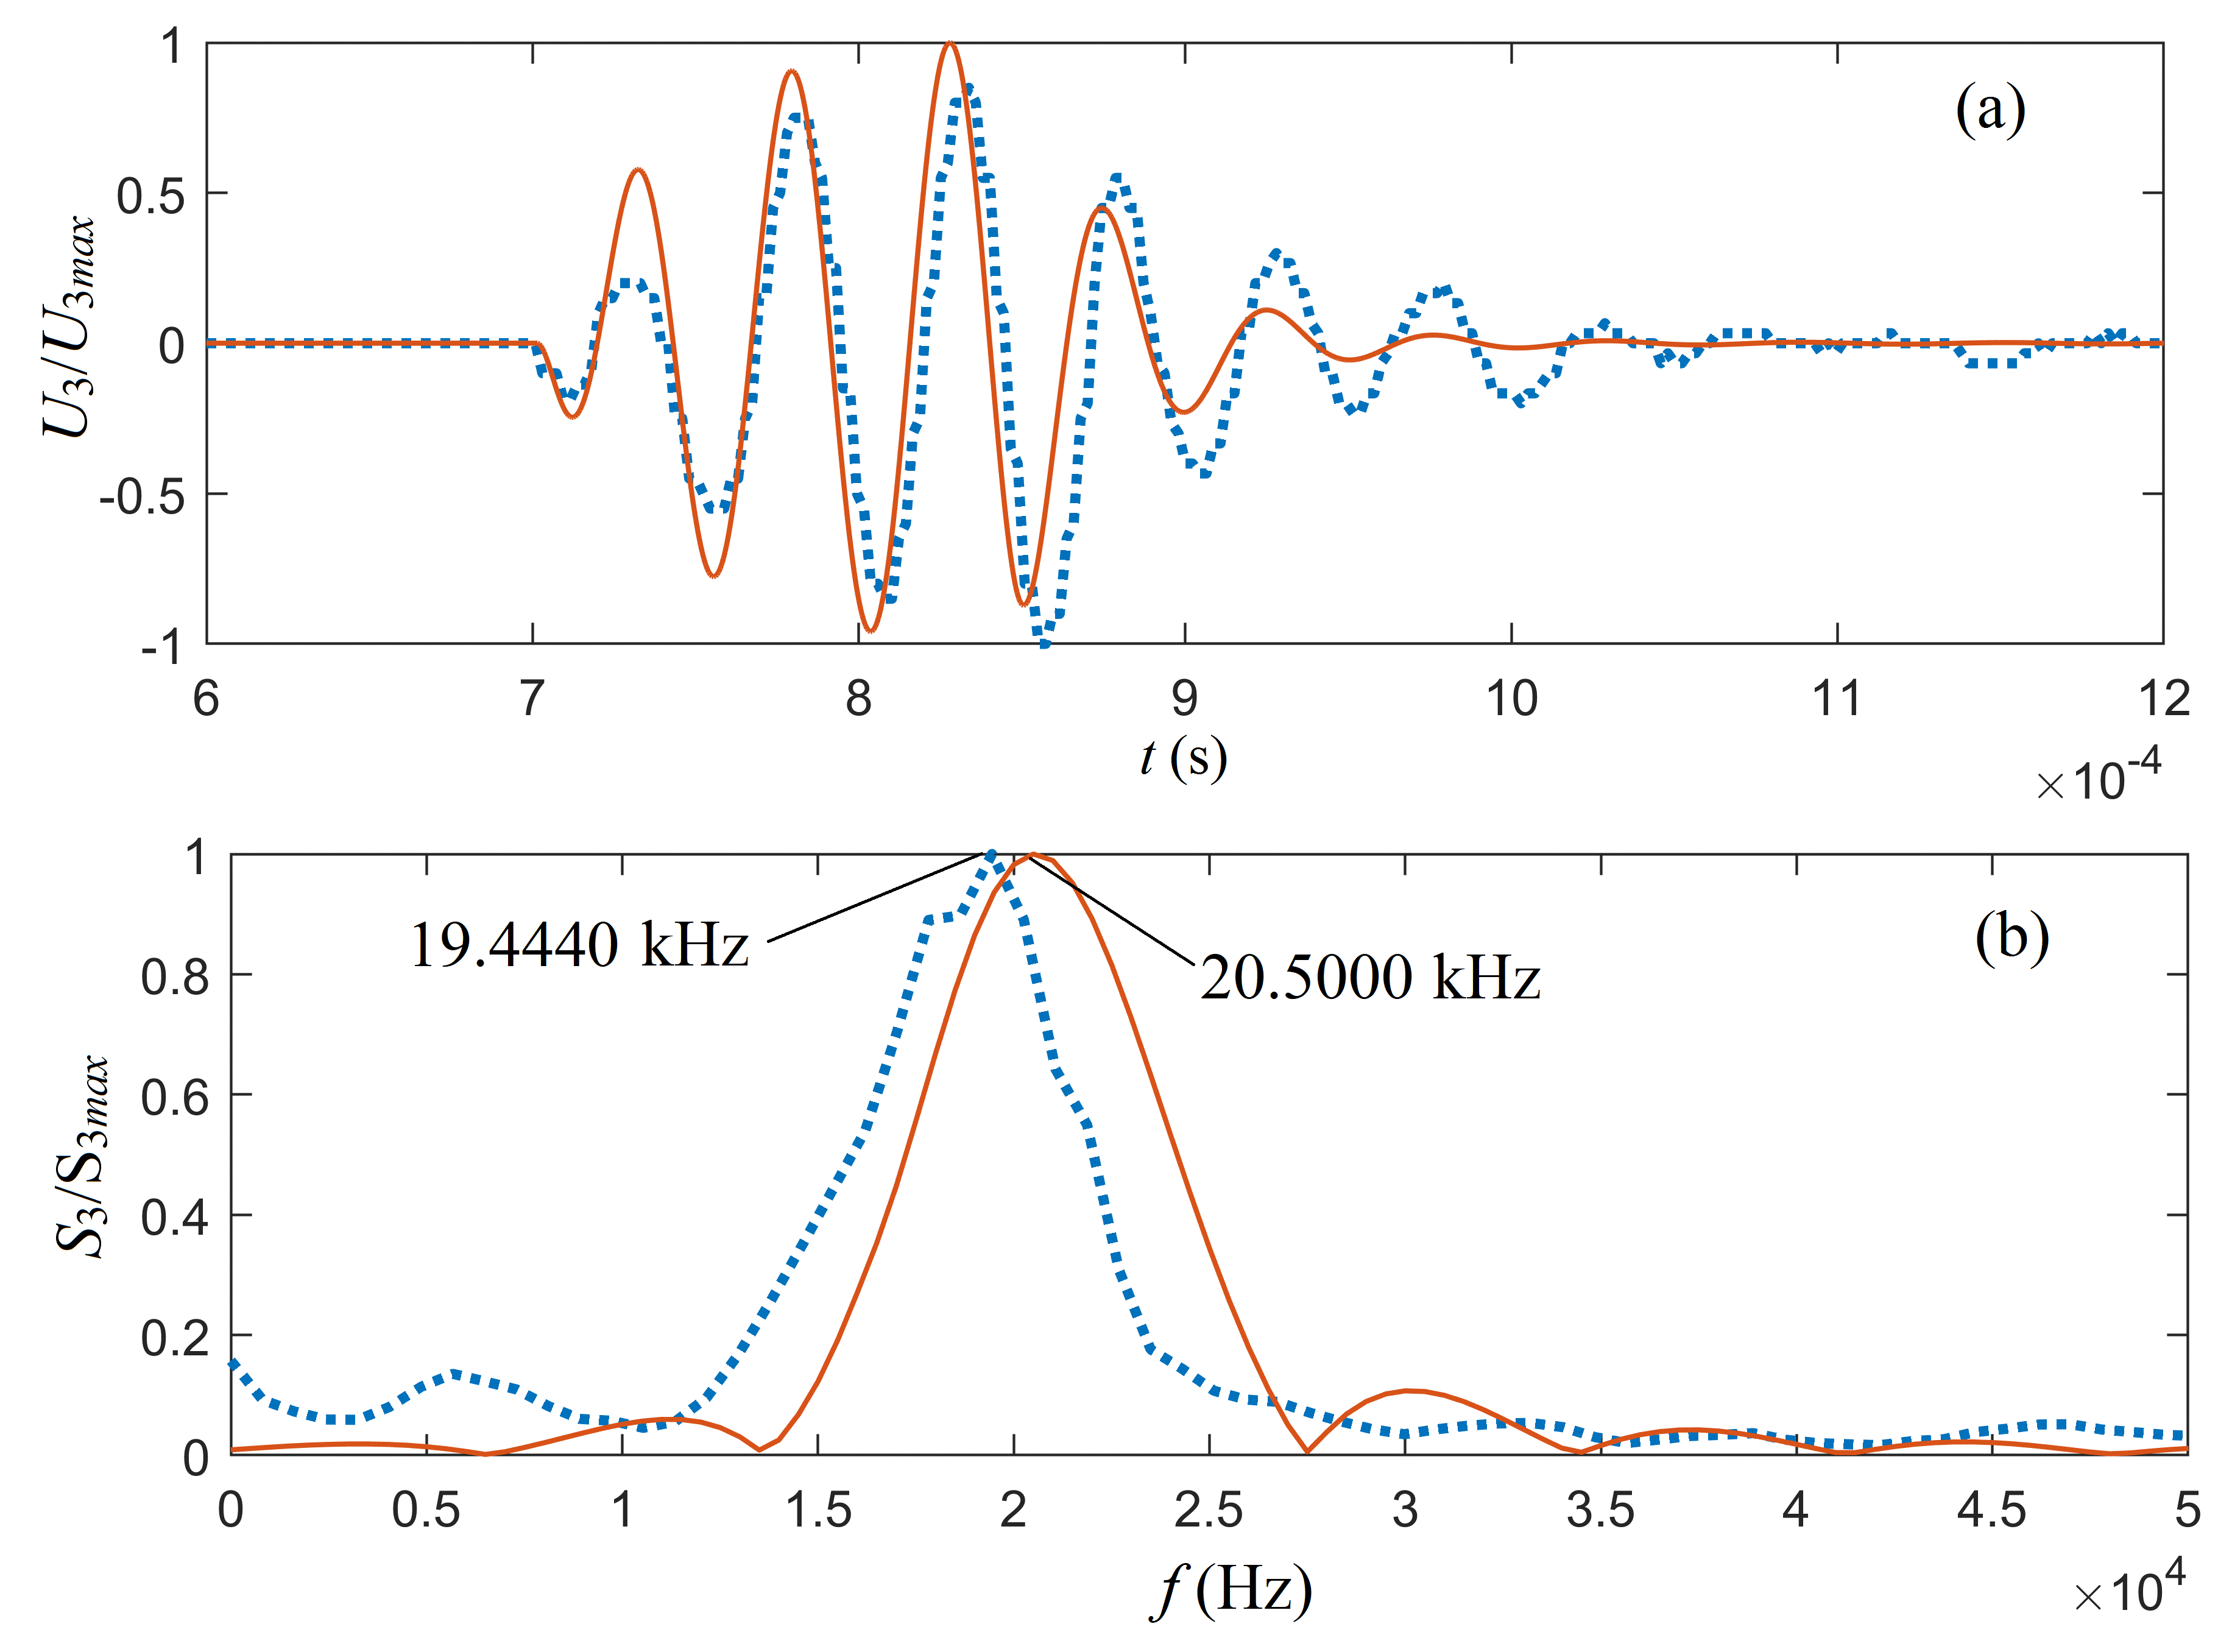 Figure 6 | Normalized electric signals at the receiver transducer: (a) the waveform and (b) the amplitude spectrum. S3 stands for the amplitude spectrum corresponding to the electric-signals U3 at the receiver transducer. Solid lines are from the network model calculation and dotted lines come from the experimental measurement.
Perspective
Generally speaking, the network modeling of the piezoelectric transducers for energy conversion has been successful. The calculated signals from network modeling are in good agreement with that of the experimental observation. Nevertheless, there are a number of open questions associated with the modeling for the desired accuracy. Foremost, the modeled amplitude spectrum has been shifted to the higher frequency domain comparing to the experimental measurement, carrying a 0.77% percent error. Our perception is that this imperfection arises from the assumption of the transient medium. However, it could be more than one factor associated with inaccuracy. The modeled network may be improved by incorporating additional putative factors for practical applications.
References
- Arnau, A. Piezoelectric Transducers and Applications; Springer: Berlin, Germany, 2008.
- Wu, J.; Fedder, G.K.; Carley, L.R. A low-noise low-offset capacitive sensing amplifier for a 50- monolithic CMOS MEMS accelerometer. IEEE J. Solid State Circuits 2004, 39, 722–730.
- Xie, J.; Lee, C.; Feng, H. Design, fabrication, and characterization of CMOS MEMS-based thermoelectric power generators. J. Micromech. Syst. 2010, 19, 317–324.
- Gubbi, J.; Buyya, R.; Palaniswami, MS. Internet of Things (IoT): A vision, architectural elements, and future directions. Future Gener. Comput. Syst. 2013, 29, 1645–1660.
- Tadigadapa, S.; Mateti, K. Piezoelectric MEMS sensors: State-of-the-art and perspectives. Meas. Sci. Technol. 2009, 20, 092001.
- Fa, L.; Castagna, J.P.; Suarez-Rivera, R.; Sun, P. An acoustic-logging transmission-network model (continued): Addition and multiplication ALTNs. J. Acoust. Soc. Am. 2003, 113, 2698–2073.
- Fa, L.; Zeng, Z.; Liu, H. A new device for measuring in-situ stresses by using acoustic emissions in rocks. In Proceedings of the 44th US Rock MechanicsSymposium and 5th U.S.-Canada Rock Mechanics Symposium, Salt Lake City, UT, USA, 27–30 June 2010.
- Ranjith, P.G.; Jasinge, D.; Song, J.Y.; Choi, S.K. A study of the effect of displacement rate and moisture content on the mechanical properties of concrete: Use of acoustic emission. Mech. Mater. 2008, 40, 453–469.
- Scruby, C.B. An introduction to acoustic emission. J. Phys. E Sci. Instrum. 1987, 20, 945–953.
- Dausch, D.E.; Gilchrist, K.H.; Carlson, J.B.; Hall, S.D.; Castellucci, J.B.; von Ramm, O.T. In vivo real-time 3-D intracardiac echo using PMUT arrays. IEEE Trans. Ultrason. Ferroelectr. Freq. Control 2014, 61, 1754–1764.
- Fa, L.; Xue, L.; Fa, Y.X.; Han, Y.L.; Zhang, Y.D.; Cheng, H.S.; Ding, P.F.; Li, G.H.; Bai, C.L.; Xi, B.J.; et al. Acoustic Goos-Hänchen effect. Sci. China Phys. Mech. Astron. 2017, 60, 104311.
- Fa, L.; Zhao, J.; Han, Y.L.; Li, G.H.; Ding, P.F.; Zhao, M.S. The influence of rock anisotropy on elliptical-polarization state of inhomogeneously refracted P-wave. Sci. China Phys. Mech. Astron. 2016, 59, 644301.
- Fa, L.; Li, W.Y.; Zhao, J.; Han, Y.L.; Liang, M.; Ding, P.F.; Zhao, M.S. Polarization state of an inhomogeneously refracted compressional-wave induced atinterface between two anisotropic rocks. J. Acoust. Soc. Am. 2017, 141, 1–6.
- Mustapa, M.A.; Yaakob, O.B.; Ahmed, Y.M.; Rheem, C.K.; Koh, K.K.; Adnan, F.A. Wave energy device and breakwater integration: A review. Renew. Sustain. Energy Rev. 2017, 77, 43.
- Breazeale, M.A.; Adler, L.; Scott, G.W. Interaction of ultrasonic waves incident at the Rayleigh angle onto a liquid-solid interface. Appl. Phys. 1977, 48, 530–537.
- Atlar, A.; Quate, C.F.; Wickramasinghe, H.K. Phase imaging in reflection with the acoustic microscope. Phys. Lett. 1977, 31, 791–793.
- Briers, R.; Leroy, O.; Shkerdin, G. Bounded beam interaction with thin inclusions. Characterization by phase differences at Rayleigh angle incidence. Acoust. Soc. Am. 2000, 108, 1622–1630.
- Goh, A.S.; Kohn, J.C.; Rootman, D.B.; Lin, J.L.; Goldberg, R.A. Hyaluronic acid gel distribution pattern in periocular area with high-resolution ultrasound imaging. Surg. J. 2014, 34, 510–515.
- Lu, Y.; Tang, H.; Fung, S.; Wang, Q.; Tsai, J.; Daneman, M.; Boser, B.; Horsley, D. Ultrasonic fingerprint sensor using a piezoelectric micromachined ultrasonic transducer array integrated with complementary metal-oxide semiconductor electronics. Phys. Lett. 2015, 106, 263503.
- He, Q.; Liu, J.; Yang, B.; Wang, X.; Chen, X.; Yang, C. MEMS-based ultrasonic transducer as the receiver for wireless power supply of the implantable microdevices. Actuators A Phys. 2014, 219, 65–72.
- Przybyla, R.J.; Tang, H.Y.; Guedes, A.; Shelton, S.E.; Horsley, D.A.; Boser, B.E. 3D ultrasonic rangefinder on a chip. IEEE J. Solid State Circuits 2015, 50, 320–334.
- Fa, L.; H. Wang; H.Y.; Ma, H.F. Acoustic array transmitting, receiving sounds and processing method of received full waves. In Transactions of International Conference on Earth Physics Logging; Academic Publishing House: Beijing, China, 1990.
- Fa, L.; Tu, N.; Qu, H.; Wu, YG.; Sun, K.; Zhang, YD.; Liang, M.; Fang, XG.; Zhao, M. Physical characteristics of and transient response from thin-cylindrical piezoelectric transducers used in petroleum logging tool. Micromachines (Special Issue on Piezoelectric Transducers: Materials, Devices, and Applications), 2019, 10, 804; doi:10.3390/mi10120804.
- Fa, L.; Mou, J.P.; Fa, Y.X.; Zhou, X.; Zhang, Y. D.; Liang, M.; Wang, M.M.; Zhang, Q.; Ding, P.F.; Feng, W.T.; et al. On transient response of piezoelectric transducers. Phys. 2018, 6, 123.
- Fa, L.; Zhou, X.; Fa, Y.X.; Zhang, Y.D.; Mou, J.P.; Liang, M.; Wang, M.M.; Zhang, Q.; Ding, P.F.; Feng, W.T.; et al. An innovative model for the transient response of a spherical thin-shell transducer and an experimental confirmation. China Phys. Mech. Astron. 2018, 61, 104311.
- Fa, L.; Zhao, M. Recent development of an acoustic measurement system. In Understanding Plane Waves; Nova Science Publishers: Hauppauge, NY, USA, 2019.
- Fa, L.; Zhao, M. Recent progress in acoustical theory and applications. In Understanding Plane Waves; Nova Science Publishers: Hauppauge, NY, USA, 2019.
