Your browser does not fully support modern features. Please upgrade for a smoother experience.
Please note this is a comparison between Version 3 by Dean Liu and Version 2 by Dean Liu.
Publicness is one of the substantial attributes of public open spaces (POS). The concept of publicness involves the definition of public (versus private).
- public open space
- publicness assessment tool
- space syntax
1. Publicness and Its Assessment
Publicness is one of the substantial attributes of POS. The concept of publicness involves the definition of public (versus private). The topic has been discussed for a long time in the realm of urban planning, architecture, politics, philosophy and related social disciplines. Each discipline approaches POS in different ways and examines its publicness from different perspectives while sharing common characteristics. Political scientists, for example, focus on democratization and ownership [1][2][3]; anthropologists on the historical construction and subjective value of places [4]; sociologists on the deliberative democracy and political community [5][6]; geographers on the sense of place and “landlessness” [7][8]; architects on the making of architectural space for social and cultural activities [9]; and urban planners on the greenery, sustainability and accessibility of urban space [10][11][12]. In the recent decade, researchers have called for a more pragmatic assessment of publicness. Several attempts have been made to develop appropriate criteria to summarize the core values or dimensions of publicness. One type of assessment is the Diagram model. Using this approach, one can analyze the social elements of public spaces by a qualitative description and interpret the results by pictorial diagrams so that different public spaces can be compared intuitively. Some of the initial diagram models are the “spider” diagram of CABE used by the London government (2007) and the “cobweb” model of Van Melik, Van Aalst and Van Weesep [13]. The “spider” diagram is used with the organizing of workshops for residents and experts. In essence, many of the indicators are highly subjective. For example, the “you” indicator evaluates “how the space makes you feel”. The “cobweb” model analyzes the representation of “fear” and “fantasy” in two specific spaces—“secured” public space and “themed” public space—from the perspective of environmental psychology.
The following models are modified based on the “cobweb” model. Németh and Schmidt formulated 20 variables for assessing Manhattan Central in New York, each variable scored from 0 to 5 [14]. In 2011, they proposed a “tri-axial” model that consists of three core components: Ownership, Management, Uses/Users [15]. This is a highly conceptual model aiming at a robust assessment approach, allowing for bracketing one or more core indicators or dimensions. However, their research did not fully capture the complexity of publicness as they were looking at a limited sample of public places in the city of New York [16]. Additionally, in this model, two of the three dimensions focus on the “control” aspect by qualitative descriptors, while only the “Management” dimension has a scoring mechanism. Varna and Tiesdell interpreted five dimensions of publicness in their “Star Model” based on a rigorous review of available public space literature [16]. Each dimension incorporated one to several sub-items, while each sub-item is evaluated by a subjective score (0 to 5). Notably, in this model, the “Physical Configuration” dimension was added, which denotes spatial accessibility that activates usage. The indicators in the “Star” model are for universal coverage. For instance, when evaluating to what degree spaces provide opportunities for active engagement and discovery, the “Cobweb” model assessed it by the coverage of a pavement café, while the “Star” model assessed it by active frontage, seating location, and “loose” spaces.
As privately owned public spaces emerged, the critiques grew of the diagram models directed at flagship and Anglo-American cities. The “OMAI” model by Langstraat and Van Melik (2013) closely resembled the Star Model, but added a “consequences” dimension for the study of European cases [7]. However, this also meant that the model could not be used in the planning stage of public space. Mehta (2014) constructed the “public space index” and applied it in Padang, Indonesia [17]. The “public space index” has 45 indicators and different weightings assigned to various indicators. Next is the “six-axial” model by Mantey (2017), designed especially for suburban gathering places, particularly cafés, restaurants, etc. in Polish suburban environments [18]. In recent years, the research on POS evaluation has mainly focused on the quantitative research and evaluation of outdoor environmental qualities. Wojnarowska et al. constructed an index system to measure the environmental quality of public spaces from the perspective of urban design, including safety, comfort, accessibility, social and economic vitality, etc. [19]; Emad Mushtaha et al. used the Analytic Hierarchy Process (AHP) to develop a standardized hierarchy based on importance, and applied mathematical analysis to derive the overall livability level of open public spaces [20]. By means of fuzzy logic modeling, Ekdi and Çıracı evaluated and compared the publicness of public space in Istanbul. The authors argued that the value of this approach is that it is practical in simplifying and emphasizing the interdependent nature of the concept of publicity and its complexity [21]. The “fuzzy logic” model considers the interaction among different dimensions. It simulated human perception and their way of thinking toward the environment. Nevertheless, because of subjectivity, the assessment result by this model yielded more uncertainty and became unrealistic when applied to real projects.
In the end, among the research on assessing publicness, a branch of researchers have shifted the focus to quantitatively measure individuals’ feelings of public space. Notably, a semantic differential (SD) research method in psychology was introduced. The SD technique is a method proposed by Osgood, Suci, and Tannenbaum in 1957 using language as a scale to measure psychological feelings [22], which can quantify abstract perceptions. In recent years, many quantitative studies of public space performance have been based on the SD method. For example, Perović et al. studied creative street regeneration in the context of socio-spatial sustainability by using the case of a traditional city center in Podgorica, Montenegro. The SD method was used to quantitatively evaluate people’s perception of street dynamism [23]. Herranz-Pascual et al. assessed changes in the acoustic environment resulting from the renovation of public spaces, including end-user questionnaires, sound measurements and recordings related to the soundscape. The study combined measurements of several acoustic variables, as well as psychosocial variables regarding soundscape perception and other dimensions [24]. The strength of this SD assessment is that it directly portrays the attitudes and satisfaction of the public, although it also means that it cannot be applied in the preliminary stage of urban planning and design.
In the recent two decades, the majority of models for publicness assessment were developed into two kinds of paradigms. The first type decomposes various dimensions of publicness based on the social functions and spatial features of POS. The second type measures people’s perception of POS. The first type can be applied before and after POS in operation, while the second type can only be applied after POS in operation (Table 1). Among the first type of assessment, the Star Model is the most popular evaluative model for assessing public space in urban design applications. Compared with other models, the Star Model has the advantage of wide coverage, detailed classification of sub-items, clear evaluation criteria and easy operation. The assessor can easily detect missing considerations when applied in real situations under different contexts.
Table 1. Brief characteristics of different assessments of publicness (compiled by the authors).
| Model | Dimensions of Publicness | Scoring Criterion |
Pictorial Result |
Comparison among Cases | Application |
|---|---|---|---|---|---|
| The “spider” diagram of CABE Spaceshaper (2007) [13] | access, use, other people, maintenance, environment, design and appearance, community, you | ▲ | ✔ | ✔ | - |
| The publicly accessible spaces index of Németh and Schmidt (2007) [14] | laws & rules, surveillance & policing, design & image, access & territoriality | ✔ | - | ▲ | - |
| The “cobweb” model of Van Melik, Van Aalst, and Van Weesep (2007) [7] | criteria of secured public space: surveillance, restraints on loitering, regulation criteria of themed public space: events, fun-shopping, pavement cafés |
✔ | ✔ | - | - |
| The Star Model of Varna and Tiesdell (2010) [16] | ownership, control, civility, animation, physical configuration | ✔ | ✔ | ✔ | ✔ Scotland & Northern Europe |
| The “tri-axial” model of Németh and Schmidt (2011) [15] | ownership, control, civility, animation, physical configuration | ▲ | ✔ | - | ✔ New York, USA |
| The “OMAI” model of Langstraat and Van Melik (2013) [7] | ownership, management, uses/users | ✔ | ✔ | ✔ | - |
| The “public space index” of Mehta (2014) [17] | ownership, management, accessibility, inclusiveness | ✔ | - | ▲ | ✔ Padang, Indonesia |
| The “fuzzy logic” model of Ekdi and Çıracı (2015) [21] | inclusiveness, meaningful activities, comfort, safety, pleasure | ✔ | - | ✔ | - |
| The “six-axial” mode of Mantey (2017) [18] | accessibility, management, user | ✔ | ✔ | - | ✔ Poland |
| AHP method, represented by Emad Mushtaha et al., 2020 [20] | environmental quality, social & culture elements, accessibility and safety, amenities and services | ✔ | ▲ | ✔ Sharjah, UAE |
|
| SD method, represented by Perović et al. (2019) [23]; Herranz-Pascual et al., 2022 [24] | visual, tactile, and auditory perception | ✔ | ✔ | ✔ | ✔ Podgorica, Montenegro |
✔ those functions that the model has considered well; ▲ those functions that the model has considered in parts only. Source: summarized by the authors.
2. Integrating Space Syntax with Publicness Assessment
Alongside the trend of making POS publicness measurable and quantifiable, Space Syntax is found to have new use when integrating with the traditional POS assessment tools [25][26]. Accessibility is the core element that patterns the movement of flows and aggregation of activities [27][28][29]. Space Syntax provides the mathematical measurement of accessibility. Initially, it measures psychologically cognitive accessibility based on the axial map, which calculates the topological distance. Then, the Segment Map method is introduced to Space Syntax, and metric distance can thus be considered. Space Syntax provides a new scope for analyzing the impact of spatial configuration on pedestrian walking and social activities. Traditionally, studies used Space Syntax to predict transportation flows and pedestrian flows. But large amounts of evidence has shown that higher integration, choice and connectivity result in a higher volume of walking flow [30][31][32][33]. Recently, empirical studies have demonstrated the positive relationship between spatial configuration and various forms of timespan and activities on site by using Space Syntax. For one, leisure walking, which is triggered more by urban environment quality and reflects urban vitality, has proven to be relative to syntactic variables [34]. Passive activities like resident outdoor gathering, office communication, playing sports and so on are also verified by syntactic variables [31][35]. Based on these newer studies, Space Syntax also can analyze those configurative factors that have direct impacts on the publicness of public spaces.
Increasingly, empirical research has suggested that Space Syntax can assess the “accessibility and social effects” of space but the publicness of POS does not totally depend on it. Thus, a combination of Space Syntax and other tools would be more reasonable in assessing publicness [26]. For instance, Shen and Karimi (2016) combined Space Syntax, POIs and social media data to identify urban function connectivity so as to identify the urban regions with a high level of publicness [25]. Remarkably, Varna and Damiano (2013) have introduced the concept of pairing Space Syntax with the Star Model for visualizing and better assessing the publicness of POS [36] (Figure 1). In this way, Space Syntax as a quantitative tool is hypothesized to compensate for the shortness of the Star Model. For instance, in the assessment of the physical configuration, the “centrality and connectedness” indicators proposed by the Star Model could be represented by “Integration” in the Space Syntax. “Visual permeability” and the “Thresholds and gateways” are both indicators that have a close relationship with syntactic variables in Space Syntax. While in the Star Model, these indicators are scored by observation and absolute scales, Space Syntax outperformed it by computer simulation. Conversely, the determination of social activities is complex and relates to more than just spatial configuration. Computer simulation, which can produce scientific prediction such as “negative correlation, non-linear correlation and no significant correlation” between spatial configuration and human behavior, is useful for the study of social activities, e.g., leisure walking [30][31][32][37].
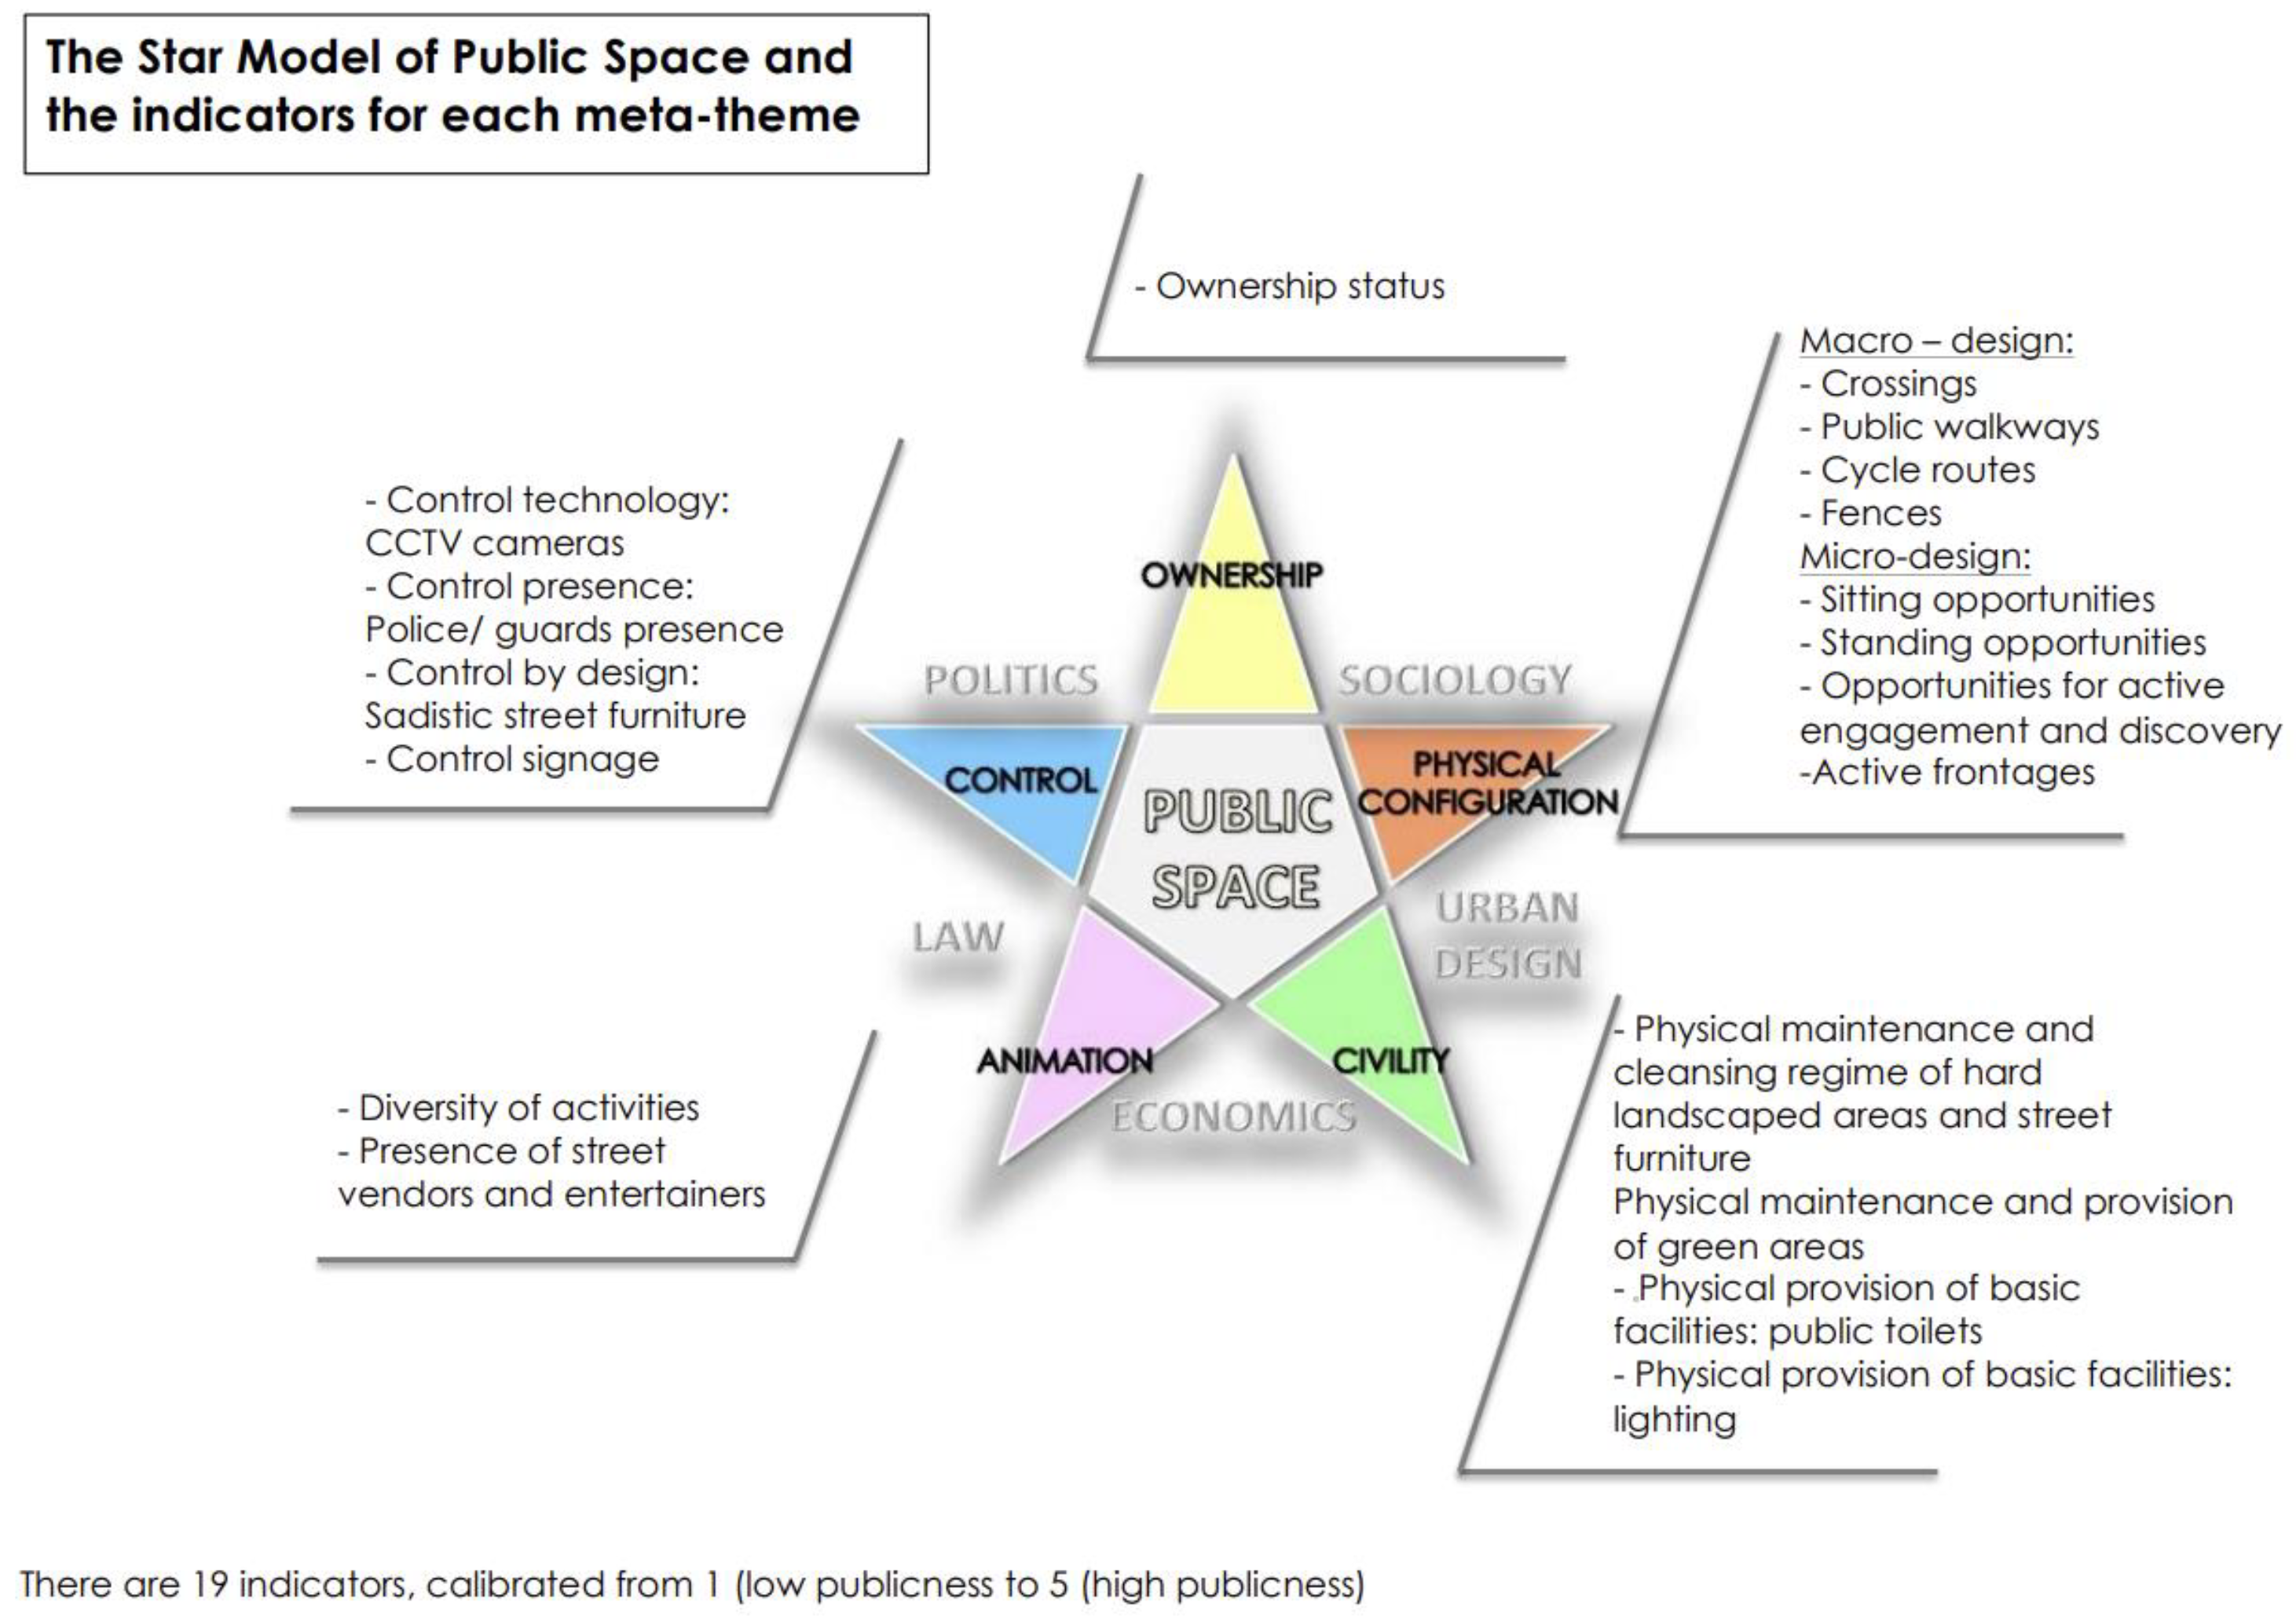
Figure 1. The Star Model of Public Space and indicators for each meta-theme. Source: Varna & Damiano [36].
Integrating Space Syntax with the traditional analytical framework of publicness for assessing the quality of POS has been verified to be a more scientific method. However, prior research has two shortages: (1) the concept has not yet been transformed into a practical tool for actual urban planning and urban design projects. Although there are few studies combining Space Syntax with the Star Model, these studies did not verify the assessment results with the actual use of POS. Meanwhile, there is a lack of evaluation studies on urban renewal. (2) The use of the tools has not achieved precision. They can only compare the overall situation of different cases, which limits their application to guiding spatial design. From this perspective, this research aims to improve the combined use of Space Syntax (which provides quantitative results) and Star Model (which considers non-configurative factors) in the publicness assessment of POS.
References
- Bozeman, B.; Bretschneider, S. The “publicness puzzle” in organization theory: A test of alternative explanations of differences between public and private organizations. J. Public Adm. Res. Theory 1994, 4, 197–224.
- Pesch, U. The publicness of public administration. Adm. Soc. 2008, 40, 170–193.
- Walker, R.M.; Bozeman, B. Publicness and organizational performance. J. Public Adm. Res. Theory 2011, 21, i279–i281.
- Bailey, M. Rethinking public service broadcasting: The historical limits to publicness. In Media and Public Spheres; Palgrave Macmillan: London, UK, 2007; pp. 96–108.
- Young, I.M. Inclusion and Democracy; Oxford University Press on Demand: Oxford, UK, 2002.
- Habermas, J. The Theory of Communicative Action: Lifeworld and Systems, a Critique of Functionalist Reason; Wiley: Hoboken, NJ, USA, 2015; Volume 2.
- Langstraat, F.; Van Melik, R. Challenging the ‘end of public space’: A comparative analysis of publicness in British and Dutch urban spaces. J. Urban Des. 2013, 18, 429–448.
- Corkery, L. Reclaiming and making places of distinction through landscape architecture. In Place and Placelessness Revisited; Routledge: New York, NY, USA, 2016; pp. 61–75.
- Han, S.; Kim, J.W.; Kwon, Y. Contemporary spatial publicness: Its new characteristics and democratic possibilities. Sustainability 2019, 11, 4729.
- Madanipour, A. Whose Public Space?: International Case Studies in Urban Design and Development; Routledge: New York, NY, USA, 2013.
- Fan, P.; Xu, L.; Yue, W.; Chen, J. Accessibility of public urban green space in an urban periphery: The case of Shanghai. Landsc. Urban Plan. 2017, 165, 177–192.
- Szczepańska, A.; Pietrzyk, K. An evaluation of public spaces with the use of direct and remote methods. Land 2020, 9, 419.
- Van Melik, R.; Van Aalst, I.; Van Weesep, J. Fear and fantasy in the public domain: The development of secured and themed urban space. J. Urban Des. 2007, 12, 25–42.
- Németh, J. Defining a public: The management of privately owned public space. Urban Stud. 2009, 46, 2463–2490.
- Németh, J.; Schmidt, S. The privatization of public space: Modeling and measuring publicness. Environ. Plan. B Plan. Des. 2011, 38, 5–23.
- Varna, G.; Tiesdell, S. Assessing the publicness of public space: The star model of publicness. J. Urban Des. 2010, 15, 575–598.
- Mehta, V. Evaluating public space. J. Urban Des. 2014, 19, 53–88.
- Mantey, D. The ‘publicness’ of suburban gathering places: The example of Podkowa Leśna (Warsaw urban region, Poland). Cities 2017, 60, 1–12.
- Wojnarowska, A. Model for assessment of public space quality in town centers. Eur. Spat. Res. Policy 2016, 23, 81–109.
- Mushtaha, E.; Alsyouf, I.; Al Labadi, L.; Hamad, R.; Khatib, N.; Al Mutawa, M. Application of AHP and a mathematical index to estimate livability in tourist districts: The case of Al Qasba in Sharjah. Front. Archit. Res. 2020, 9, 872–889.
- Ekdi, F.P.; Çıracı, H. Really public? Evaluating the publicness of public spaces in Istanbul by means of fuzzy logic modelling. J. Urban Des. 2015, 20, 658–676.
- Osgood, C.E.; Suci, G.J.; Tannenbaum, P.H. The Measurement of Meaning; University of Illinois Press: Champaign, IL, USA, 1957.
- Perovic, S.K.; Šestovic, J.B. Creative Street Regeneration in the Context of Socio-Spatial Sustainability: A Case Study of a Traditional City Centre in Podgorica, Montenegro. Sustainability 2019, 11, 39.
- Herranz-Pascual, K.; Iraurgi, I.; Aspuru, I.; Garcia-Pérez, I.; Santander, A.; Eguiguren, J.L. Integrating Soundscape Criteria in Urban Sustainable Regeneration Processes: An Example of Comfort and Health Improvement. Sustainability 2022, 14, 3143.
- Shen, Y.; Karimi, K. Urban function connectivity: Characterisation of functional urban streets with social media check-in data. Cities 2016, 55, 9–21.
- Harvey, C.; Aultman-Hall, L. Measuring urban streetscapes for livability: A review of approaches. Prof. Geogr. 2016, 68, 149–158.
- Rokicki, B.; Stępniak, M. Major transport infrastructure investment and regional economic development–An accessibility-based approach. J. Transp. Geogr. 2018, 72, 36–49.
- Sun, G.; Haining, R.; Lin, H.; Oreskovic, N.M.; He, J. Comparing the perception with the reality of walking in a hilly environment: An accessibility method applied to a University campus in Hong Kong. Geospat. Health 2015, 10, 32–39.
- Ekkel, E.D.; de Vries, S. Nearby green space and human health: Evaluating accessibility metrics. Landsc. Urban Plan. 2017, 157, 214–220.
- Rashid, M.; Wineman, J.; Zimring, C. Space, behavior, and environmental perception in open plan offices: A prospective study. Environ. Plan. B Plan. Des. 2009, 36, 432–449.
- Trova, V.; Hadjinikolaou, E.; Xenopoulos, S.; Peponis, J. The Structure of Public Spacein Sparsely Urban Areas. In Proceedings of the Second International Space Syntax Symposium, Brazilia, Brazil, 29 March–2 April 1999; pp. 1–12.
- Baran, P.K.; Rodríguez, D.A.; Khattak, A.J. Space syntax and walking in a new urbanist and suburban neighbourhoods. J. Urban Des. 2008, 13, 5–28.
- Hajrasouliha, A.; Yin, L. The impact of street network connectivity on pedestrian volume. Urban Stud. 2015, 52, 2483–2497.
- Hillier, B.; Penn, A.; Hanson, J.; Grajewski, T.; Xu, J. Natural movement: Or, configuration and attraction in urban pedestrian movement. Environ. Plan. B Plan. Des. 1993, 20, 29–66.
- Abbasi, A.; Alalouch, C.; Bramley, G. Open space quality in deprived urban areas: User perspective and use pattern. Procedia-Soc. Behav. Sci. 2016, 216, 194–205.
- Varna, G.; Damiano, C. Making the publicness of public space visible: From space syntax to the star model of public space. In Proceedings of the EAEA-11 Conference 2013, Track 1 Visualizing Sustainability: Making the Invisible Visible, Milan, Italy, 25–28 September 2013; p. 101.
- Koohsari, M.J.; Karakiewicz, J.A.; Kaczynski, A.T. Public open space and walking: The role of proximity, perceptual qualities of the surrounding built environment, and street configuration. Environ. Behav. 2013, 45, 706–736.
More