IA copper tailin this research, the extracg is a residue, product of the flotation of metals from a copper tailing was carried out by means of leachingsulfide minerals, which contain a variety of elements that can be valorized. The leaching processextraction of metals from copper tailings consisted of dissolving tailing samples using hydrochloric of applying metallurgical techniques, such as acid solutions. As a result, iron, copper, aluminum, calcium and magnesium, among other elements, were obtained. Different techniques such as Scanning Electron Microscopy-Energy Dispersive Spectroscopy (SEM-EDX), X-ray Diffraction (XRD) and Atomic Absorption Spectroscopy (AAS), where applied to analyze the initialleaching or magnetic concentration, to obtain a valuable product. Currently, this is an important objective, given that mining operations have increased the generation of tailing sample, and the s. Acid leaching products: acid solution and insolubleis a process that consists of dissolving a solid. Variables material, such as acid concentration, reaction time and reaction temperature were studied. The elements obtained in the acid tailing, by applying an acid solution. This process forms two final products: an insoluble solid, rich in aluminosilicates, and an acid liquid solution prepared with a tailing sample and hydrochloric acid solution,with different metal ions. Both products may have different characteristics and can be recovereused for subsequent applications.
Adapted from: https://doi.org/10.3390/met12111924
- copper tailing
- leaching
- valorization
Abstract
Currently, mining operations have increased the generation of tailings, which contain a variety of elements that can be valorized. In this research, tailing samples were leached with hydrochloric acid of concentrations greater than 3 M, considering the monitoring of iron, copper, aluminum, calcium and magnesium, as relevant elements of the leached solution. Time and temperature were also studied. The original tailing sample was taken by trial pits, and a size distribution analysis was performed. The process generated an insoluble solid, rich in aluminosilicates, and an acid liquid solution with different metal ions. Elemental analyses were performed on liquid samples by Atomic Absorption Spectroscopy (AAS), and solid samples by Scanning Electron Microscopy-Energy Dispersive Spectroscopy (SEM-EDX) and X-ray Diffraction (XRD). Results showed an increasing trend of the iron concentration as a function of the acid concentration. However, copper is not affected by the change in acid concentration, but by time and temperature. Aluminum decreases with acid concentration, keeps constant with time, and yields at 50 °C. In the range of the studied parameters, calcium and magnesium showed a variation without a clear trend. The elements in the acid solution prepared with a tailing from northern Chile can be recovered for subsequent applications.1. Introduction
1. Introduction
2. MCollection and Charaterials and Mcterization of the Tailing Samplethods
2.1. Characterization Equipment
For the sieving process, the sample was deposited into the following sieves set: #40, #50, #70, #100, #140, #200, #270 and #400 ASTM. This set was shaken for 10 min using a Labtech Hebro Ro-Tap. For the Laser Diffraction analysis, a Malvern Mastersizer 2000 was employed with distilled water as dispersing agent. For SEM-EDX, the e tailing sample was deposited on a graphite sheet and the measurements were taken at 100× using a Zeiss EVO MA10 equipment (Carl Zeiss Pvt. Ltd., Oberkochen, Germany) with Oxford Instruments EDX detector model X-MaxN 20 SDN (Oxford Instruments, Abingdon, UK). The XRD analysis was performed on a Shimadzu LabX XRD-6100 equipment (Shimadzu, Kyoto, Japan), using Cu Kα radiation (λ = 1.5406 Å) with graphite monochromator. The samples were mounted using acetone. The parameters were 30 kV of voltage and 20 mA of current. The scanning was performed using a theta–2theta drive axis, with a scan range from 10 to 120 degrees, at a speed of 2 degrees per minute. The sampling pitch was 0.02 degrees, and the preset time was 10 s for the tailing sample and 3 s for the insoluble solid.2.2. Collection and Characterization of the Tailing Sample
The tailing sample was obtained from a tailing dam plabtained from a tailing dam placed in the north of Chile (Figure 1a). The sample (Figure 1b) was taken from the wall of the tailing dam using the trial pits technique. Then, this sample passed through a homogenization method considering rolling and quartering to obtain a representative sample. Subsequently, sieving was performed to analyze the size distribution and it was compared with a Laser Diffraction analysis. In addition, SEM-EDX and XRD analyses were performed to determine the tailing composition. Elements were determined with an AAS analysis.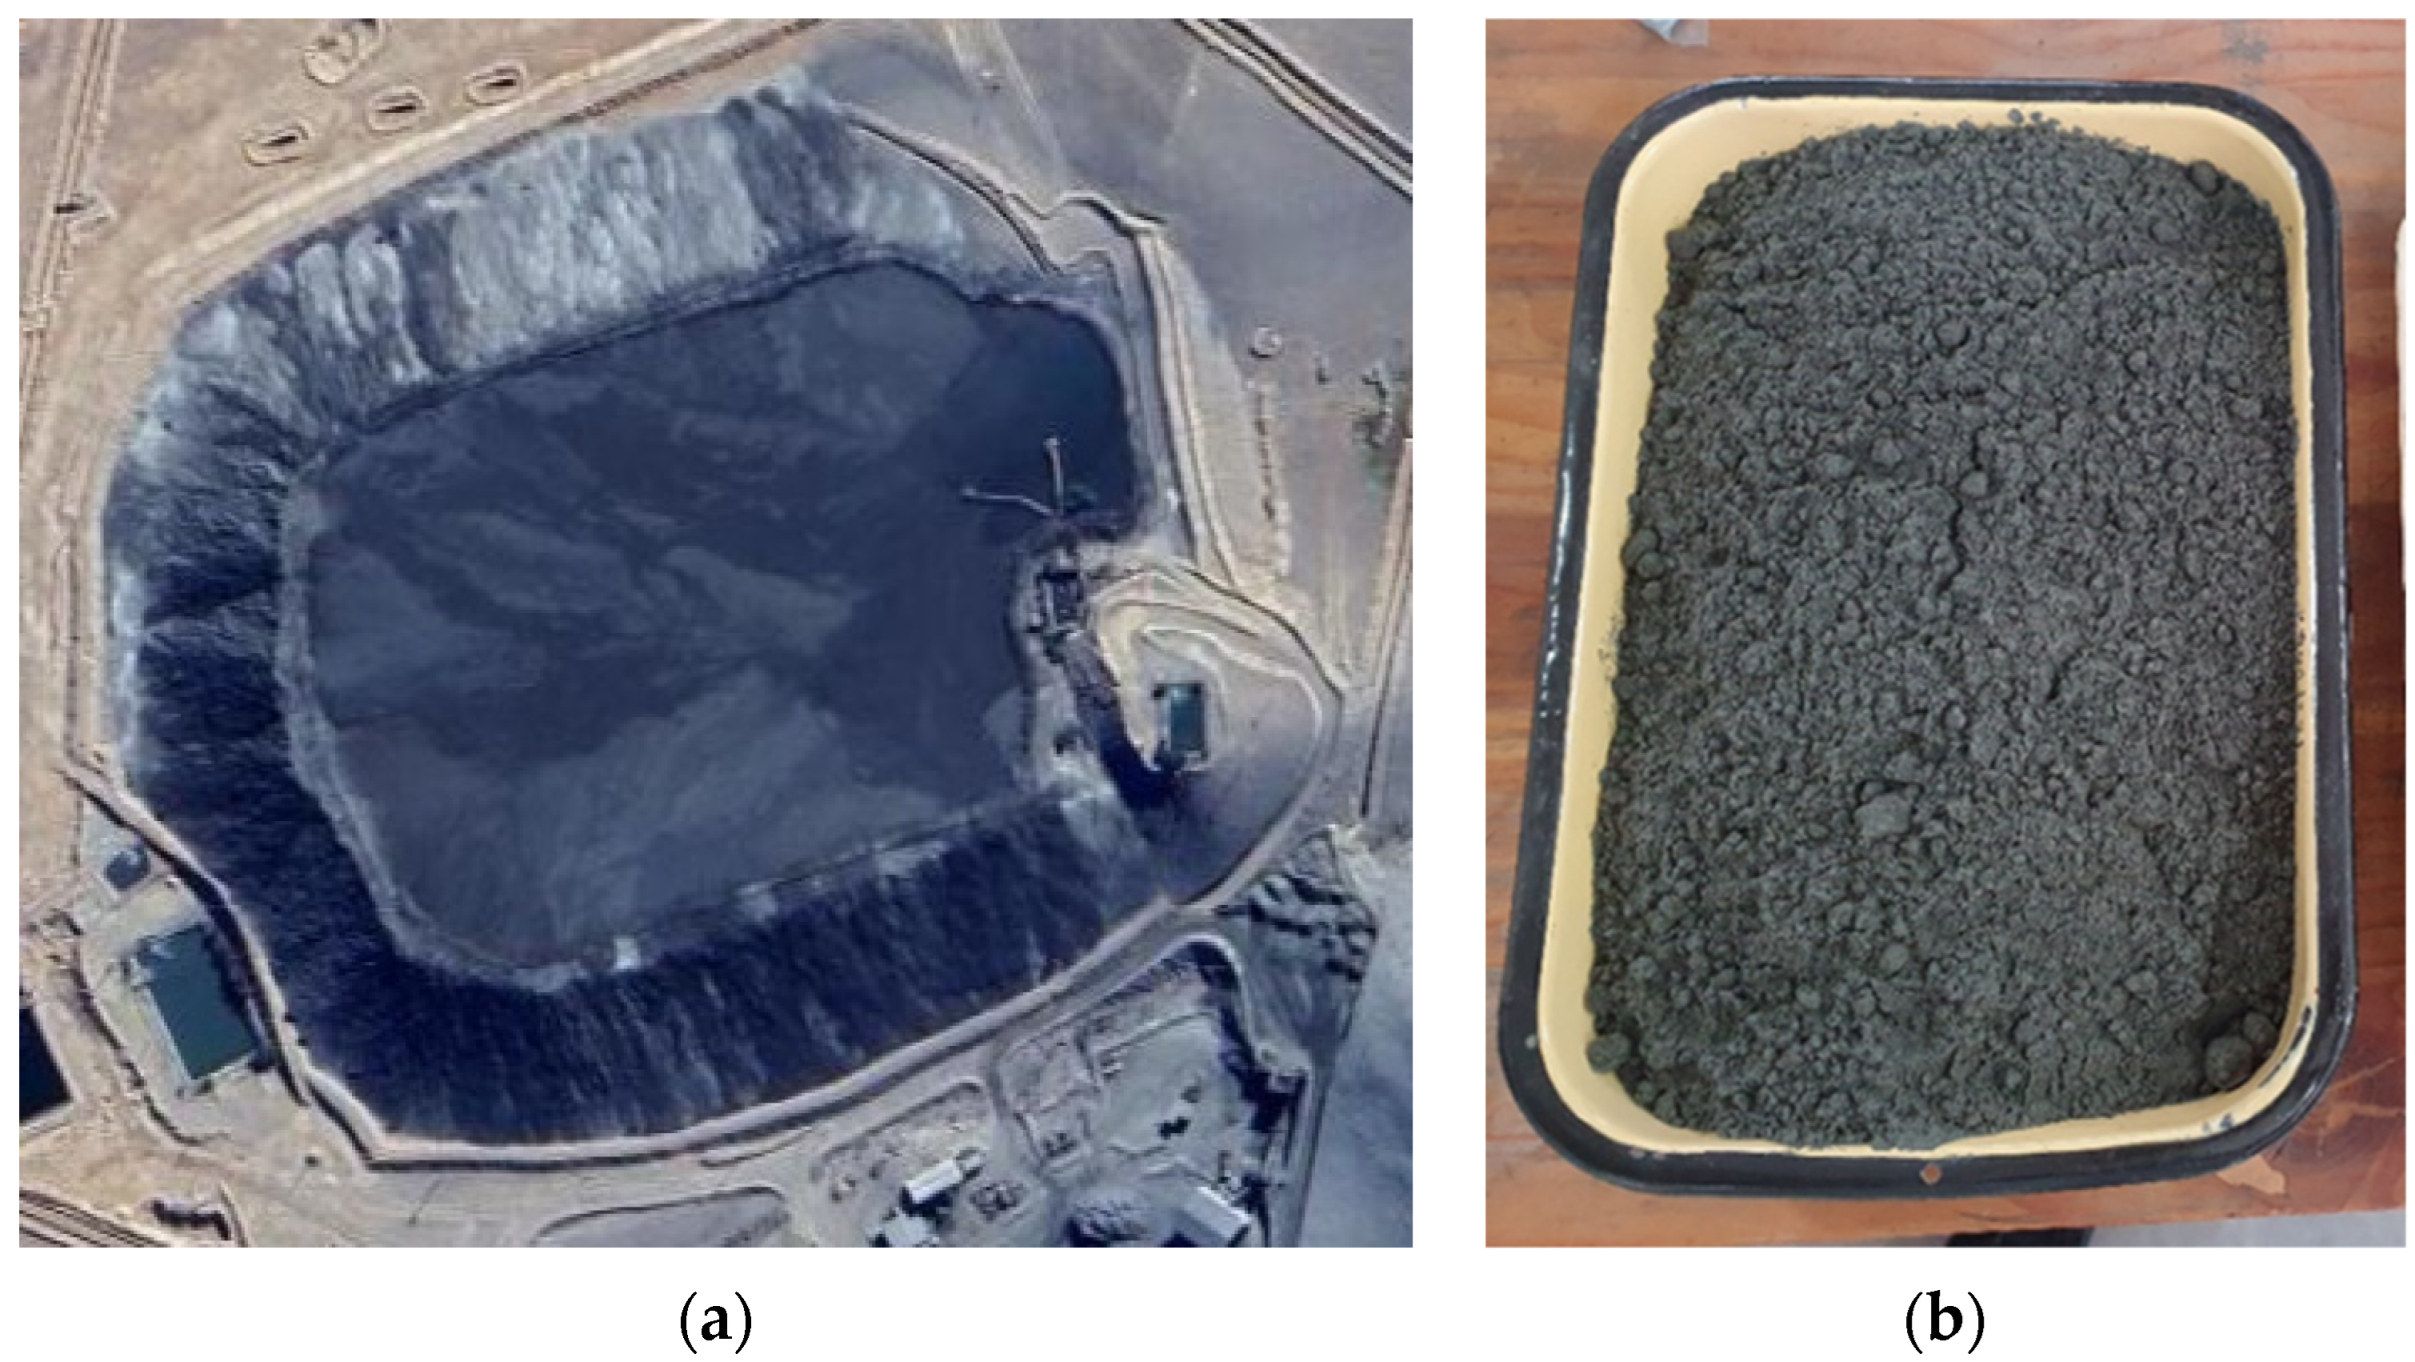
2.3. Leaching Procedure
3. Leaching Procedure
The initial tailing sample was leached using a HCl solution. To perform the leaching, 1 g samples were weighed and deposited in round-bottom flasks, each of them with 250 mL of the prepared acid solution (3 M, 6 M, 9 M or 12 M). The mixture was stirred with a magnetic stirrer at 550 rpm under a controlled temperature, coupling the flask with a laboratory condenser tube. After the leaching time, the solution was vacuum filtered using a porous glass filter. The filtered liquid solution and the insoluble solid left in the filter were reserved for later analysis. This procedure was repeated changing the acid concentration, the reaction time, and the reaction temperature as shown in Figure 2, where “C” is the acid concentration, “t” is time, and “T” is temperature. In addition, all combinations shown in Figure 2 were performed twice. The dissolution times were 6 h, 16 h, and 62 h, a long enough time. The temperatures were 25 °C (considered as room temperature), 50 °C, 60 °C, and 70 °C. After finishing the experiments, the total iron, copper, aluminum, calcium, and magnesium concentrations in the filtered acid solution were determined by AAS. The insoluble solids were dried, at 65 °C, for 24 h to be analyzed with SEM-EDX and XRD.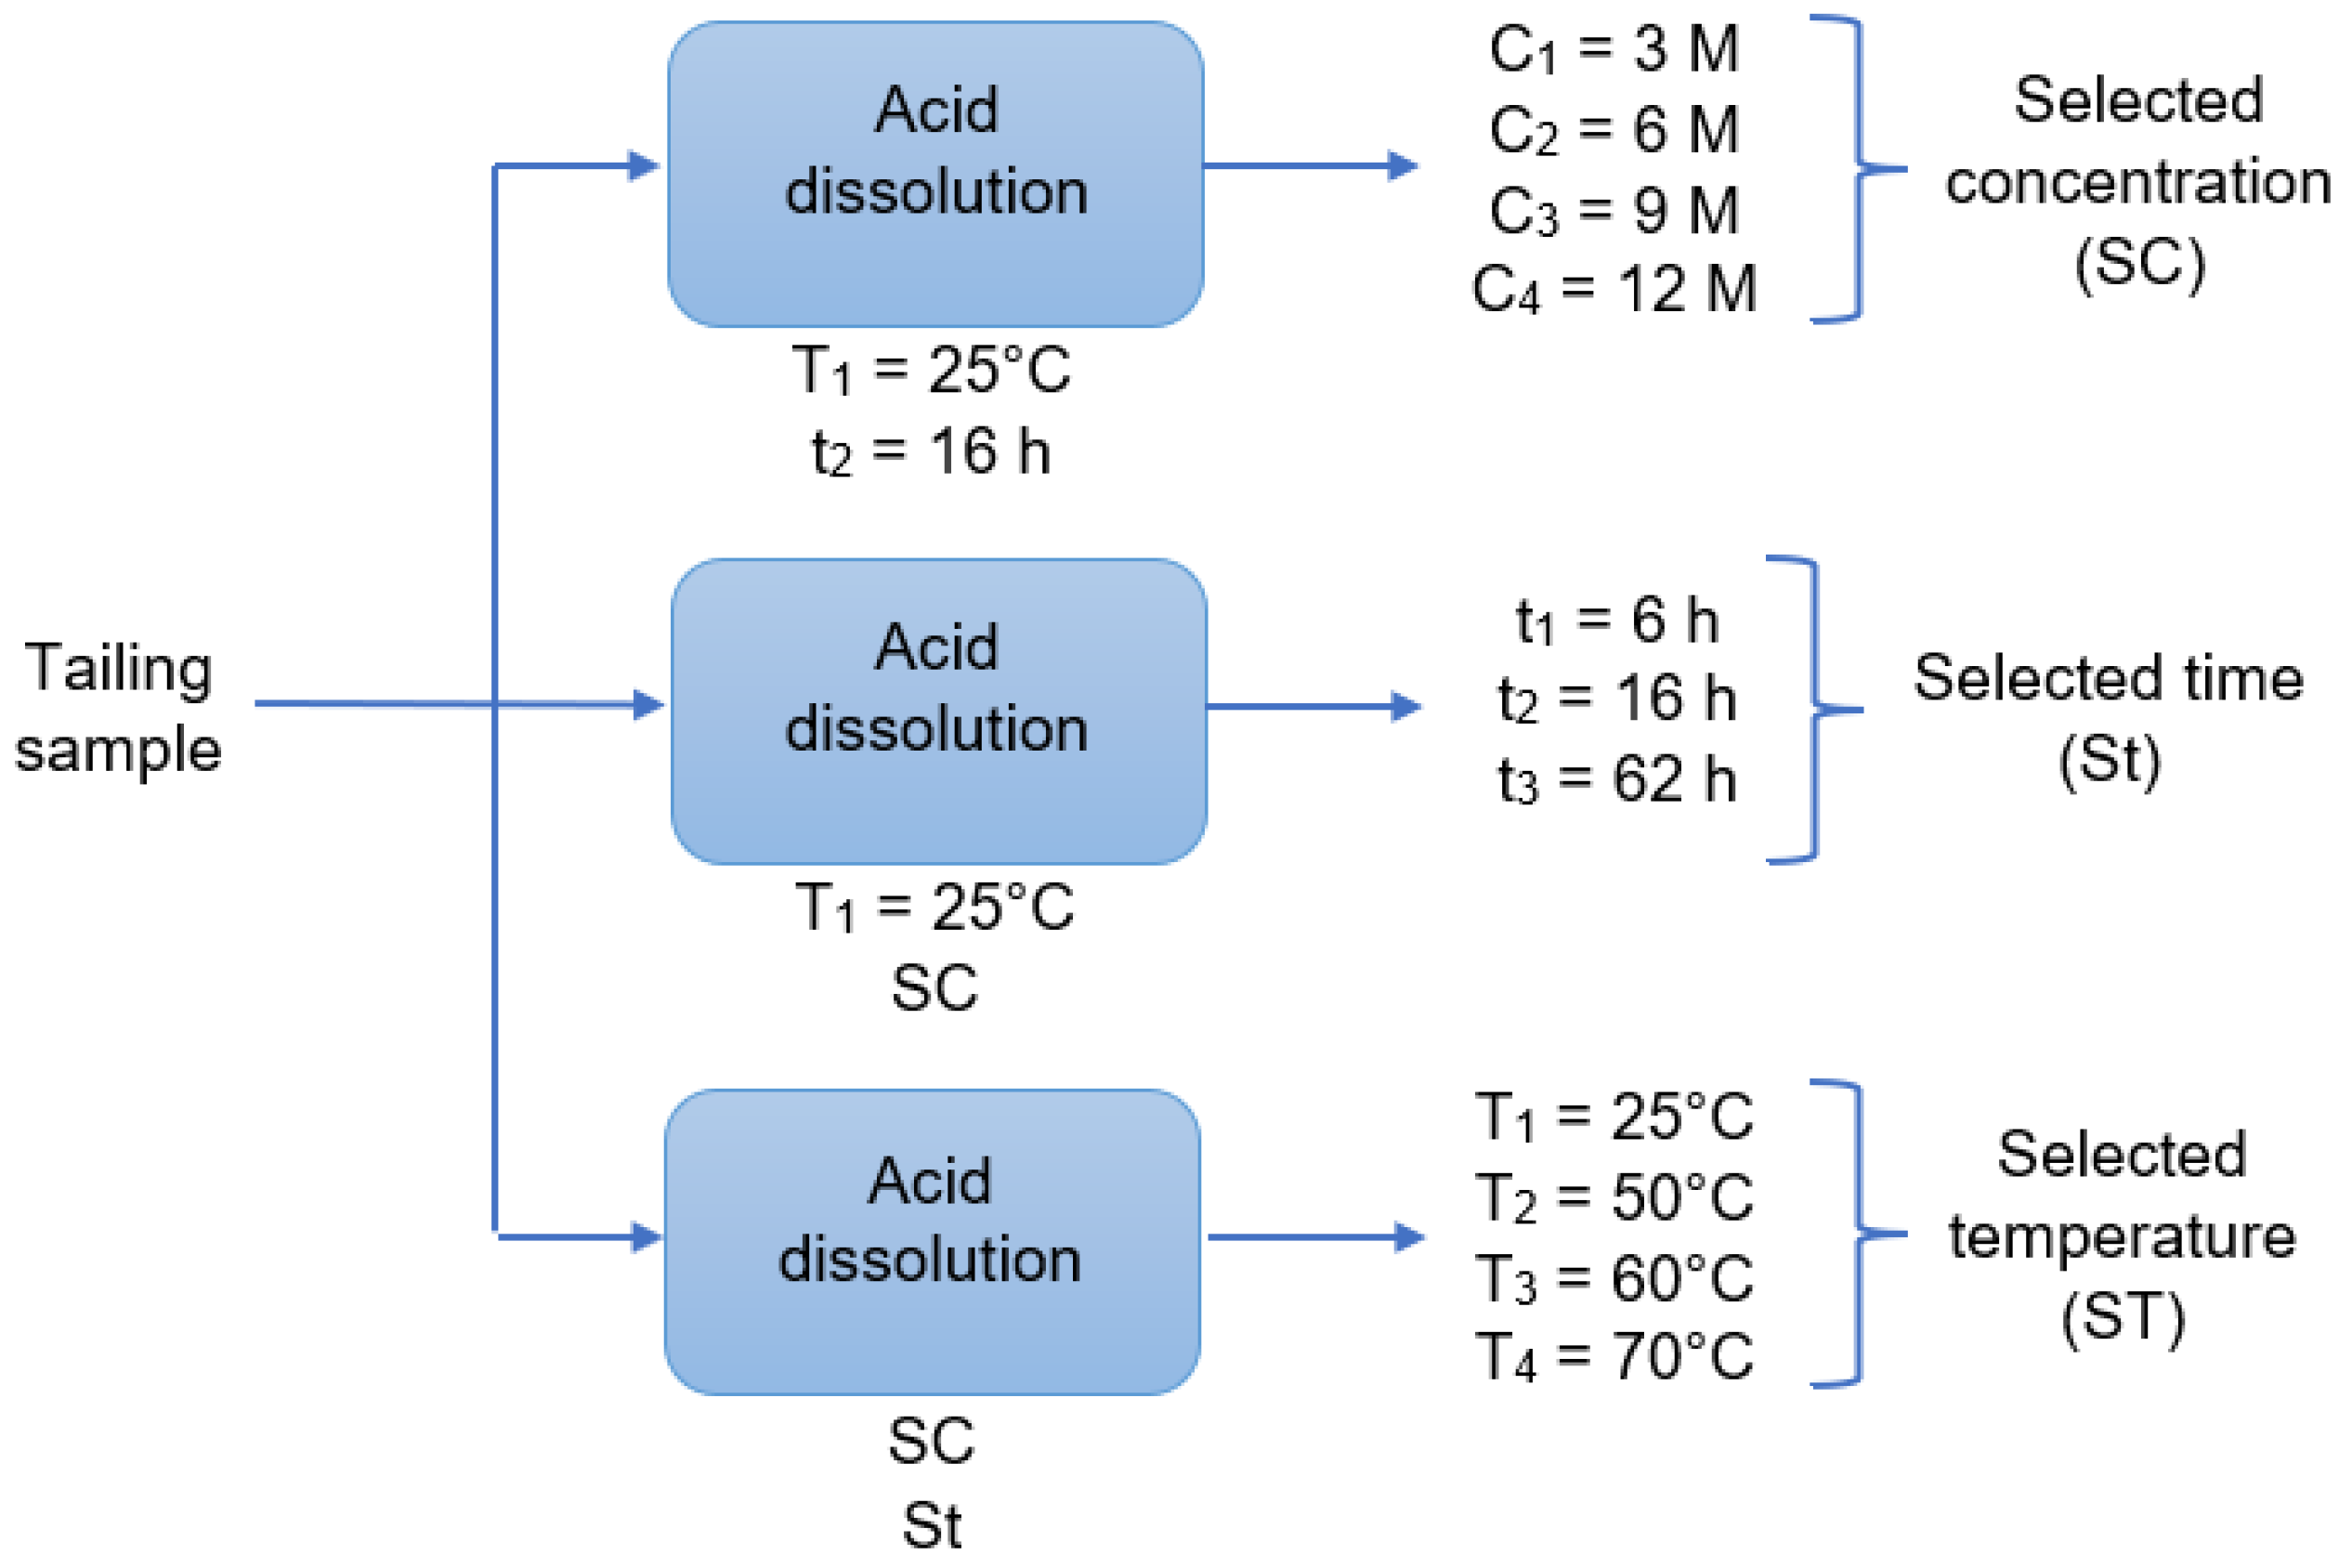
34. Results
34.1. Tailing Sample Characterization
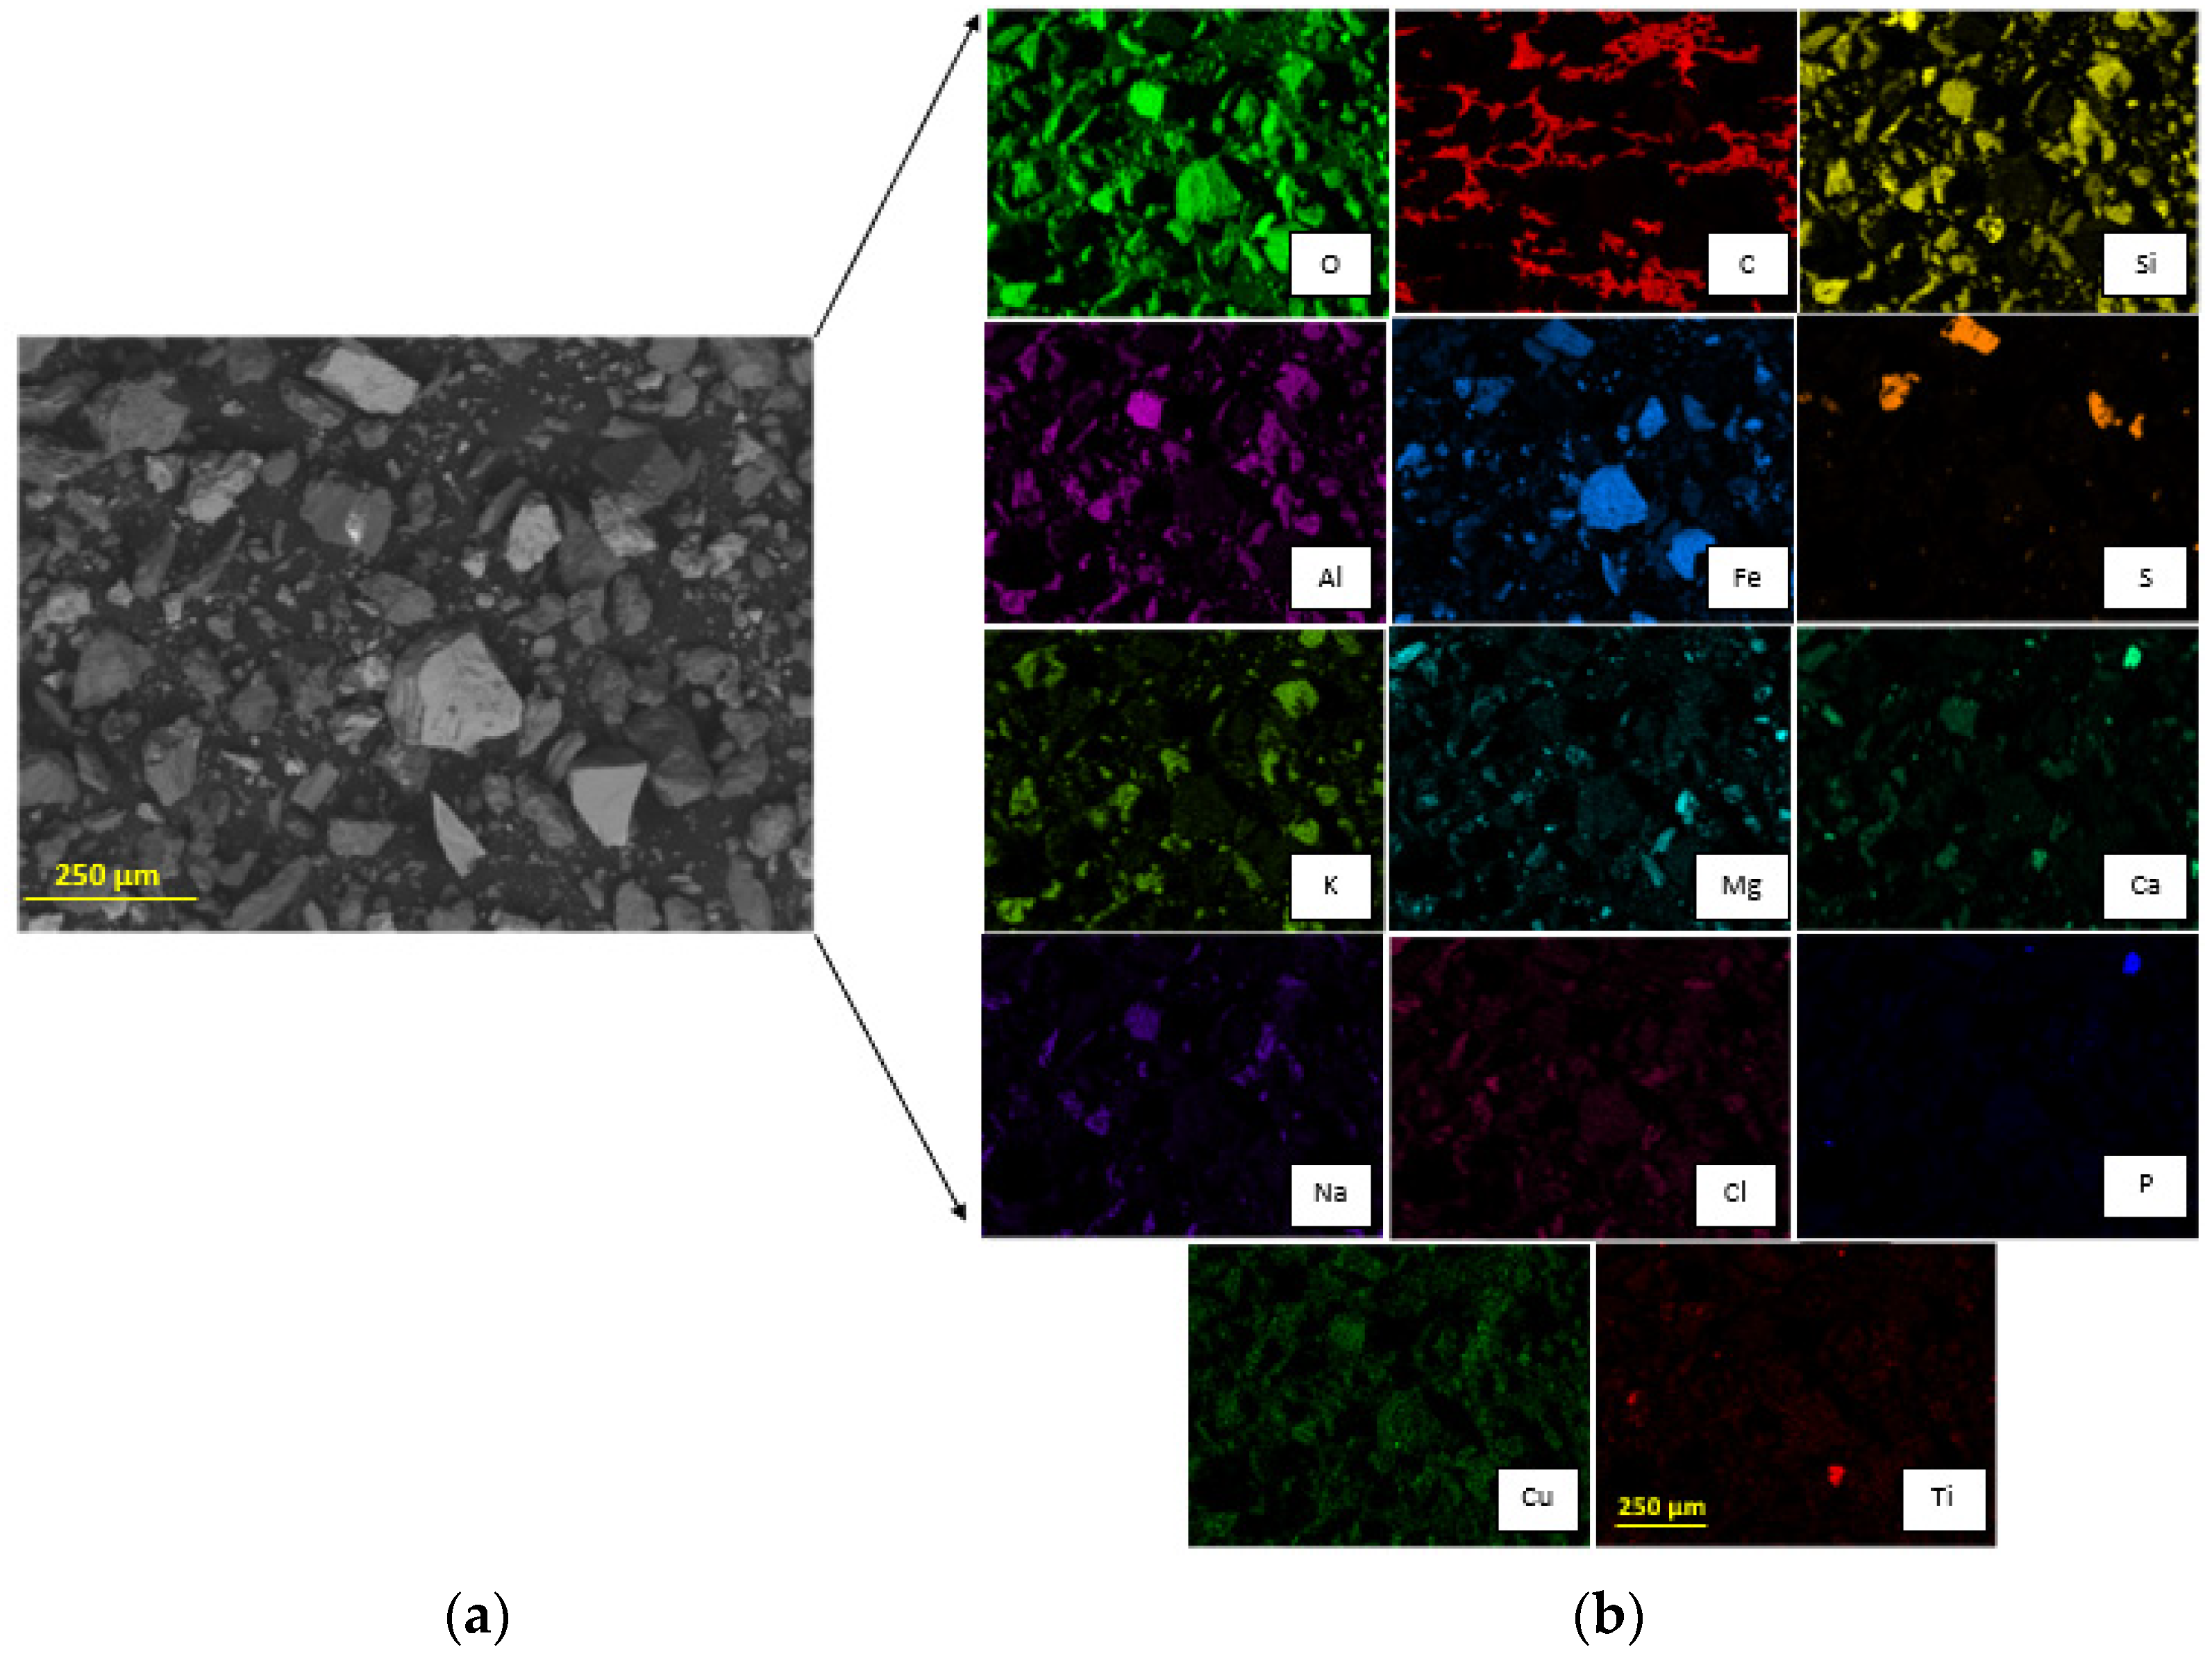
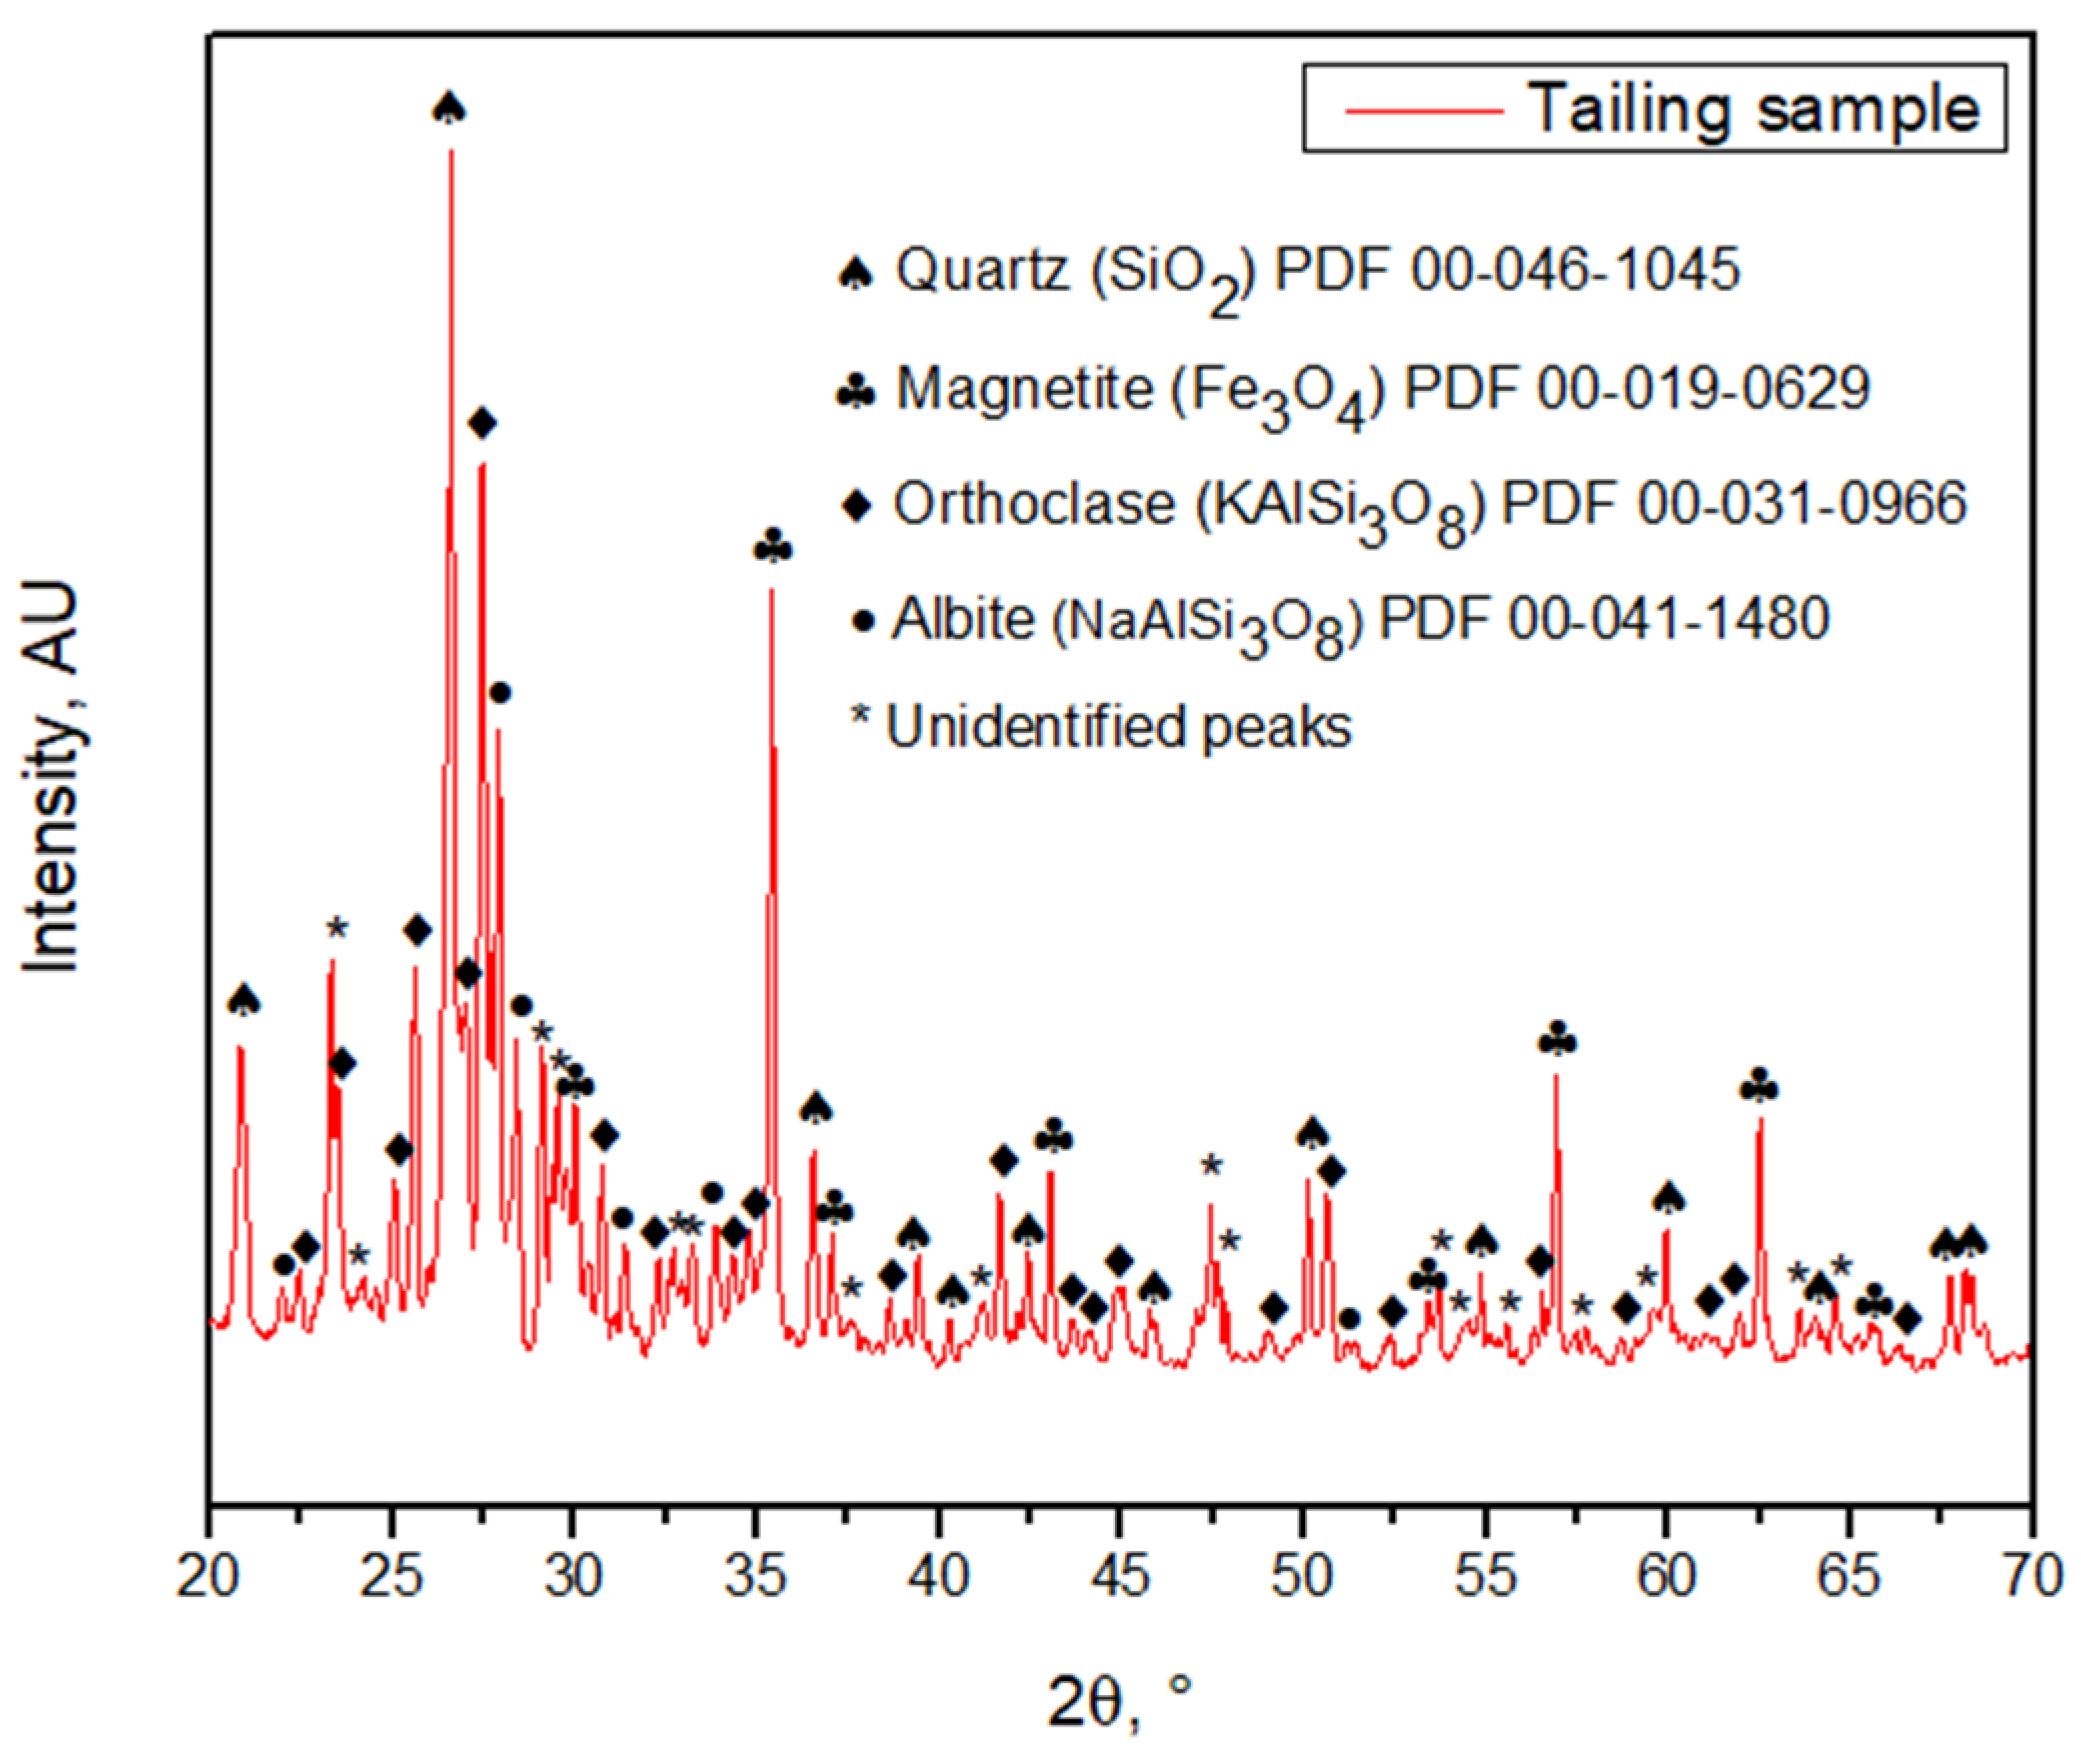
The particle size P80 was 221 ± 23 µm according to the granulometric analysis by sieving, and 216 ± 0.652 µm according to the Laser Diffraction analysis, meaning that 80% of the sample is approximately below an ASTM 60 mesh, corresponding to 250 µm (Figure 3). The morphology and general composition of the tailing sample were identified by SEM-EDX, as seen in Figure 4. At 100×, the tailing particles are irregular, and the composition is based on silicates and iron oxides. The XRD analysis, shown in Figure 5, was applied to the tailing sample, revealing that the composition was mainly quartz (SiO2), magnetite (Fe3O4), orthoclase (KAlSi3O8), and albite (NaAlSi3O8), confirming the SEM-EDX analysis. Through AAS, it was determined that the tailing contains a total iron grade of 19%.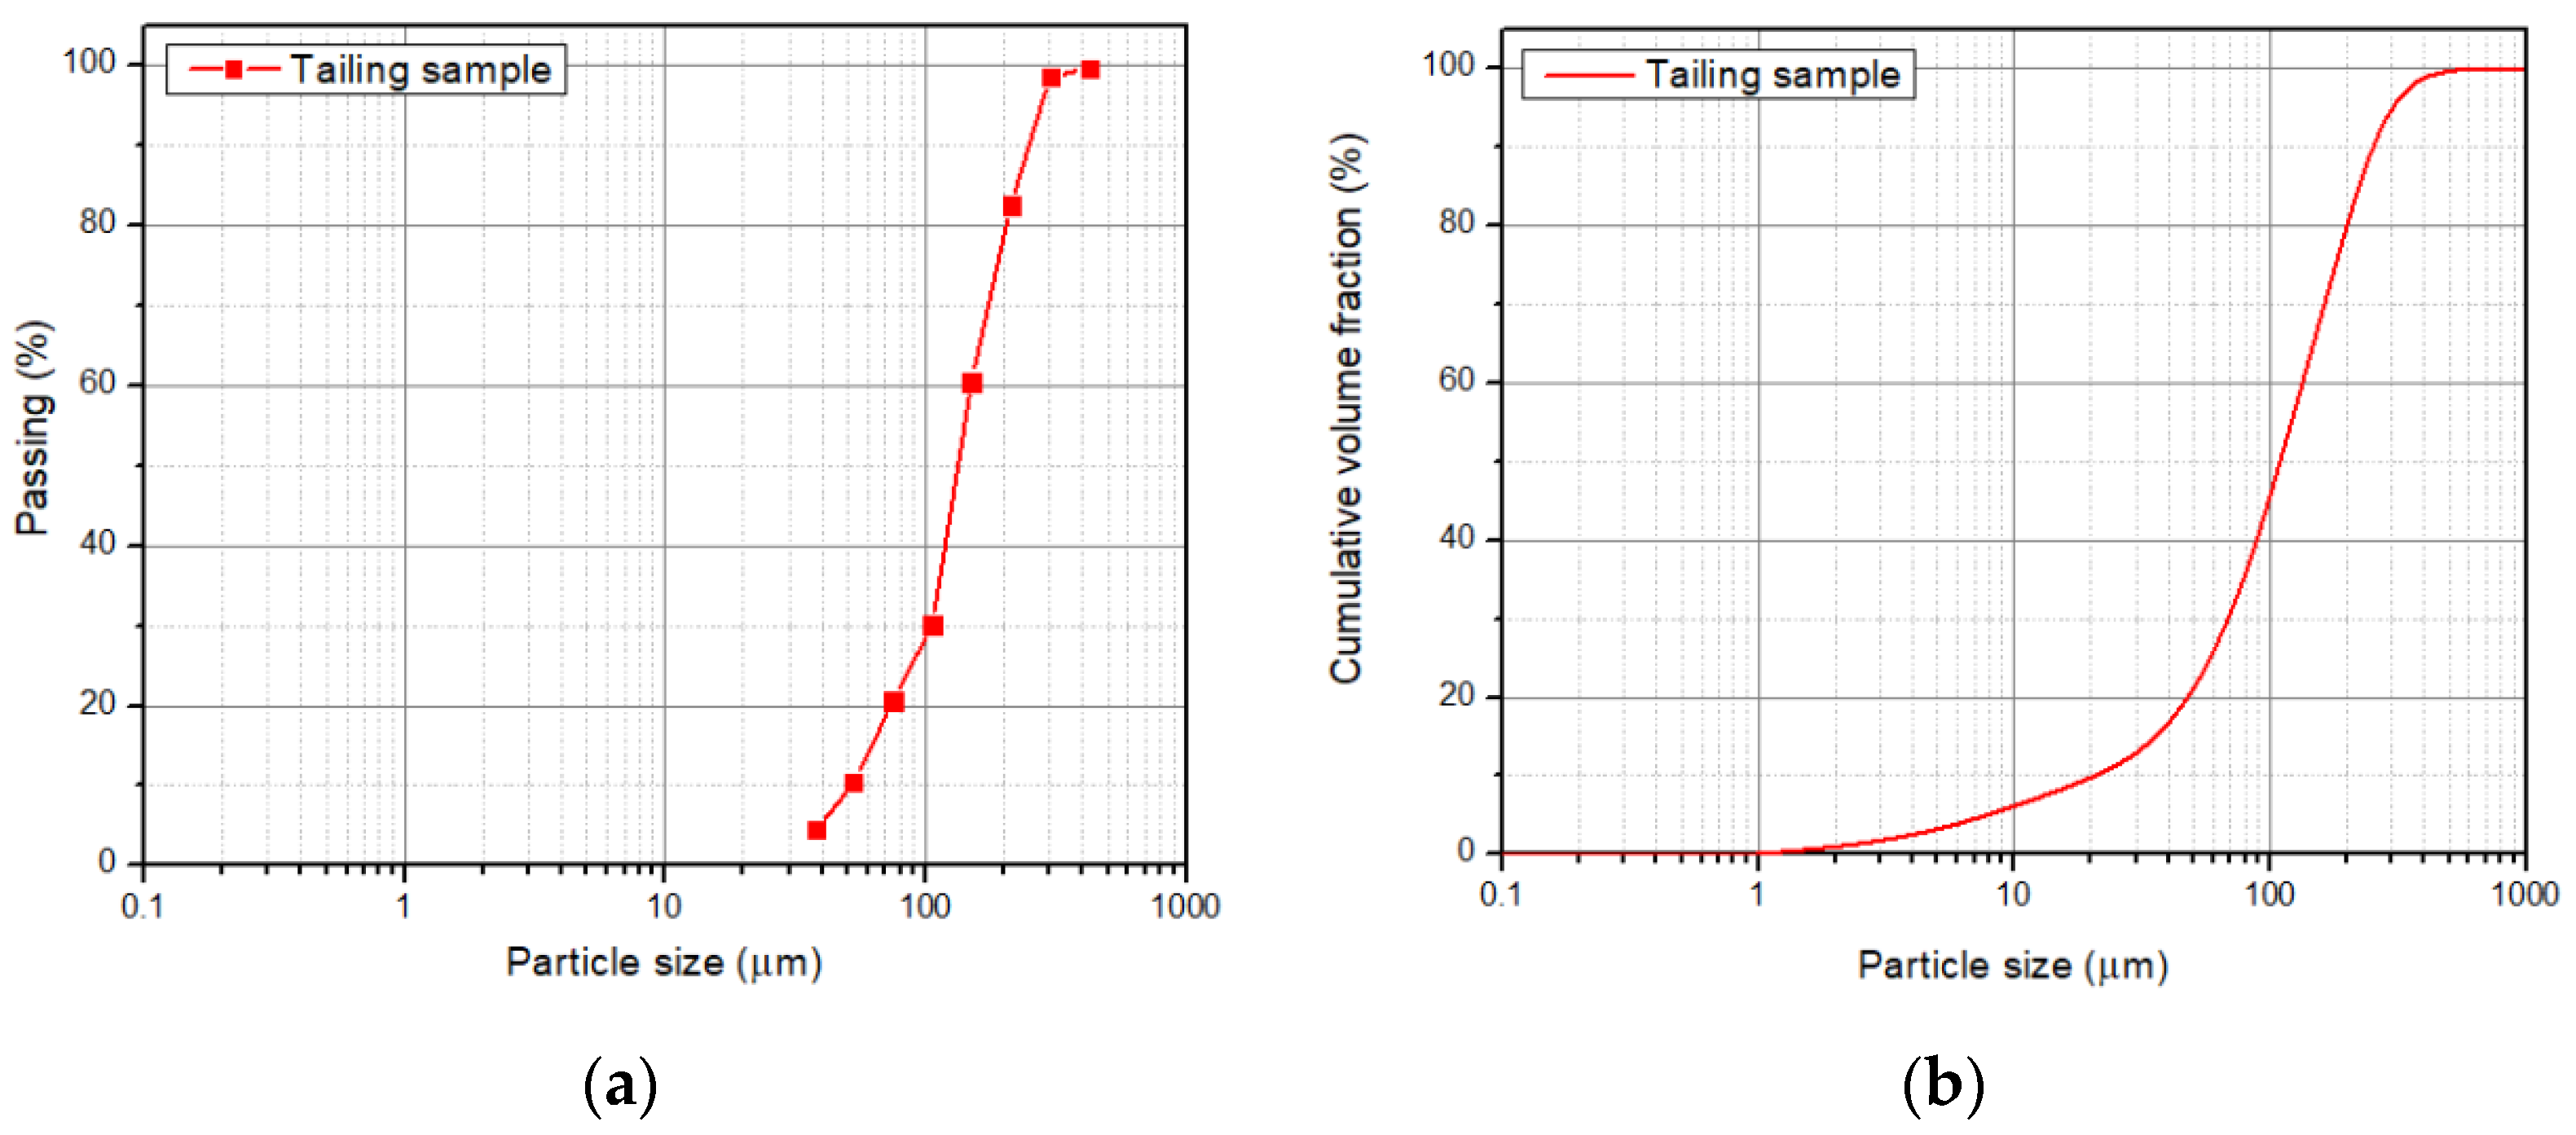
34.2. Acid Solution Characterization
The acid solutions obtained through leaching and posterior filtration were analyzed by AAS, giving the concentrations of total Fe, Cu, Al, Ca, and Mg. The combinations of acid concentration (C), time (t), and temperature (T) for each experiment, along with their results, are shown in Table 1. The concentrations for each element of interest were calculated as the average between the doubled experiments. Therefore, the standard error was calculated.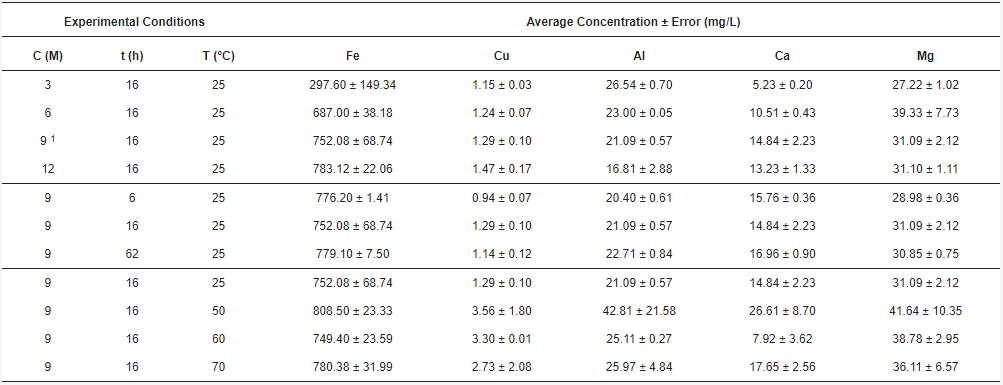
34.3. Insoluble Solid Characterization
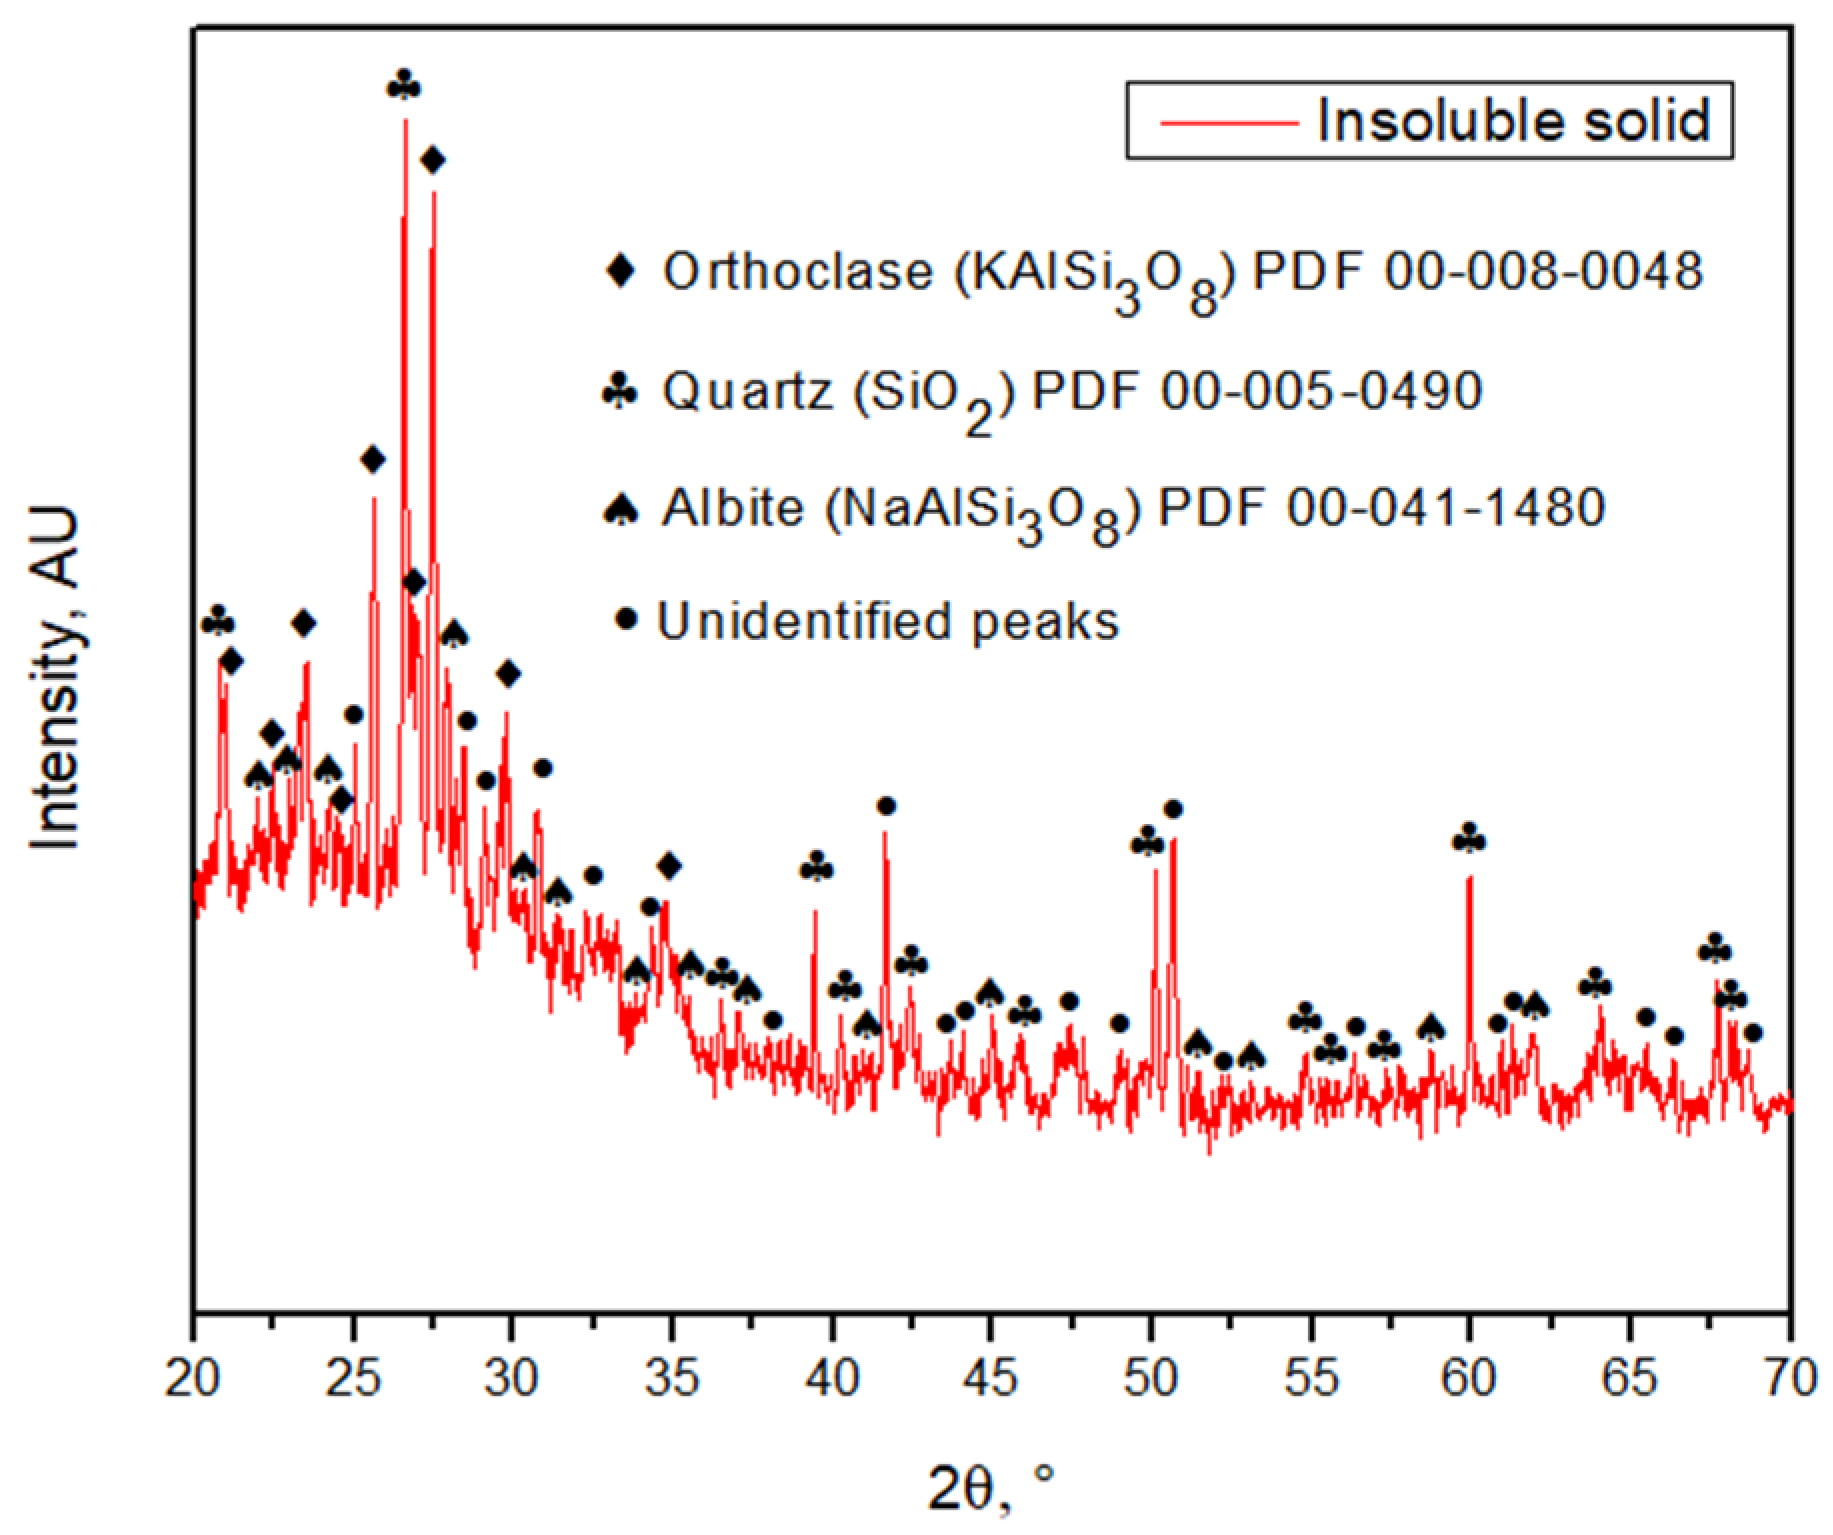
By SEM-EDX analysis, it was found that the solid samples had an irregular morphology composed mainly of silica with presence of several elements. Figure 6 shows one of the insoluble solids obtained from a solution leached with HCl 9 M, at 25 °C, for 16 h. The grains are irregularly shaped and the elements are mostly homogeneously distributed in the sample. Table 2 shows the elemental composition of the tailing sample and the insoluble solid sample obtained under the conditions of HCl 9 M, 25 °C, and 16 h of leaching, by EDX. Results show the weight percent of each element found. Figure 7 shows the XRD of the sample obtained at 9 M, at 25 °C, for 16 h. The main phases in the sample are orthoclase (KAlSi3O8), quartz (SiO2), and albite (NaAlSi3O8), matching the SEM-EDX analysis. In the same analysis, it is possible to observe peaks corresponding to other unidentified crystalline species marked with black circles. For further comparison between the tailing sample and the insoluble solid, an X-ray Fluorescence (XRF) analysis was performed on both samples. The results are shown in Table 3.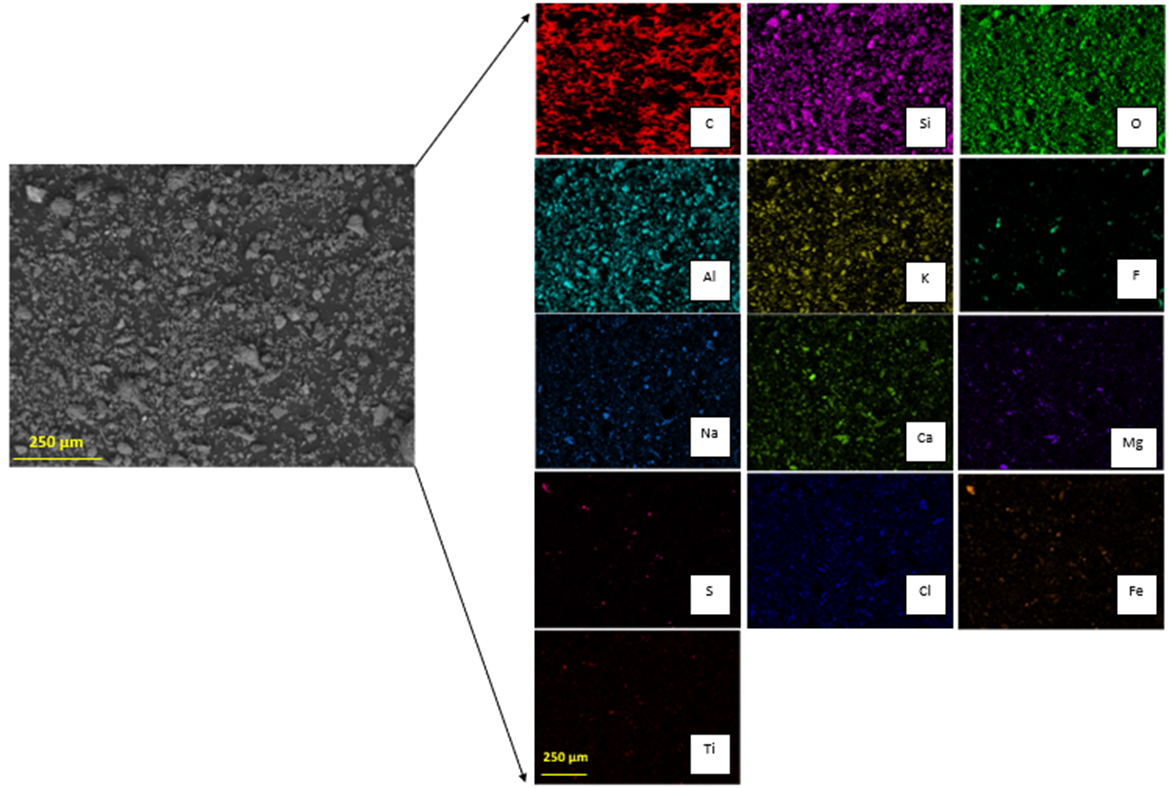


45. Discussion

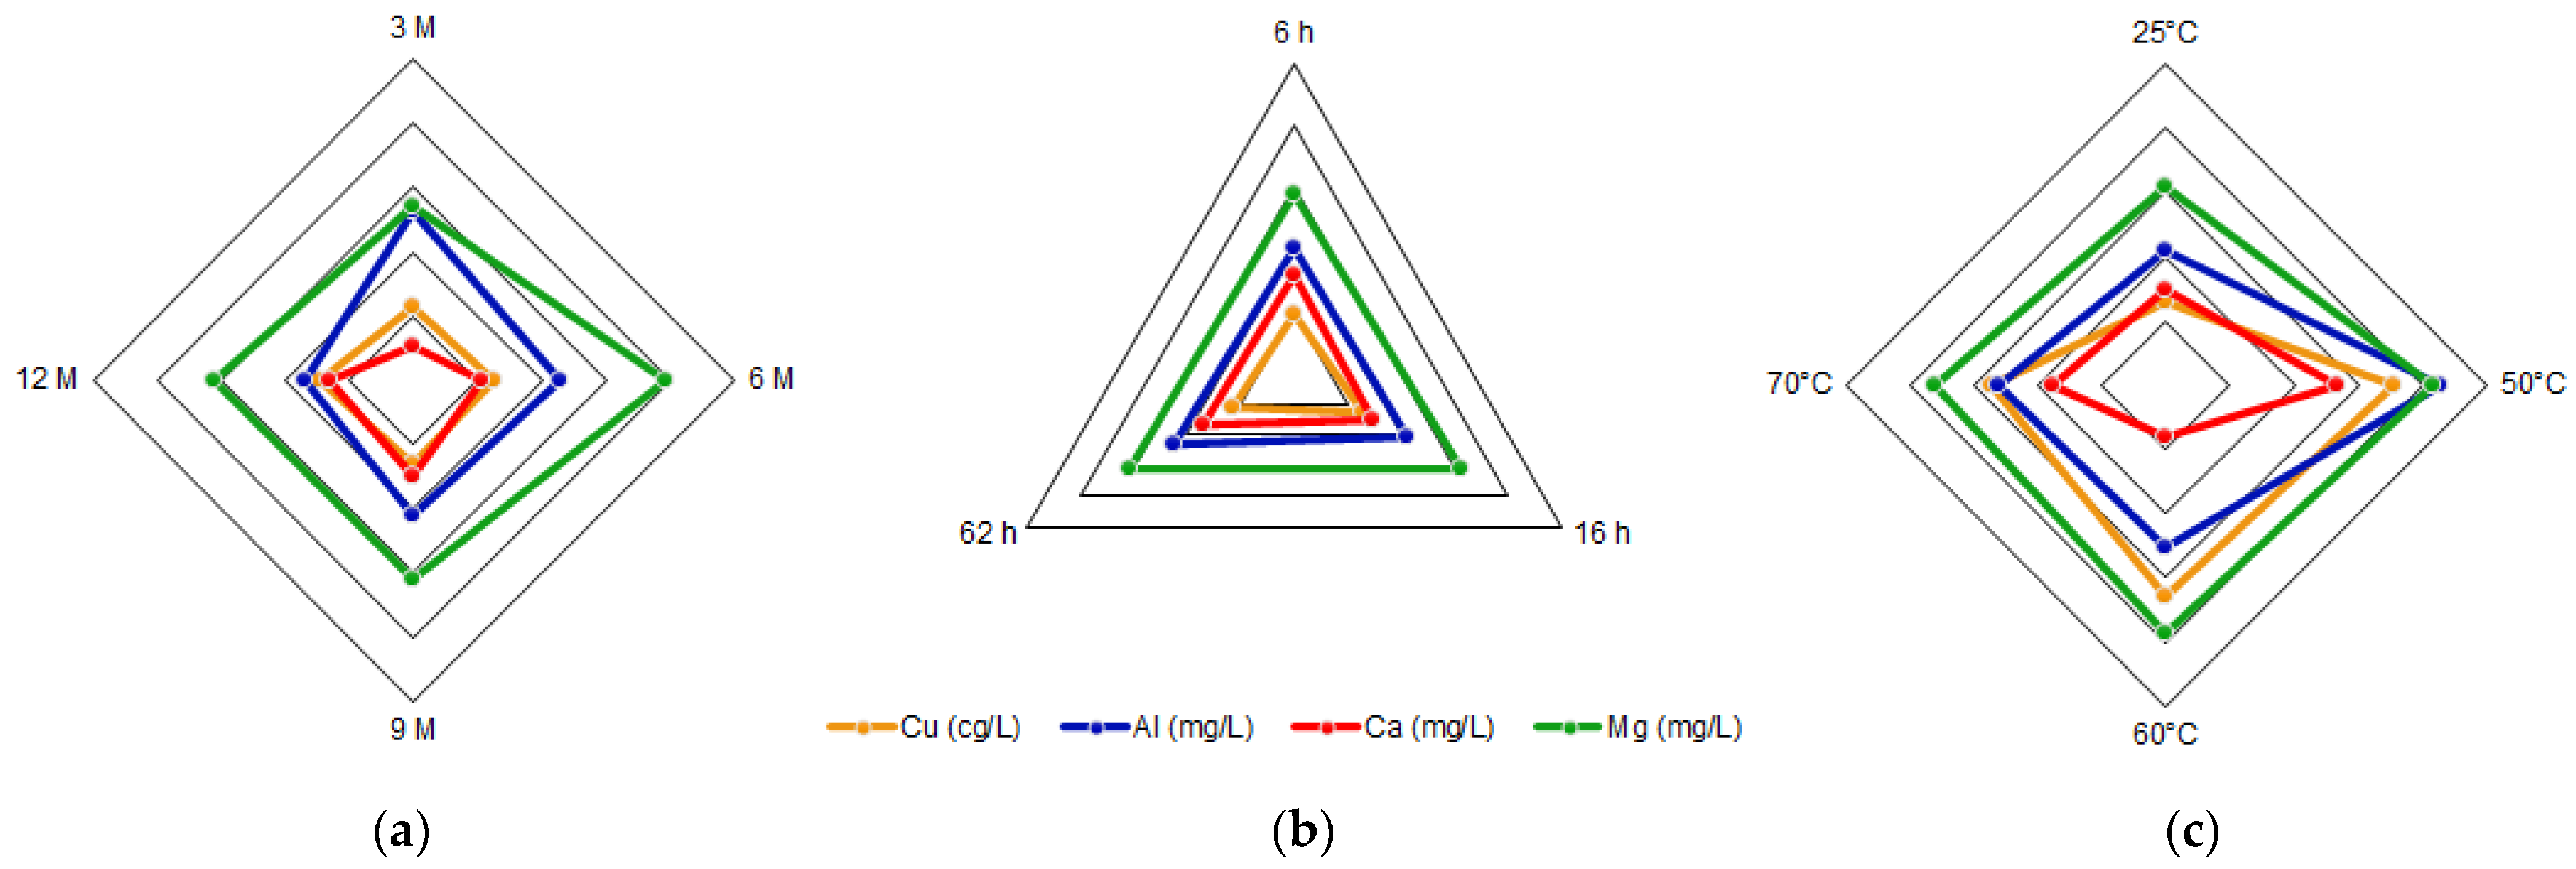
56. Conclusions
The tailings of northern Chile contain an important amount of iron and other valuable species, such as copper and aluminum, which can be extracted through leaching with hydrochloric acid. The most relevant condition in this process is the acid concentration, due to its effect on the extraction of metals. Conditions can be selected according to the element that wants to be obtained, e.g., if a high iron extraction is wanted, a high acid concentration should be applied, while on the contrary, if a high extraction of aluminum is wanted, a low acid concentration should be used. The variables time and temperature do not show a relevant influence on the iron concentration, so it can be considered that it presents a constant behavior. Within the ranges studied, the conditions of 9 M acid concentration, 16 h reaction time, and a temperature of 25 °C were selected as the optimum leaching parameters. This process differs from traditional leaching by using hydrochloric acid instead of sulfuric acid; in addition, the raw material is a residue from a metallurgical process instead of mined ore. This proves that valuable elements such as iron, copper, and aluminum, along with calcium and magnesium, can be extracted from copper tailings for further valorization. The silicates obtained in the insoluble portion show low iron concentrations and could be used in other applications such as additives in the construction industry.References
- Aznar-Sánchez, J.A.; García-Gómez, J.J.; Velasco-Muñoz, J.F. Mining Waste and Its Sustainable Management: Advances in Worldwide Research. Minerals 2018, 8, 284.
- Reichl, C.; Schatz, M.; Zsak, G. World Mining Data. Miner. Prod. 2017, 32, 1–261.
- Cortés, S.; Soto, E.E.; Ordóñez, J.I. Recovery of Copper from Leached Tailing Solutions by Biosorption. Minerals 2020, 10, 158.
- Upadhyay, A.; Laing, T.; Kumar, V.; Dora, M. Exploring barriers and drivers to the implementation of circular economy practices in the mining industry. Resour. Policy 2021, 72, 102037.
- Kinnunen, P.; Kaksonen, A.H. Towards circular economy in mining: Opportunities and bottlenecks for tailings valorization. J. Clean. Prod. 2019, 228, 153–160.
- Araya, N.; Kraslawski, A.; Cisternas, L.A. Towards mine tailings valorization: Recovery of critical materials from Chilean mine tailings. J. Clean. Prod. 2020, 263, 121555.
- Valderrama, L.; Santander, M.; Zazzali, B.; Carmona, M. Concentración Magnética Aplicada a Relaves de cobre. HOLOS 2014, 6, 37–44.
- Lacassie, J.P.; Vivallo, W.; Díaz, A.; Ruiz-del-Solar, J. Geoquímica de yacimientos metálicos y de sedimentos, de las regiones de Atacama y Coquimbo, norte de Chile. In Proceedings of the XIV Congreso Geológico Chileno, La Serena, Chile, 4–8 October 2015; pp. 429–432.
- Ristović, I.; Štyriaková, D.; Štyriaková, I.; Šuba, J.; Širadović, E. Bioleaching Process for Copper Extraction from Waste in Alkaline and Acid Medium. Minerals 2022, 12, 100.
- Vargas, F. Copper Tailings as Supplementary Cementitious Material: Activation, Leaching and Environmental Behaviour; Pontificia Universidad Católica de Chile: Santiago de Chile, Chile, 2020.
- Godirilwe, L.L.; Haga, K.; Altansukh, B.; Takasaki, Y.; Ishiyama, D.; Trifunovic, V.; Avramovic, L.; Jonovic, R.; Stevanovic, Z.; Shibayama, A. Copper Recovery and Reduction of Environmental Loading from Mine Tailings by High-Pressure Leaching and SX-EW Process. Metals 2021, 11, 1335.
- Wang, J.; Zhang, Y.; Yu, L.; Cui, K.; Fu, T.; Mao, H. Effective separation and recovery of valuable metals from waste Ni-based batteries: A comprehensive review. Chem. Eng. J. 2022, 439, 135767.
- Chen, M.; Han, Z.; Wang, L. Recovery of valuable metals from copper slag by hydrometallurgy. Adv. Mater. Res. 2011, 402, 35–40.
- Goryachev, A.; Svetlov, A.; Kompanchenko, A.; Makarov, D. Sulfuric Acid Granulation of Copper—Nickel Ore Tailings: Leaching of Copper and Nickel in the Presence of Sulfide Oxidation Activators. Minerals 2022, 12, 129.
- Dimitrijević, M.; Urošević, D.; Milić, S.; Sokić, M.; Marković, R. Dissolution of copper from smelting slag by leaching in chloride media. J. Min. Metall. Sect. B Metall. 2017, 53, 407–412.
- Adrianto, L.R.; Pfister, S. Prospective environmental assessment of reprocessing and valorization alternatives for sulfidic copper tailings. Resour. Conserv. Recycl. 2022, 186, 106567.
- Leiva, E.; Cayazzo, M.; Dávila, L.; Torres, M.; Ledezma, C. Acid Mine Drainage Dynamics from a Paste Tailing Deposit: Effect of Sulfate Content on the Consistency and Chemical Stability after Storage. Metals 2021, 11, 860.
- Google Maps. Tailing Location. Available online: https://www.google.com/maps/@-28.548177,-70.736858,450m/data=!3m1!1e3?hl=en-US (accessed on 19 October 2022).
- Tang, H.; Zhao, L.; Yang, Y.; Han, H.; Wang, L.; Sun, W. Dissolution Kinetics of Chlorine from Iron Ore Sintering Dust. Metals 2021, 11, 1185.
- Šajn, R.; Ristovic, I.; Ceplak, B. Mining and Metallurgical Waste as Potential Secondary Sources of Metals—A Case Study for the West Balkan Region. Minerals 2022, 12, 547.
- Tao, L.; Wang, L.; Yang, K.; Wang, X.; Chen, L.; Ning, P. Leaching of iron from copper tailings by sulfuric acid: Behavior, kinetics and mechanism. R. Soc. Chem. 2021, 11, 5741–5752.
- Mubarak, Y. Leaching of Copper Ores: Effects of Operating Variables. Int. J. Emerg. Trends Eng. Res. 2020, 8, 4226–4235.
- Tayebi-Khorami, M.; Edraki, M.; Corder, G.; Golev, A. Re-Thinking Mining Waste through an Integrative Approach Led by Circular Economy Aspirations. Minerals 2019, 9, 286.
